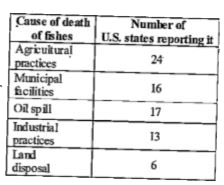
The given table lists the causes of the death of fishes in various states of the United States.
The reduction in the number of fishes is mainly a result of
agricultural practices
industrial practices
land disposal
oil spill
The correct Answer is:A
Step by step video & image solution for The given table lists the causes of the death of fishes in various states of the United States. The reduction in the number of fishes is mainly a result of by Biology experts to help you in doubts & scoring excellent marks in Class 8 exams.
Updated on:21/07/2023Topper's Solved these Questions
- POLLUTION OF AIR AND WATERBOOK - BETOPPERSCHAPTER - POLLUTION OF AIR AND WATEREXERCISE - WORKSHEET 2
11 Videos
- MICROORGANISMS : FRIENDS AND FOEBOOK - BETOPPERSCHAPTER - MICROORGANISMS : FRIENDS AND FOEEXERCISE - COMPETITIVE WORKSHEET
15 Videos
- REACHINGN THE AGE OF ADOLESECENCEBOOK - BETOPPERSCHAPTER - REACHINGN THE AGE OF ADOLESECENCEEXERCISE - COMPETITIVE WORKSHEET
16 Videos
Similar Questions
The given bar graph shows the number of tourists of various states. Study the graph and answer the question that follows.

The number of tourists to which of the following states is less than 10% of the total number of tourist ?
View SolutionThe bar graph given here shows the number of jobseekers of a state in various years at different stages of education.
Study the graph carefully and answer the question based on it.
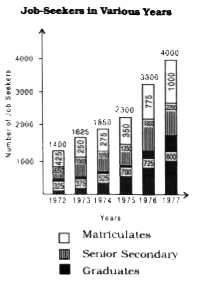
In which year, was the number of Matriculate job-seekers maximum ?
View Solution
Knowledge Check
Oil slick causes mass scale death of fish due to
AClogging of gillsBNon-availability of oxygen in waterCNon-abailability of foodDDisruption of food chain.Oil slick causes mass-scale death of fishes due to
AClogging of gillsBDisruption of food chainCNon-availability of foodDAll of theseWhich cause death of fish in water bodies polluted by sewage?
ADecreases in DOBPathogensCClogging of gills by siltDFoul smell
The bar graph given here shows the number of jobseekers of a state in various years at different stages of education.
Study the graph carefully and answer the question based on it.
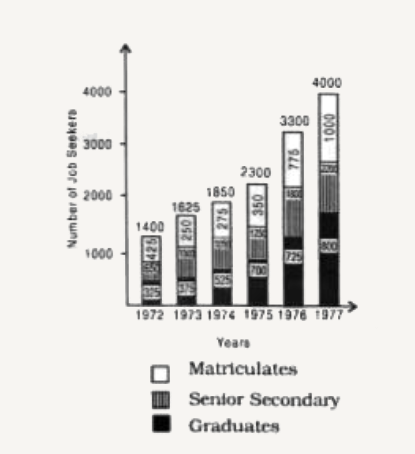
The number of job-seekers, having their qualification as Senior Secondary, in the year 1974 was :
View SolutionThe line graphs shows the number of deaths due to dengiue in acertain state. Study the diagram and answer the following questions.
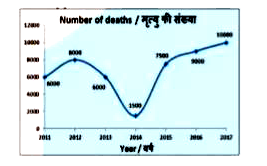
The number of deaths in 2013 were lesser than that in 2016 by ________%.
View SolutionThe line graph shows the number of deaths due to road accidents in a certain state. Study the diagram and answer the following questions.
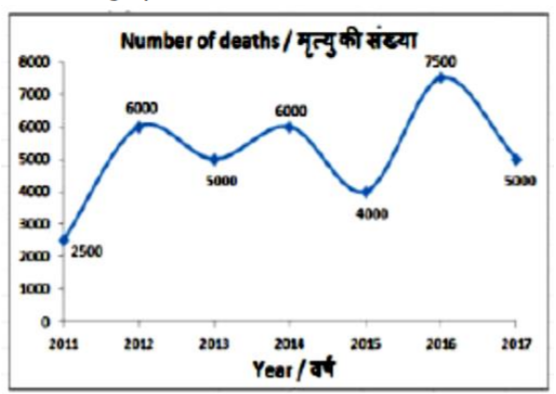
The number of deaths in 2014 were greater than that in 2017 by ________.
View SolutionThe line graph shows the number of deaths due to rail accidents in a certain state. Study the diagram and answer the following questions.
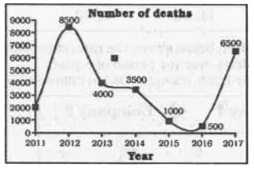
The number of deaths in 2017 was greater than that in 2013 by ____.
View SolutionThe line graph shows the number of deaths due to rail accidents in a certain state. Study the diagram and answer the following questions.

The number of deaths in 2017 was greater than that in 2013 by ____.
View Solution
