The table below shows the data on likely heights of boys and girls as they grow in age. Draw graphs of height and age for both boys and girls on the same graph paper. What conclusions can be drawn from these graphs?
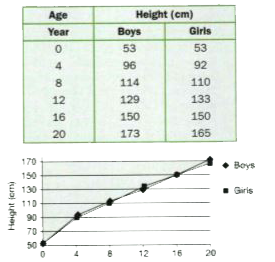
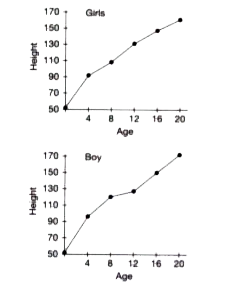
We conclude that initially, girls grow faster than boys but by about 18 years of age both reach about their maximum height. The rate of growth in height varies in different individuals.
Topper's Solved these Questions
- BOOK - PEARSON IIT JEE FOUNDATIONCHAPTER - REACHING THE AGE OF ADOLESCENCEEXERCISE - Competition Corner (MCQs)46videos
REACHING THE AGE OF ADOLESCENCE
- BOOK - PEARSON IIT JEE FOUNDATIONCHAPTER - REACHING THE AGE OF ADOLESCENCEEXERCISE - Classroom Corner (Short Answer)28videos
REACHING THE AGE OF ADOLESCENCE
- BOOK - PEARSON IIT JEE FOUNDATIONCHAPTER - POLLUTION OF AIR AND WATEREXERCISE - COMPETITION CORNER56videos
POLLUTION OF AIR AND WATER
- BOOK - PEARSON IIT JEE FOUNDATIONCHAPTER - REPRODUCTION IN ANIMALS EXERCISE - COMPETITION CORNER50videos
REPRODUCTION IN ANIMALS
Similar Questions
Knowledge Check
- Question 1 - Select One
The given double graph shows the average heights of boys and girls at specific ages. Which conclusion is supported by the graph ?
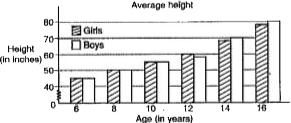 AGirls are taller than boys until the age of 14BGirls and boys grow the same amount each year.CAfter the ago of 14 , boys grow faster than girlsDBoys are always taller than girls
Do both girls and boys grow on same rate?
View SolutionThe following table gives the GDP in rupees (crore) by the three sectors

What conclusions can we draw from the bar graph?View SolutionGiven below is the data of school going students (boys and girls):

Draw the bar graph to represent the above data.View SolutionGiven below is the data of school going students (boys and girls):

Draw the bar graph to represent the above data.View SolutionDraw the 'less than' and 'more than' ogive on the same graph paper from the data given below :
 View Solution
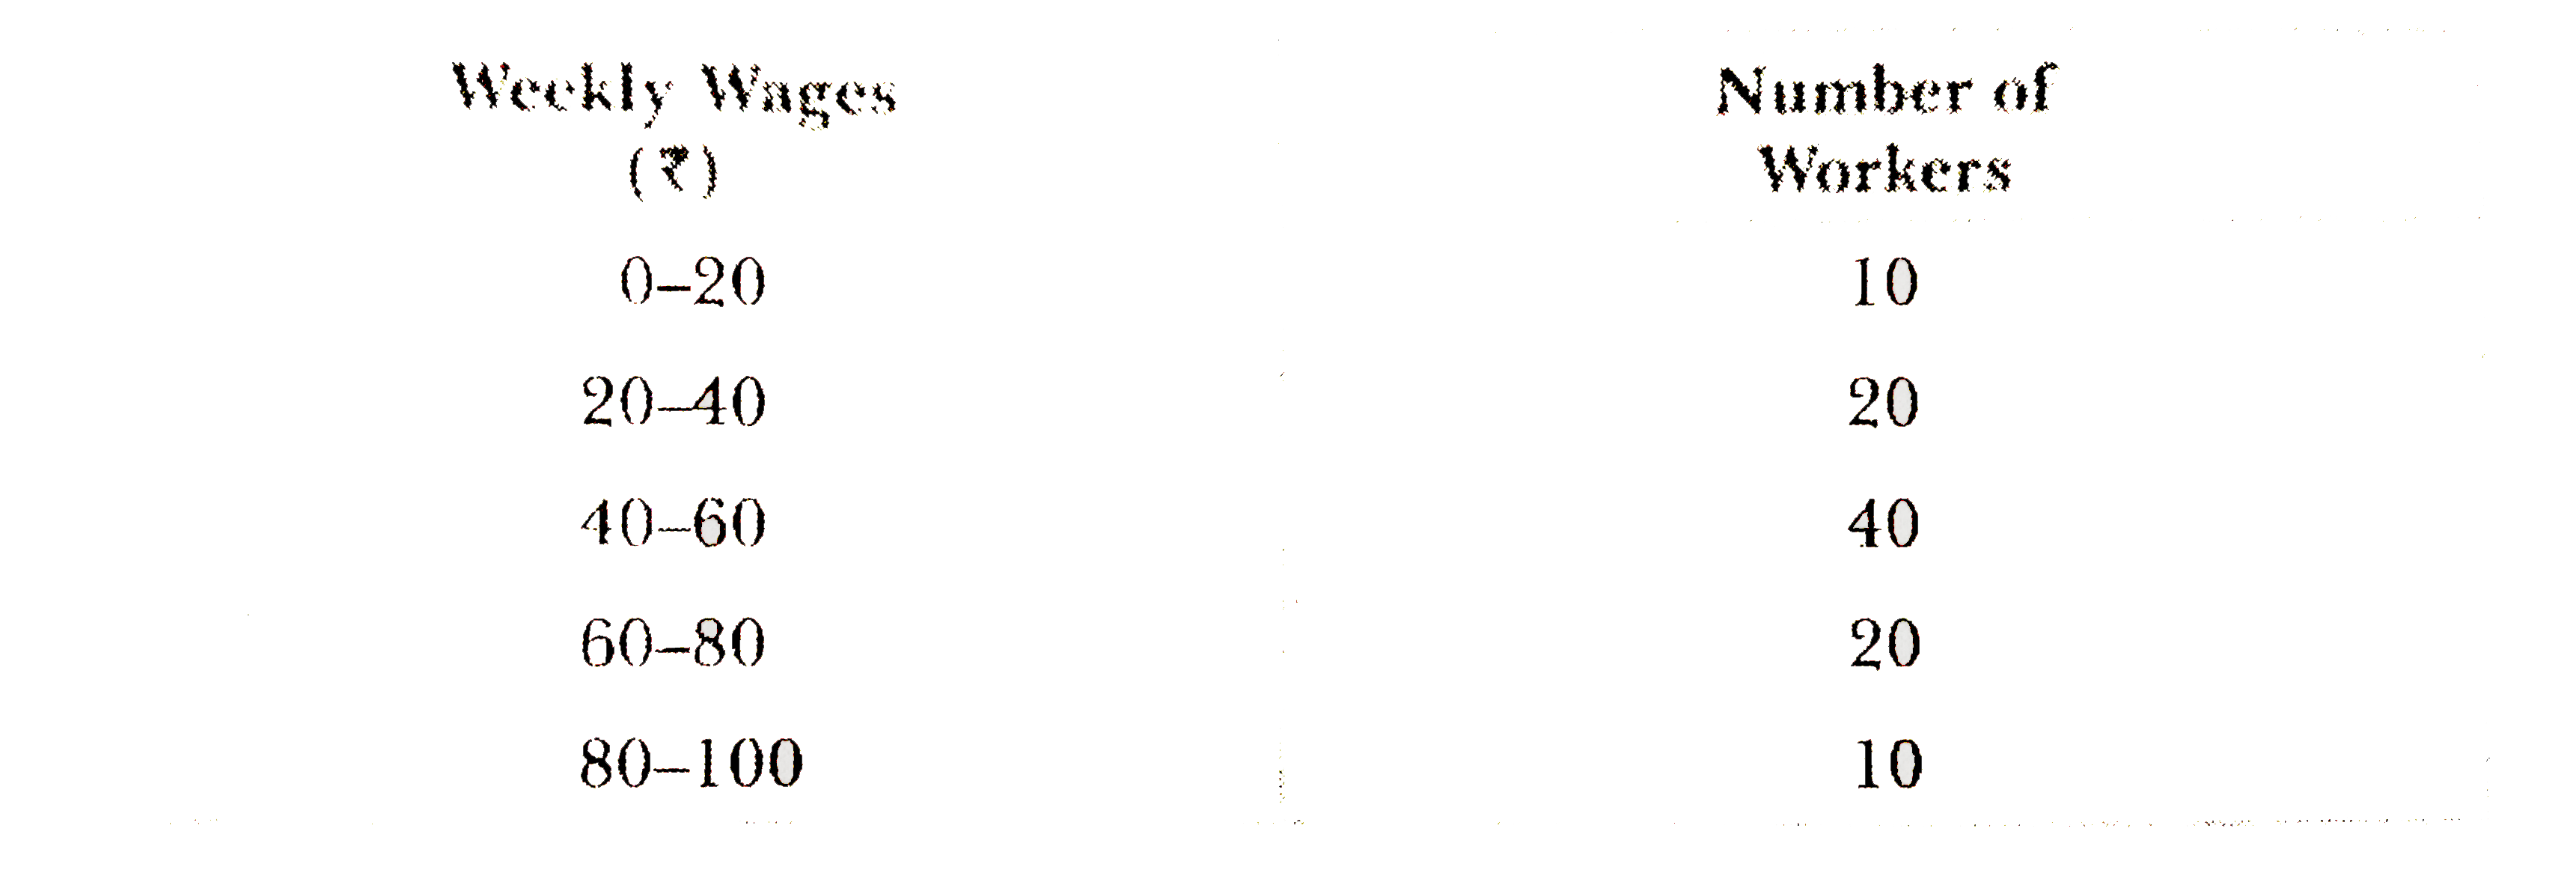
Draw the 'less than' and 'more than' ogive on the same graph paper from the data given below :
 View Solution
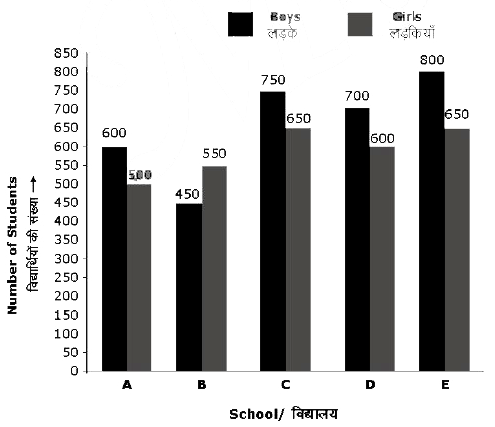
In the given bar graph what is the ratio of the total boys and girls in all schools
 View Solution


