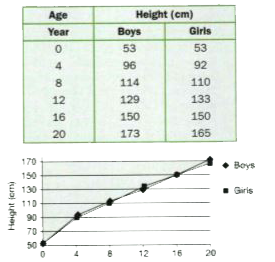
The table below shows the data on likely heights of boys and girls as they grow in age. Draw graphs showing height and age for both boys and girls on the same graph paper. What conclusions can be drawn from these graphs?


Text Solution
The graph depicts the relation between the age and height of both boys and girls. During puberty, there is a sudden increase in height of both boys and girls. On the basis of the above graph, it can be observed that during the age of 4-8 years, girls have less height as compared to boys. However, as soon as girls reach 12- 13 years, their height shows a sudden increase and becomes more than boys. In later years, growth in both sexes becomes stable. Growth during puberty is under the control of hormones.
|
Topper's Solved these Questions
Similar Questions
Knowledge Check
The given double graph shows the average heights of boys and girls at specific ages. Which conclusion is supported by the graph ?
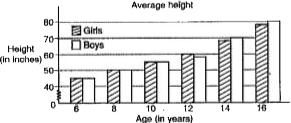 AGirls are taller than boys until the age of 14BGirls and boys grow the same amount each year.CAfter the ago of 14 , boys grow faster than girlsDBoys are always taller than girls
The graph below shows the relationships of per capita population growth rate (r), fecundity (b) and age at first reproduction (α) in an animal speies
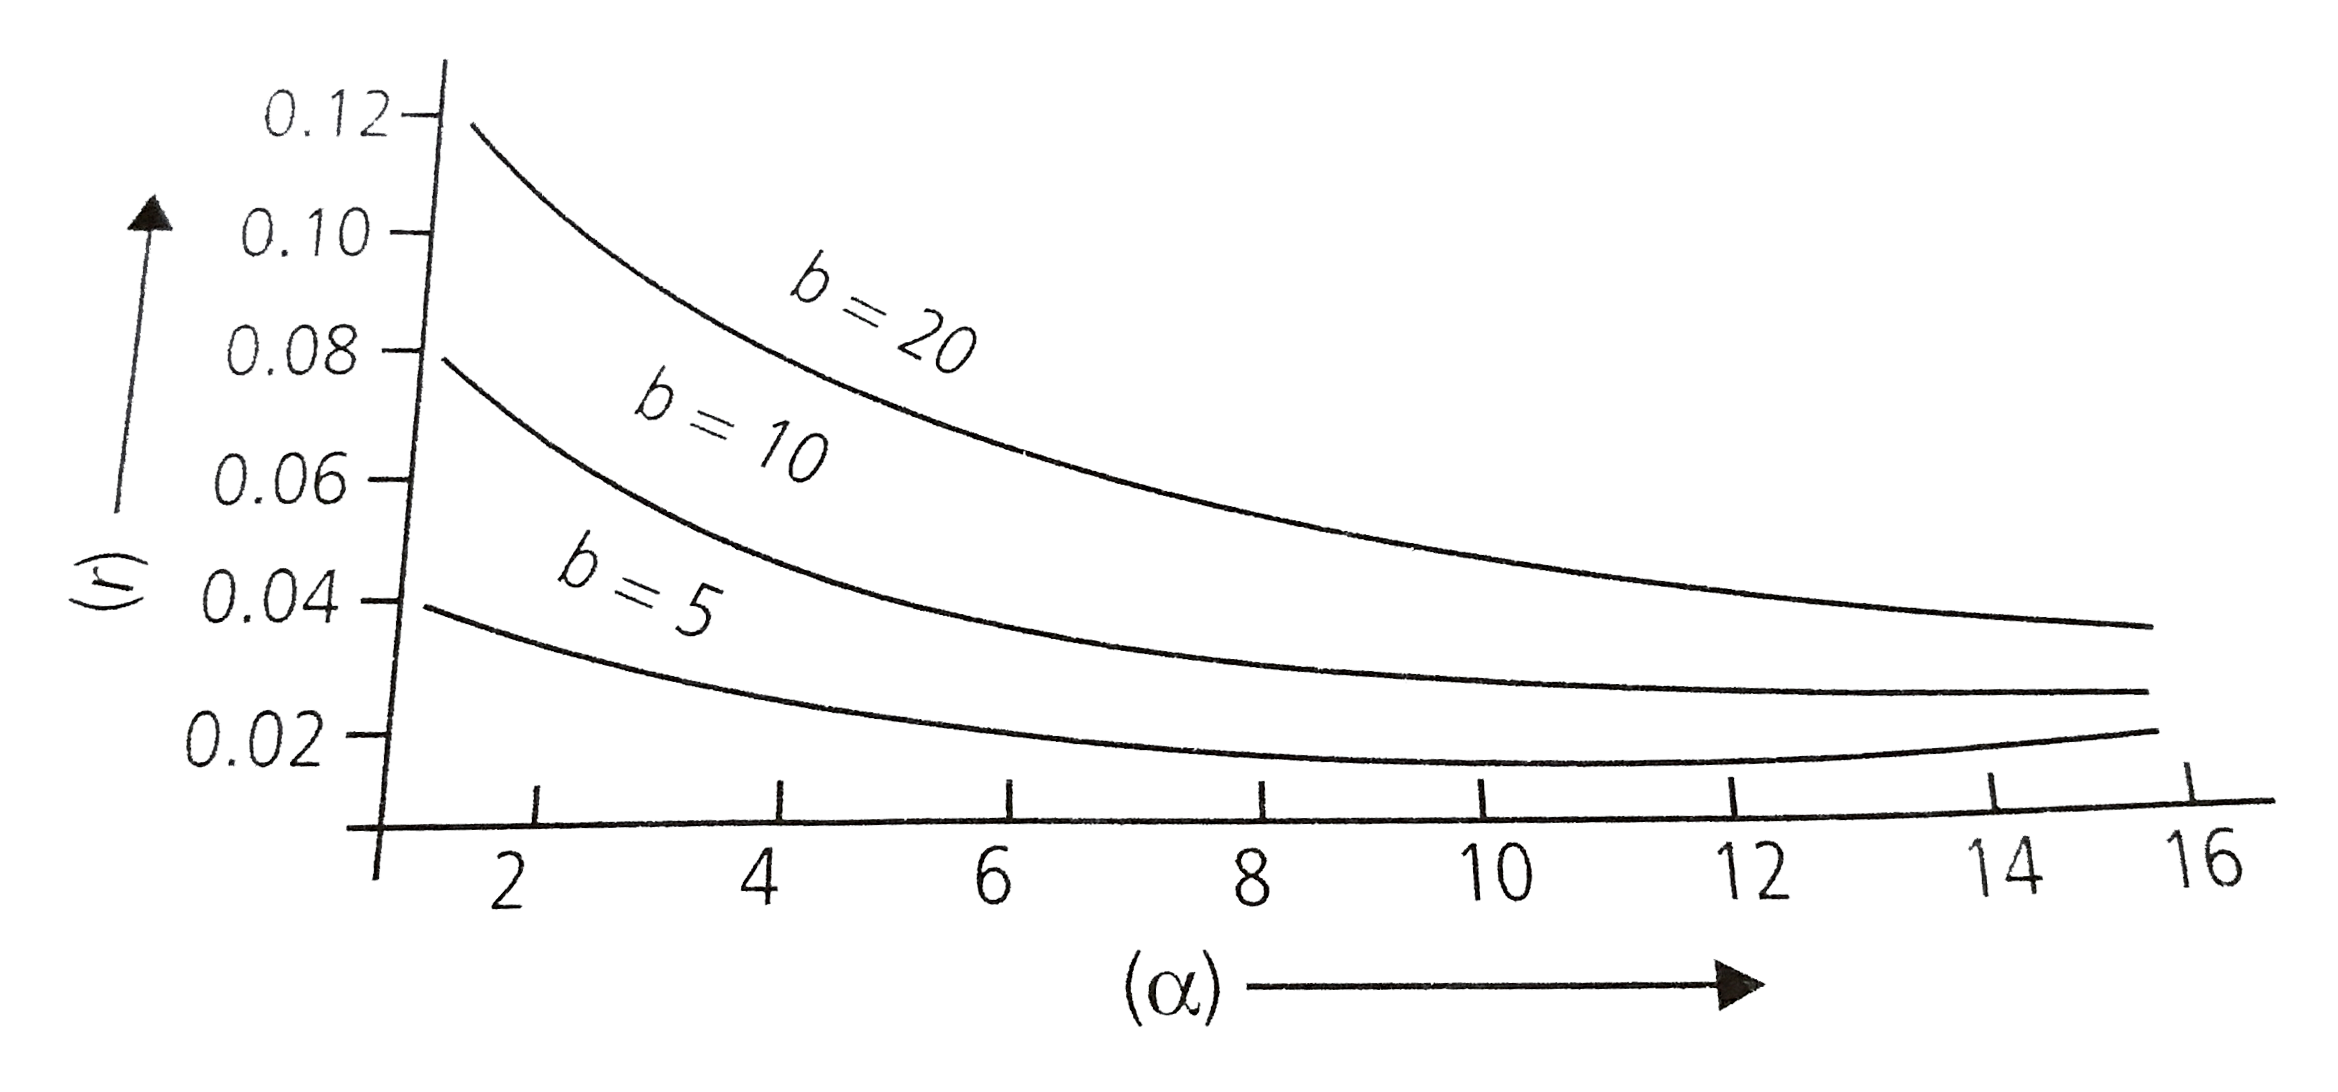
What is the most important conclusion to be drawn from the graph ?AThe population growth rate decreases as first reproduction in postponed to a later stage, regardless of fecundityBAt any α, the higher the fecundity the higher is the population growth rate achievedCAs the age at first reproduction is postponed further, the benefits of increasing fecundity on the population growth rate become progressively negligibleDNone of these
The following table gives the GDP in rupees (crore) by the three sectors

What conclusions can we draw from the bar graph?
View SolutionGiven below is the data of school going students (boys and girls):

Draw the bar graph to represent the above data.
View SolutionGiven below is the data of school going students (boys and girls):

Draw the bar graph to represent the above data.
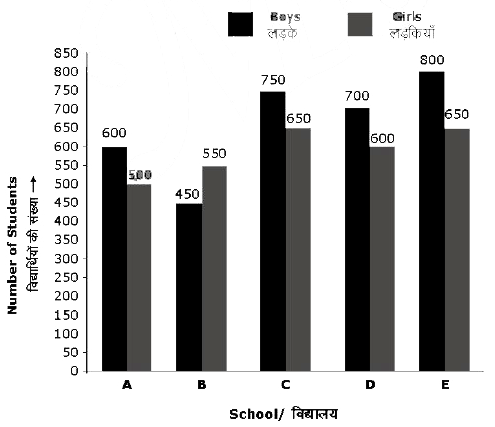
View SolutionIn the given bar graph what is the ratio of the total boys and girls in all schools
View SolutionDraw the 'less than' and 'more than' ogive on the same graph paper from the data given below :

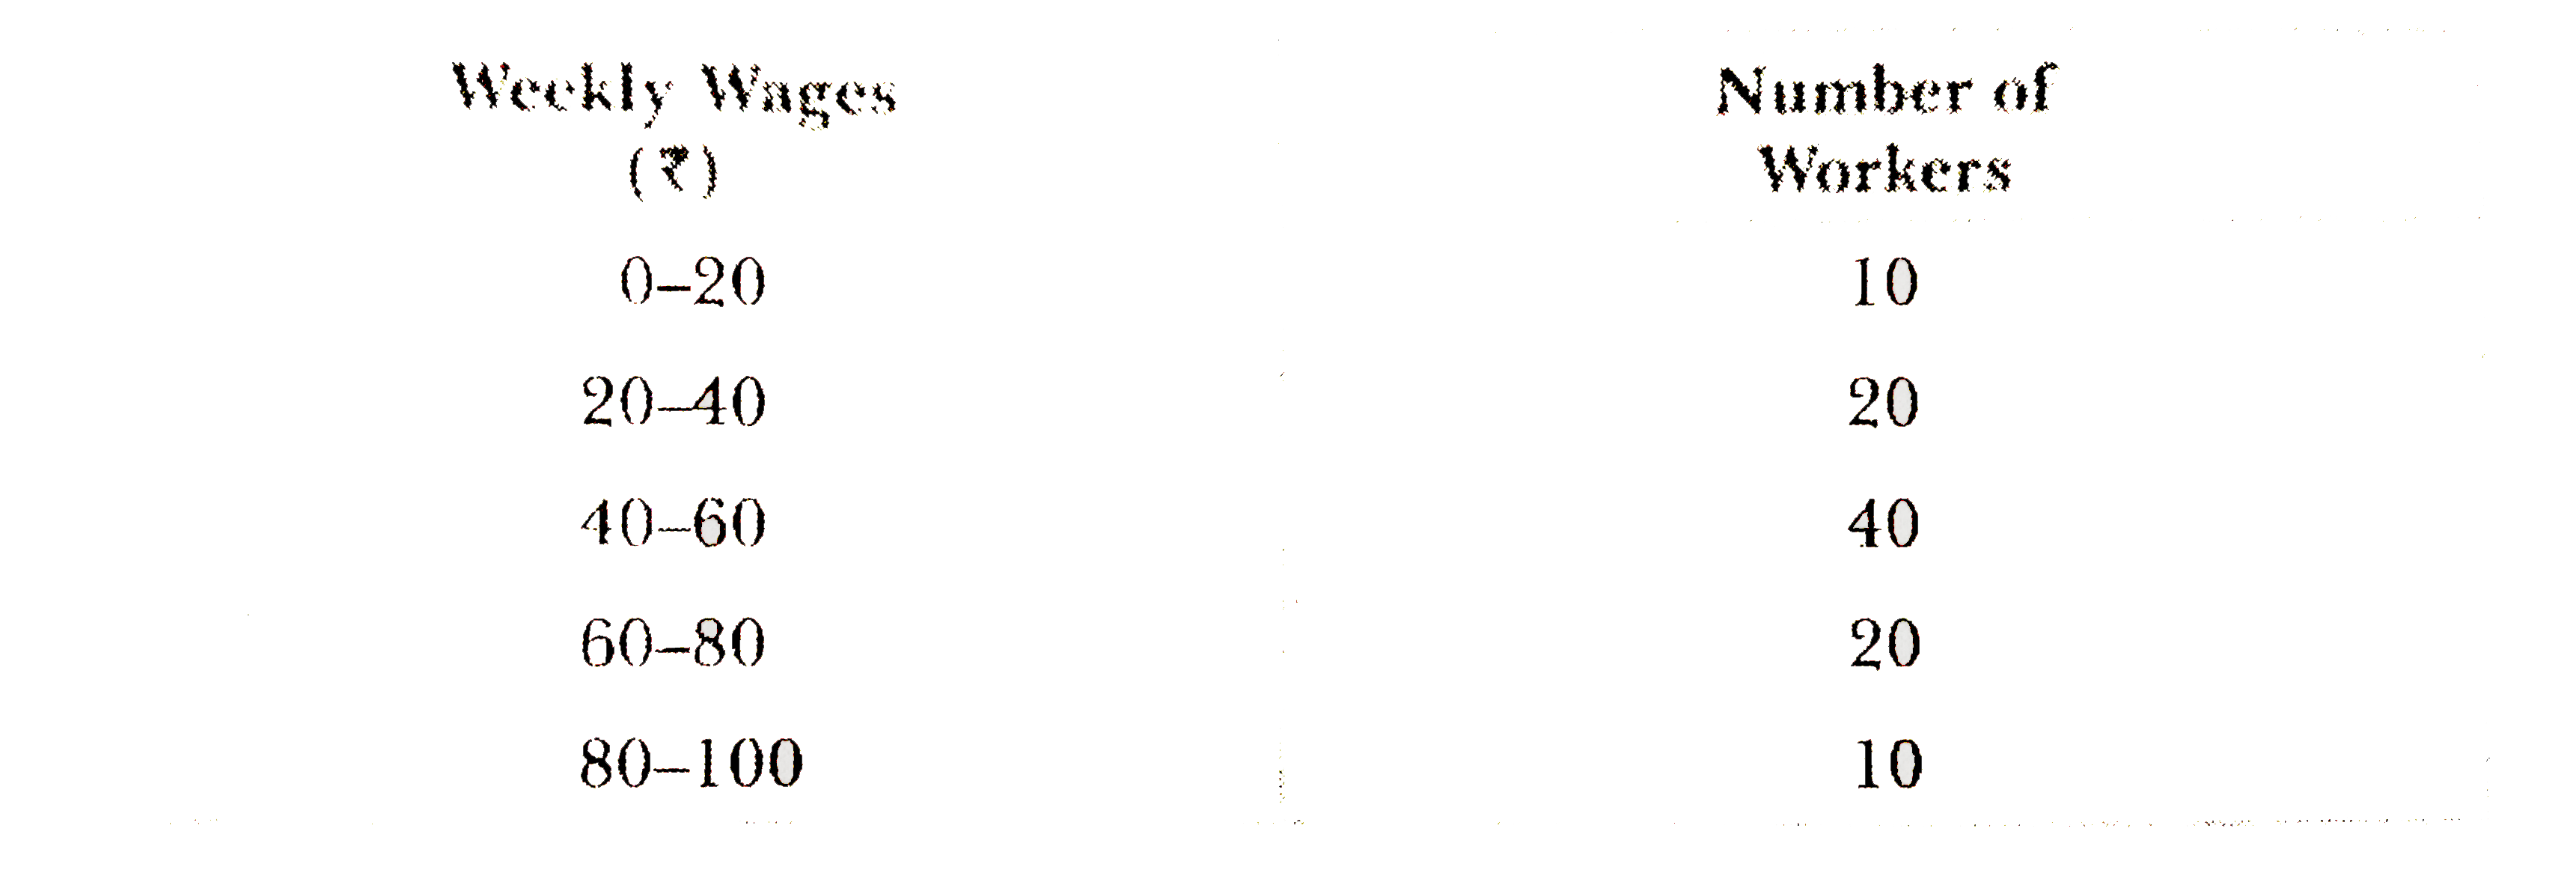
View SolutionDraw the 'less than' and 'more than' ogive on the same graph paper from the data given below :
View Solution

