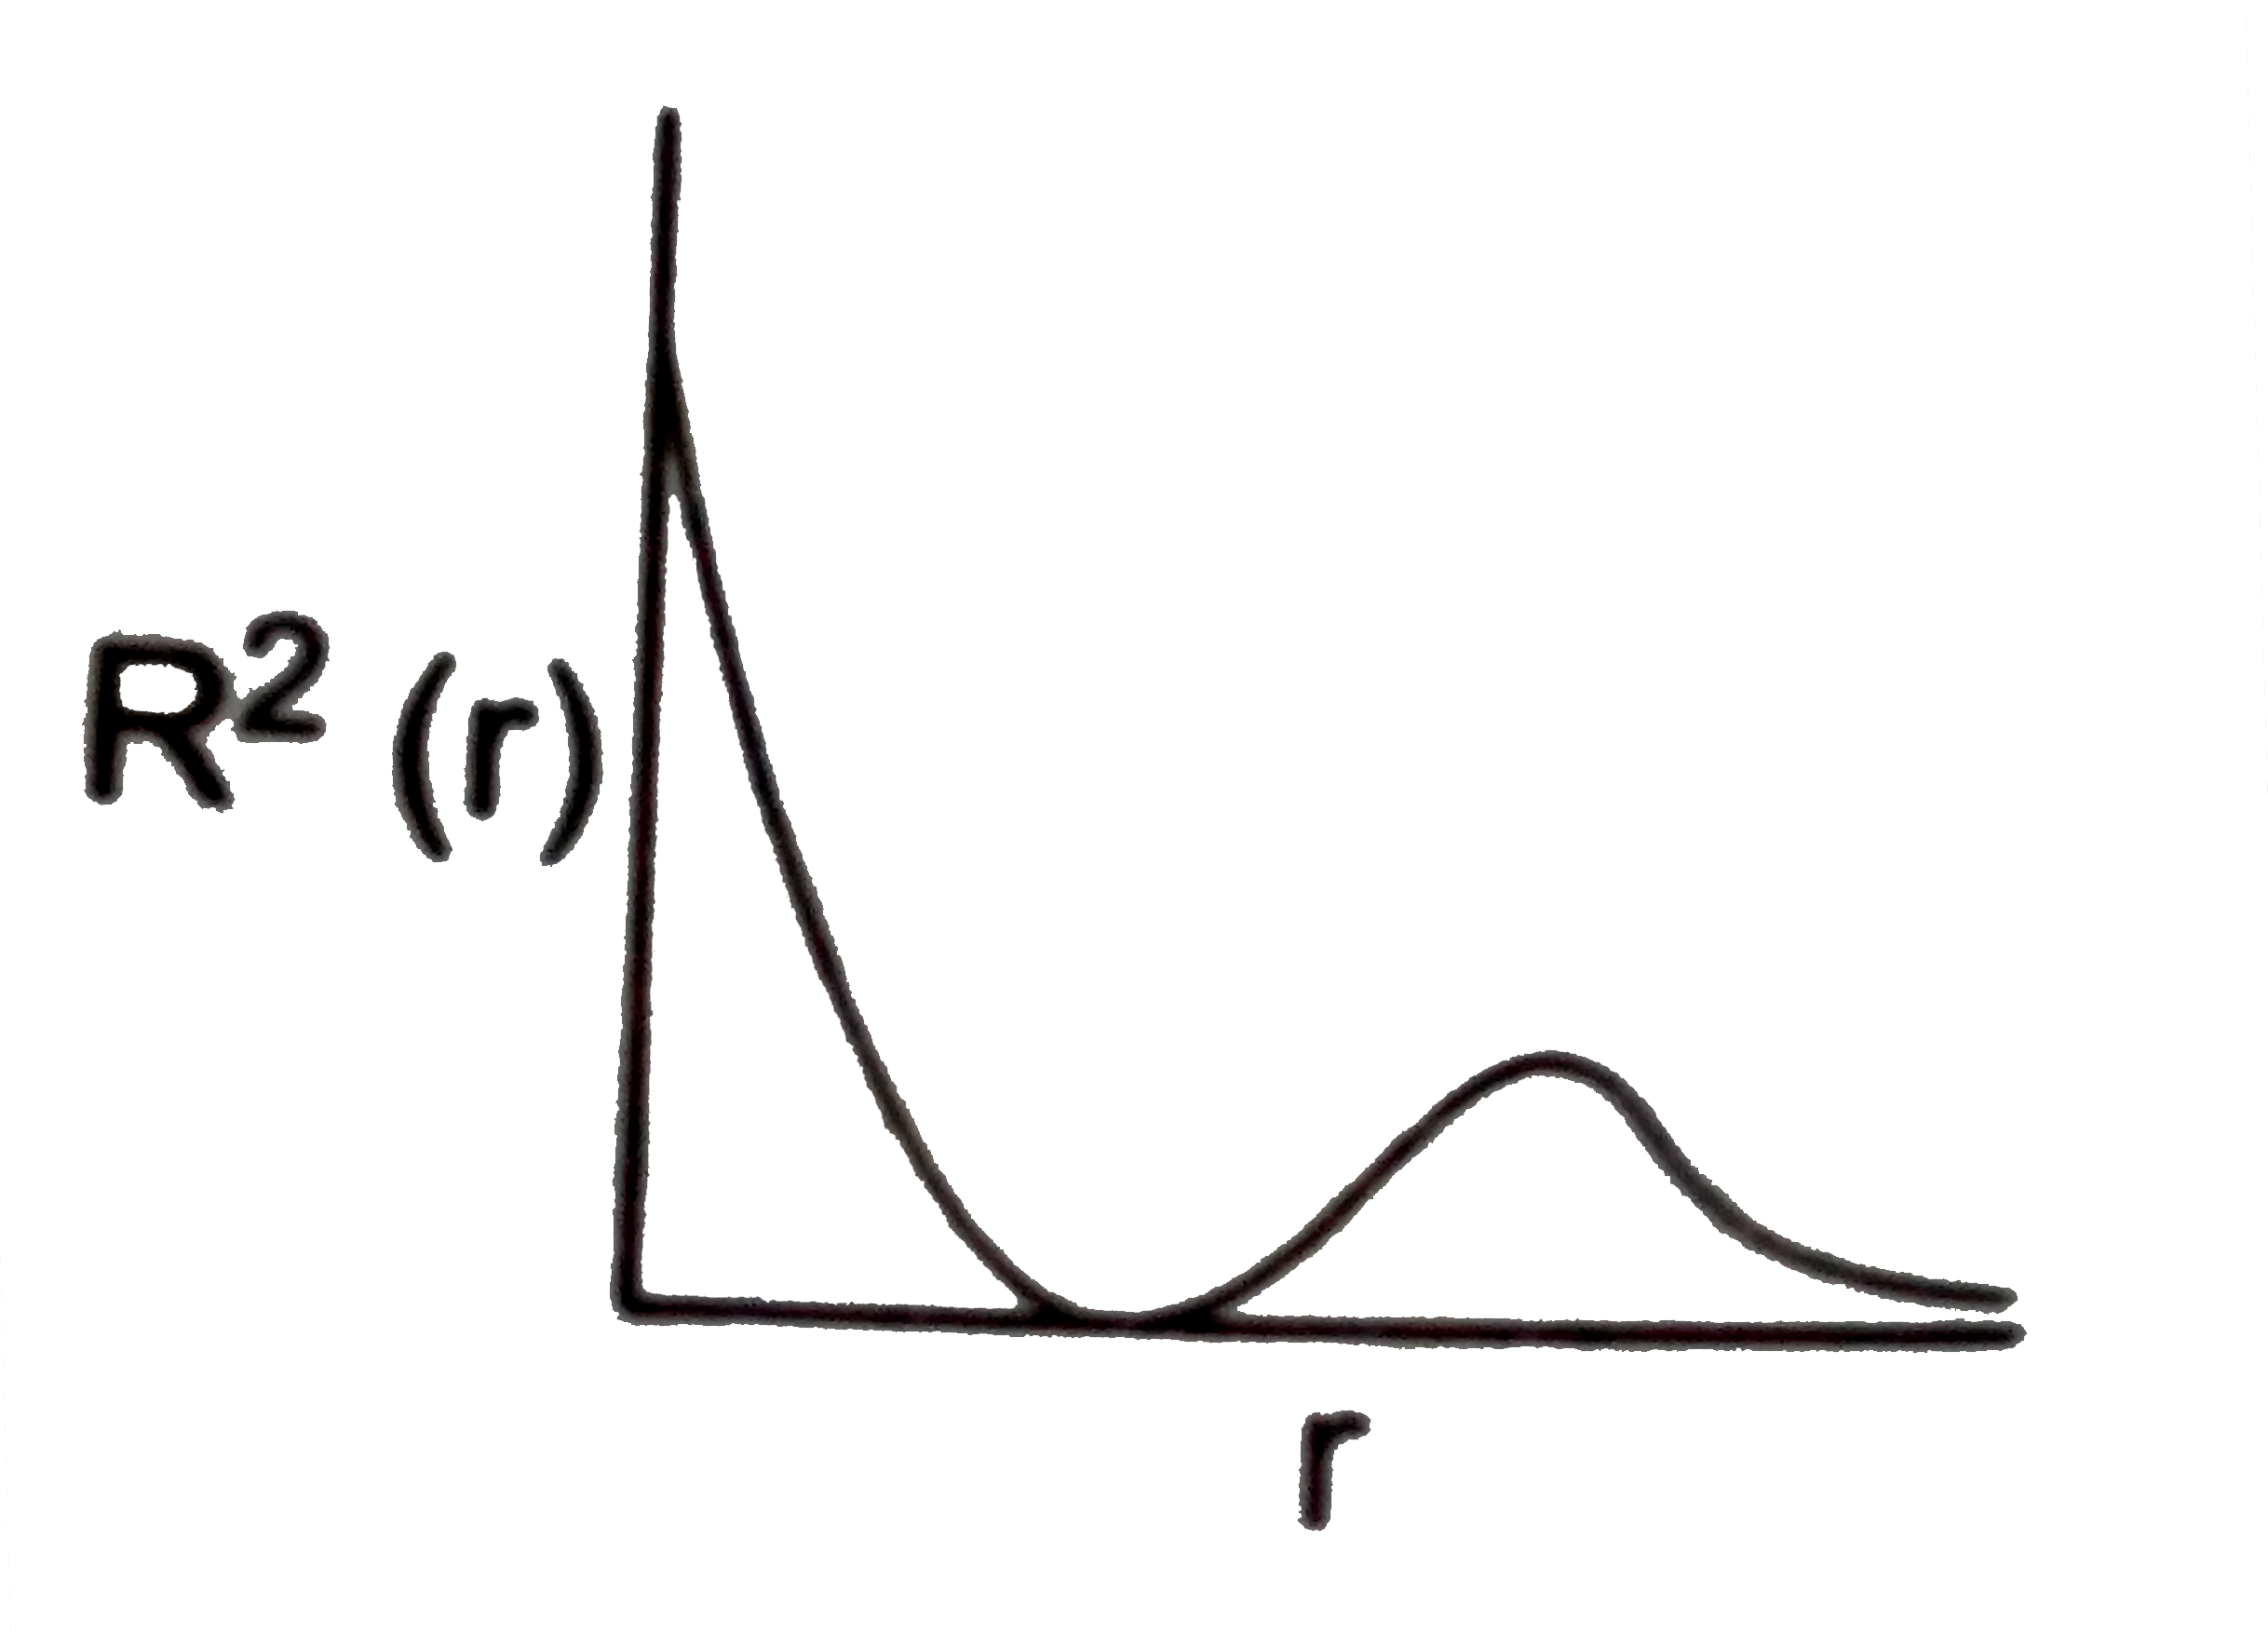
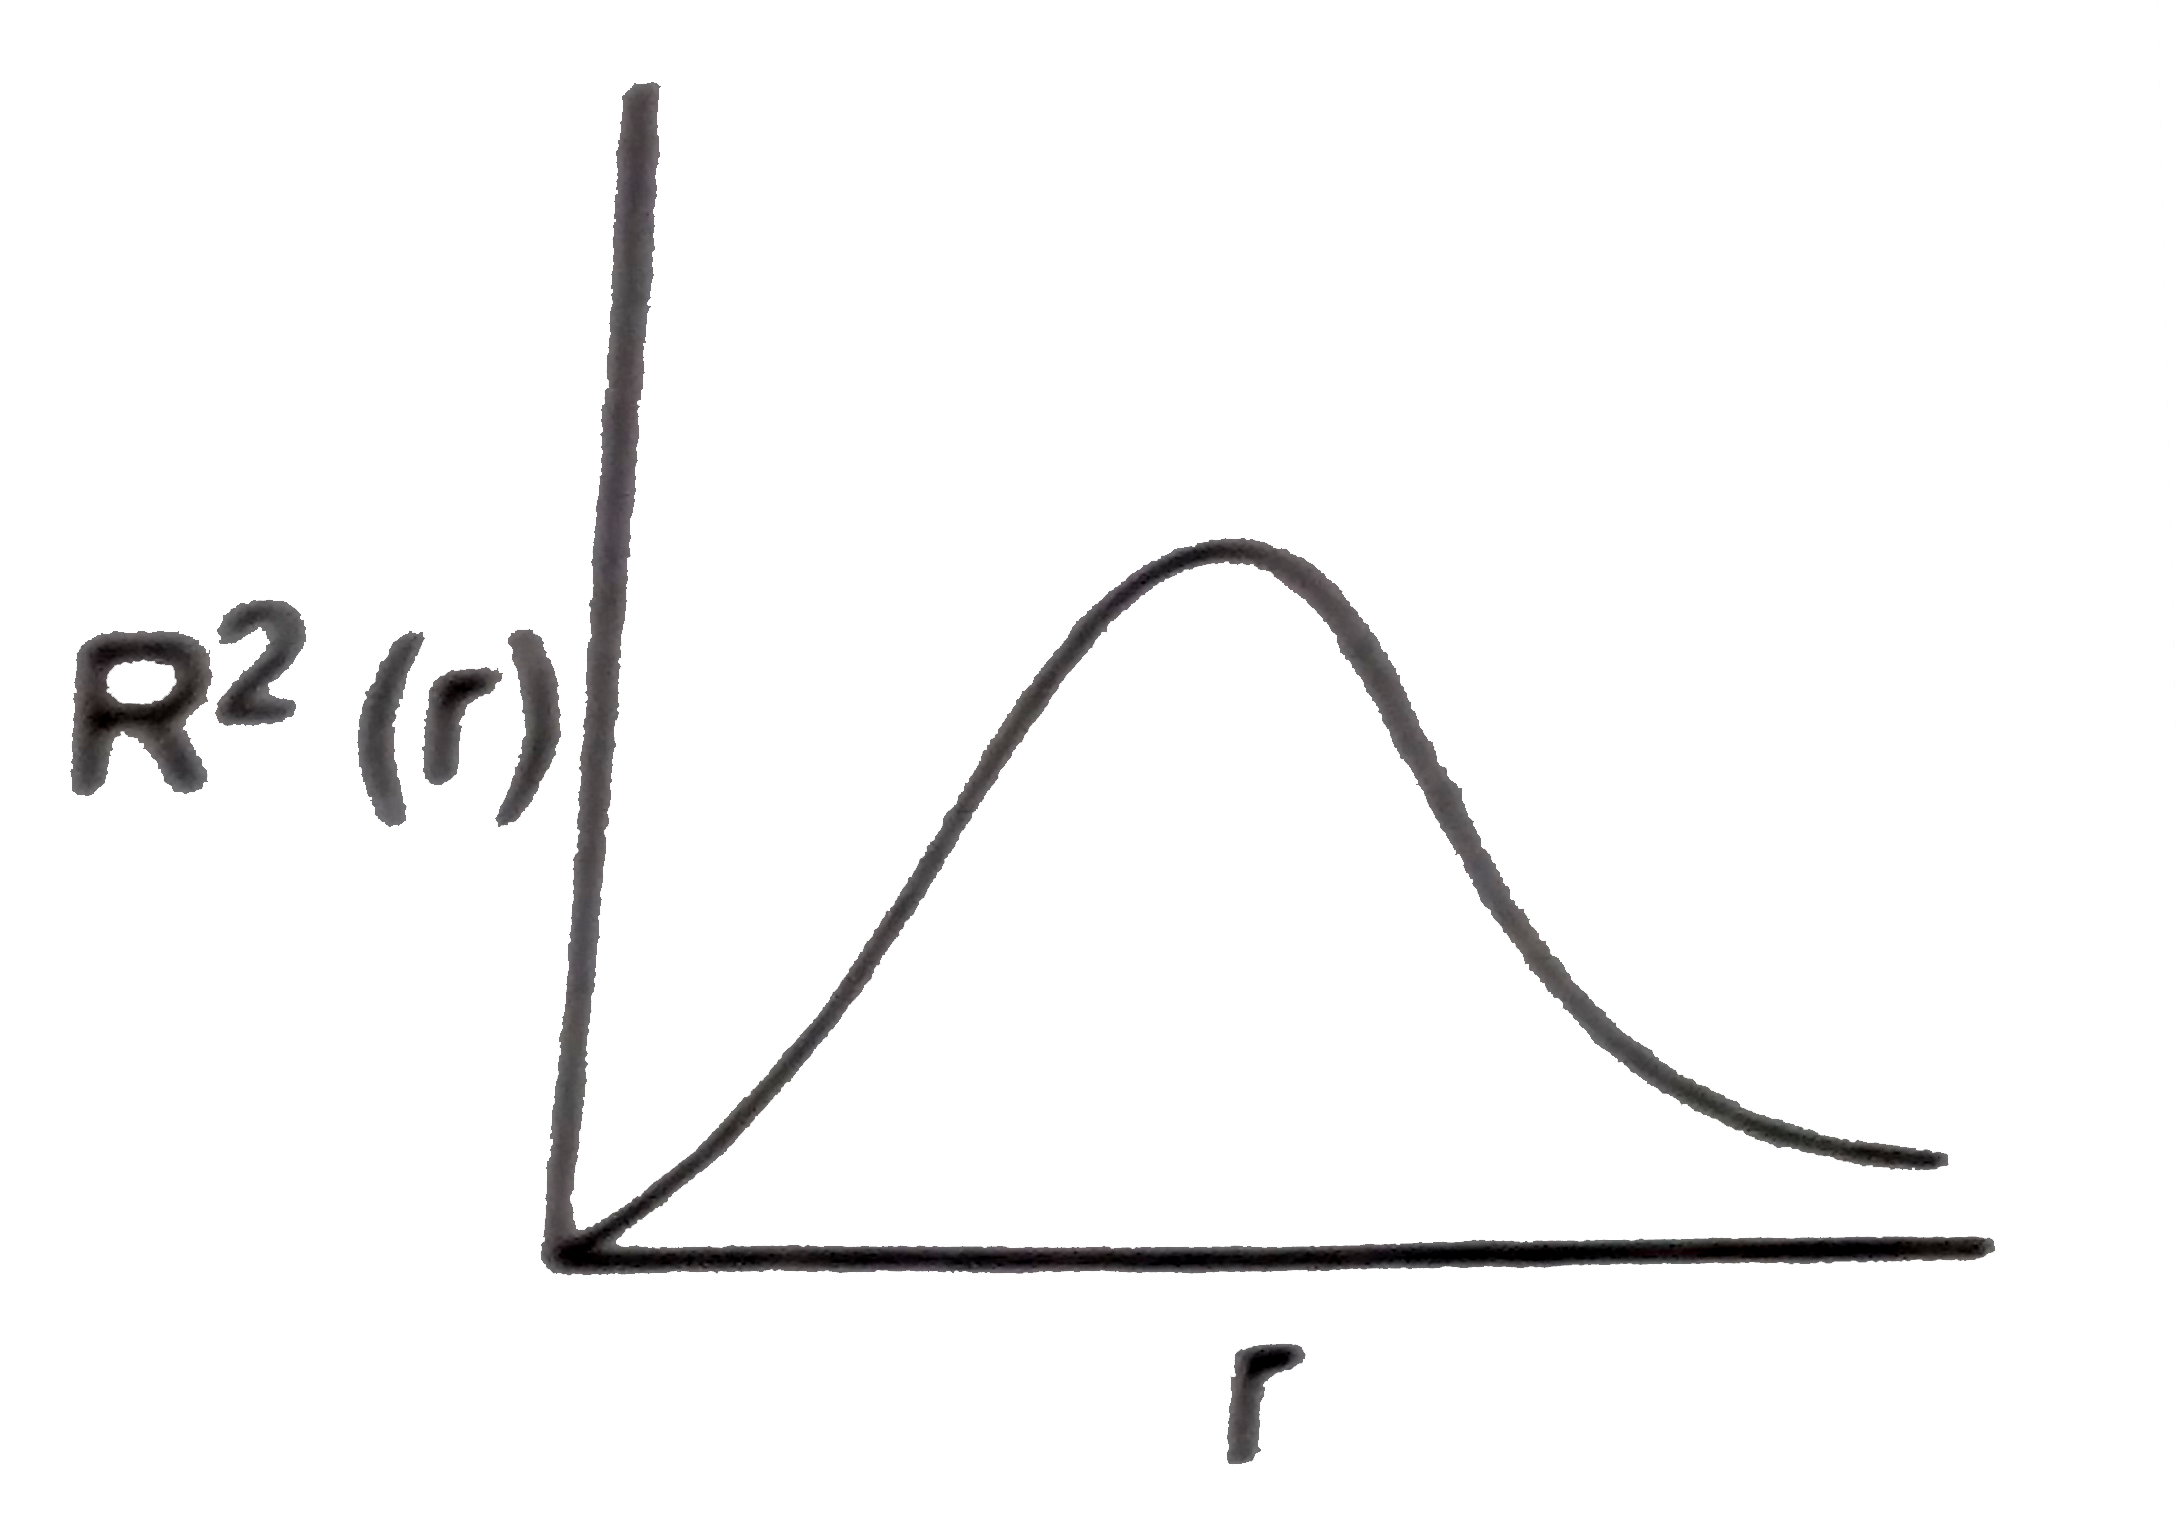
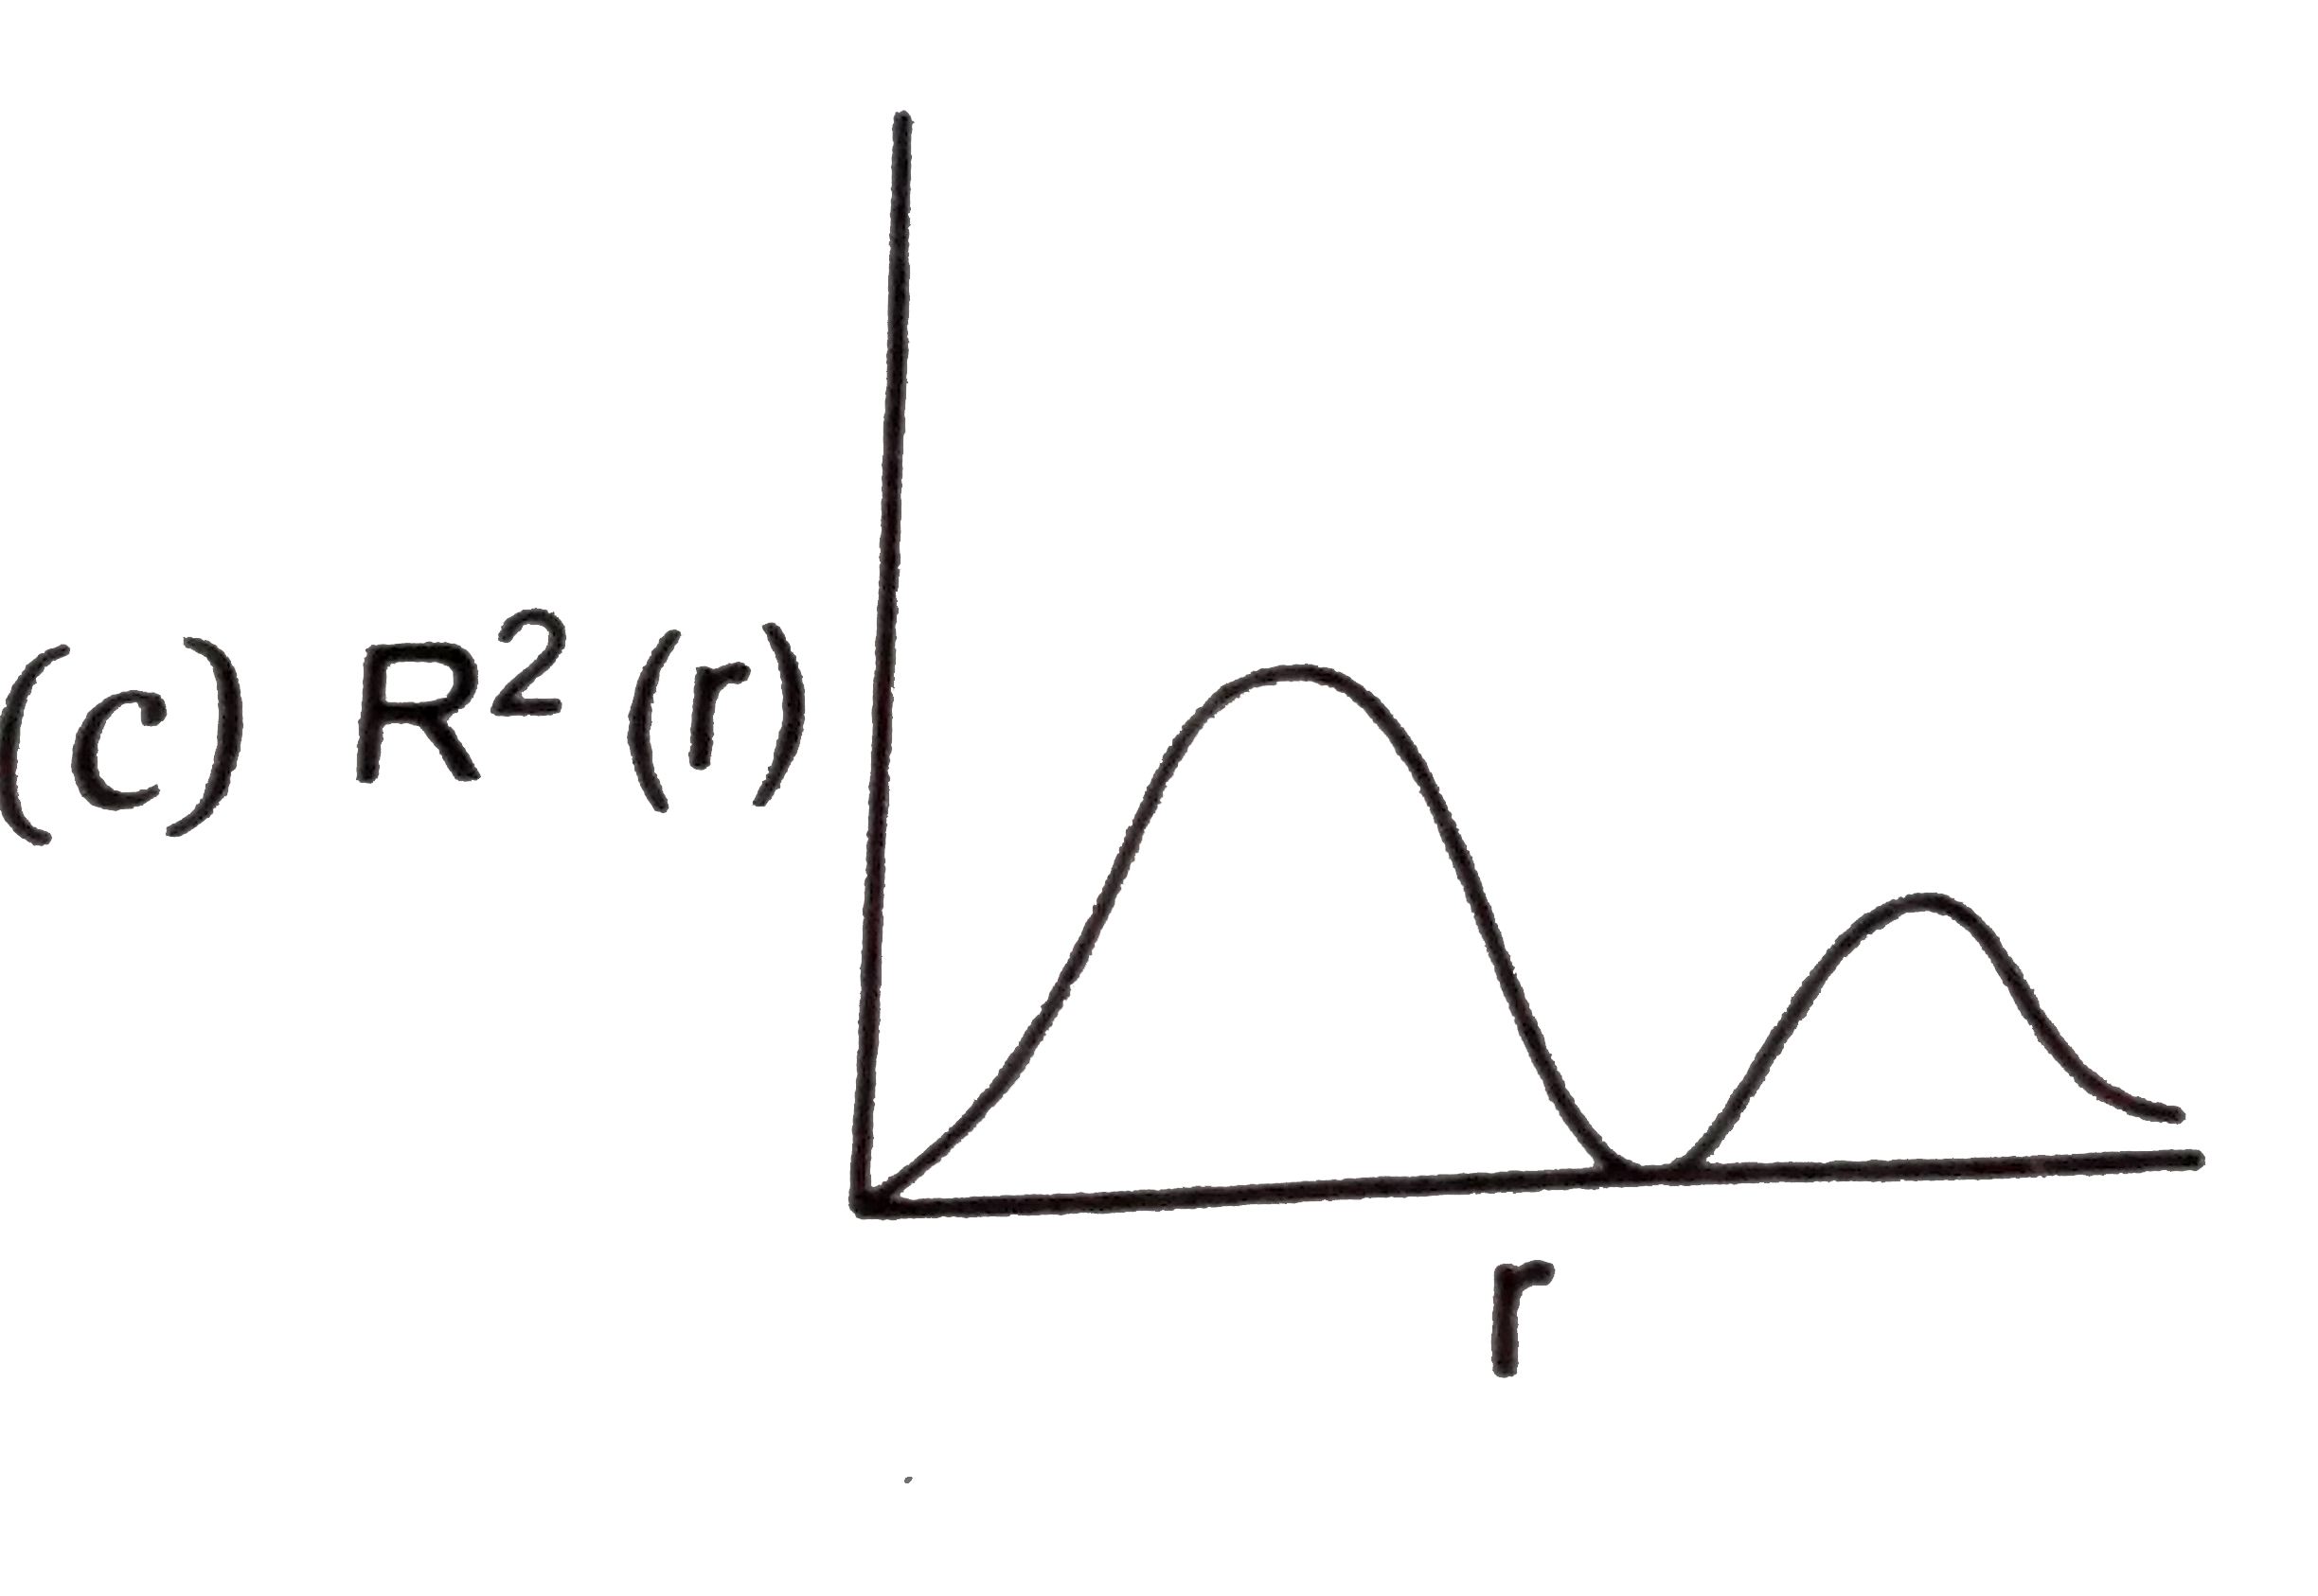
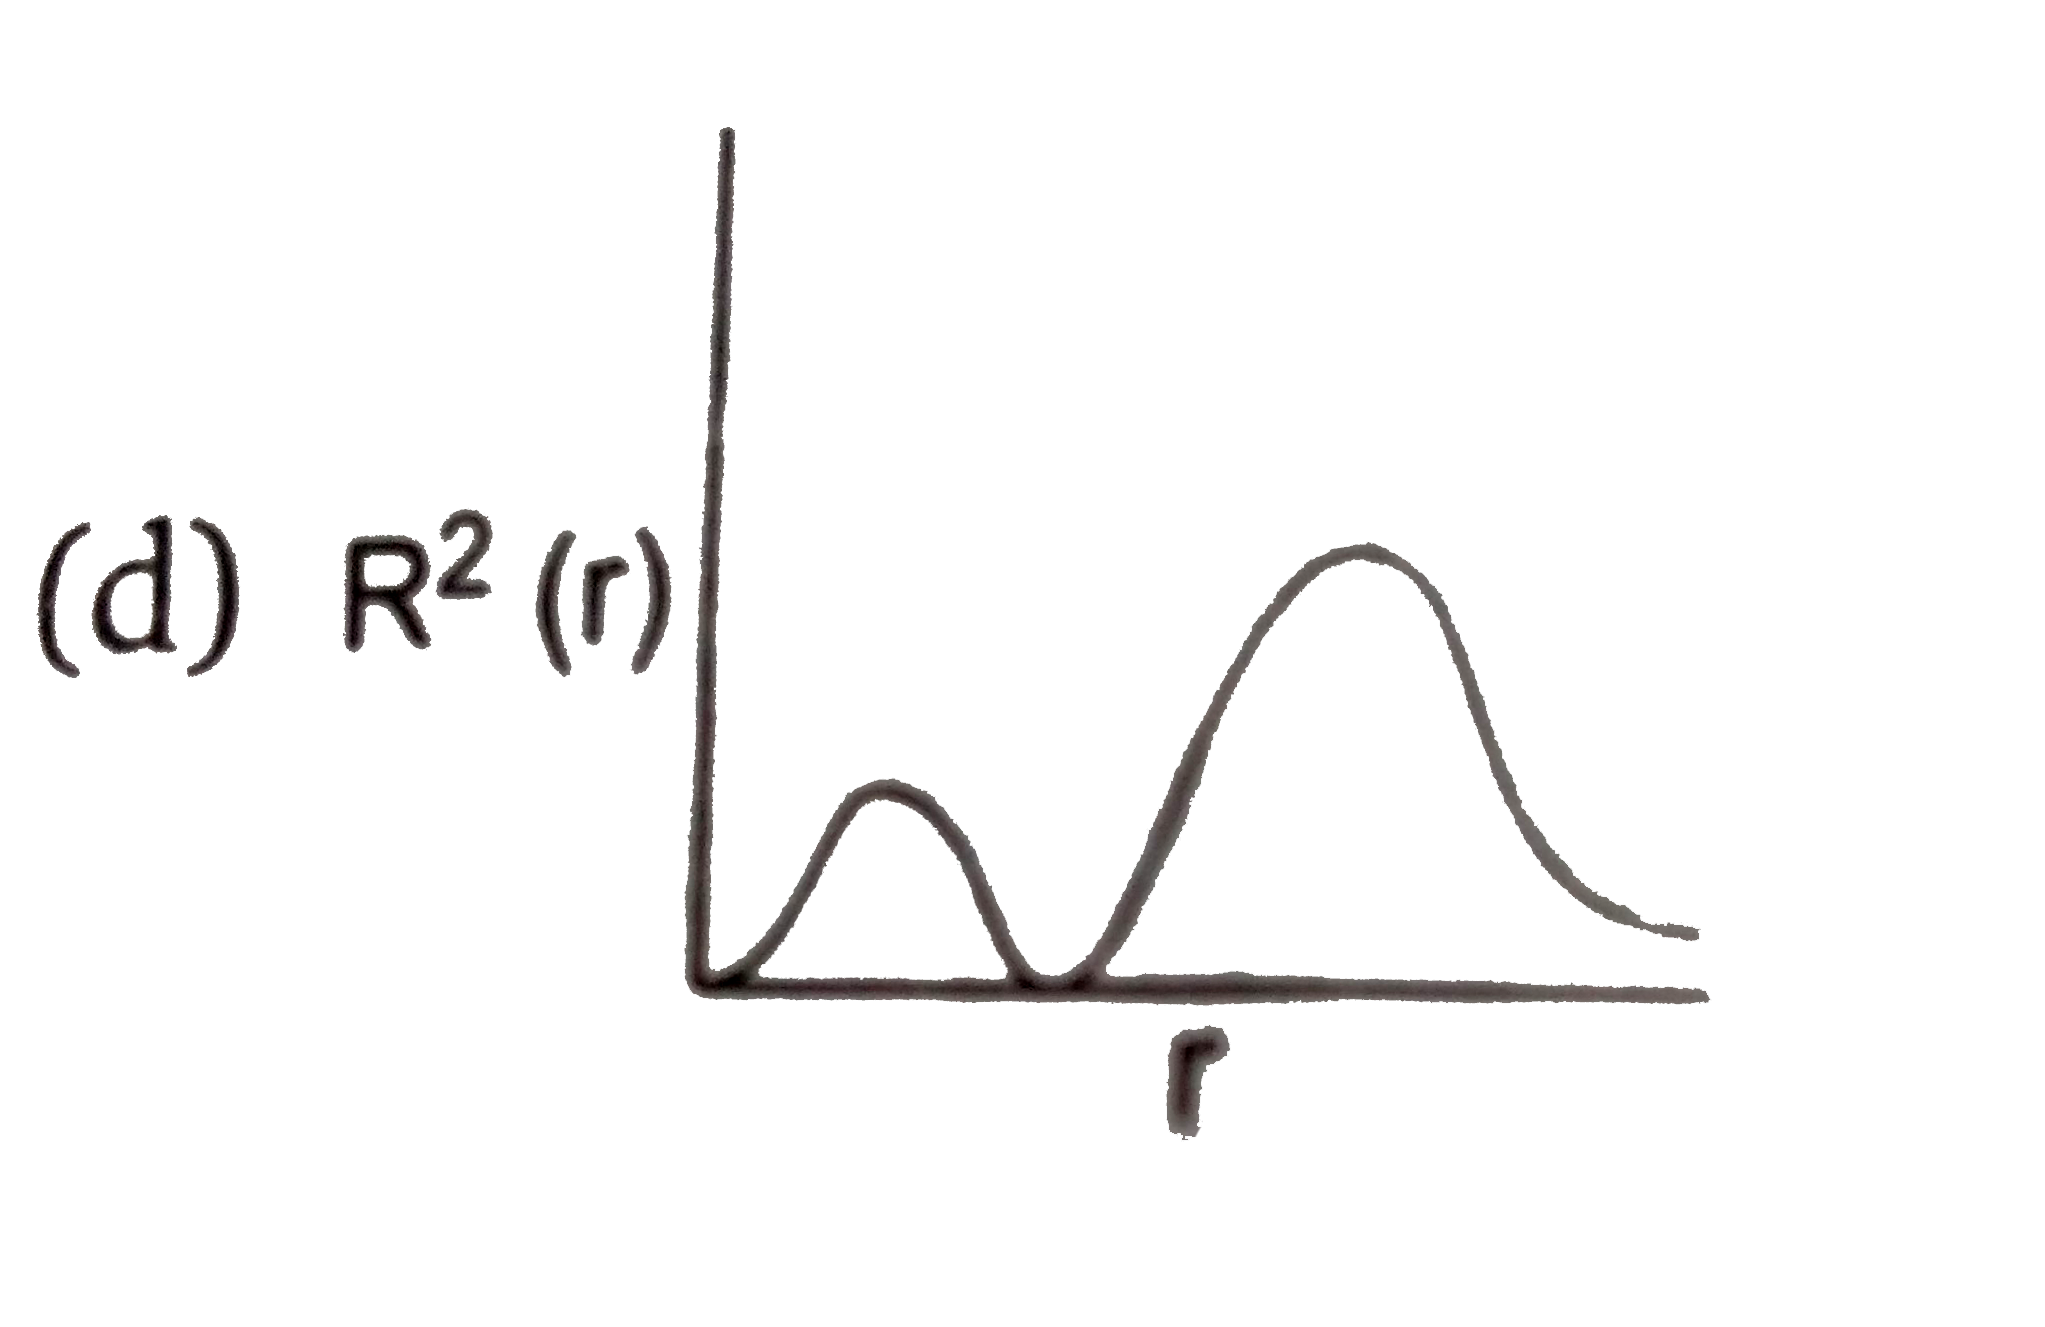
Draw the radial prodabilirty distritation corve for 2p ans 2s elelctron orbitals and compare them
To draw the radial probability distribution curves for the 2s and 2p electron orbitals and compare them, we will follow these steps:
Step 1: Understand the Concept of Radial Probability Distribution
The radial probability distribution describes the likelihood of finding an electron at a certain distance from the nucleus in an atom. It is calculated by considering the volume of a spherical shell at a distance r from the nucleus.
Step 2: Draw the Radial Probability Distribution for 2s Orbital
1. Shape of the Curve: The radial probability distribution curve for the 2s orbital has a characteristic shape with two peaks (maxima) and a node (a point where the probability is zero).
2. Label the Axes: The x-axis represents the distance from the nucleus (r), and the y-axis represents the radial probability density.
3. Draw the Curve: Start at the origin (0,0), rise to the first maximum, drop to zero at the node (where r is at a certain distance), then rise again to the second maximum.
Step 3: Draw the Radial Probability Distribution for 2p Orbital
1. Shape of the Curve: The radial probability distribution curve for the 2p orbital has one peak (maximum) and does not have a node.
2. Label the Axes: Similar to the 2s orbital, the x-axis is the distance from the nucleus (r), and the y-axis is the radial probability density.
3. Draw the Curve: Start at the origin (0,0), rise to the maximum, and then gradually decrease as you move away from the nucleus.
Step 4: Compare the Two Curves
1. Number of Maxima: The 2s orbital has two maxima, while the 2p orbital has only one maximum.
2. Node Presence: The 2s orbital has a node (point of zero probability), while the 2p orbital does not have any nodes.
3. Probability Distribution: The 2s orbital shows a more complex distribution with regions of high and low probability, whereas the 2p orbital has a more uniform distribution around its maximum.
Step 5: Conclusion
The radial probability distribution curves for the 2s and 2p orbitals illustrate the differences in electron distribution around the nucleus. The 2s orbital has two peaks and a node, indicating regions of high and zero probability, while the 2p orbital has one peak with no nodes, indicating a more consistent probability of finding the electron.
---
The radial probability distribution describes the likelihood of finding an electron at a certain distance from the nucleus in an atom. It is calculated by considering the volume of a spherical shell at a distance r from the nucleus.
1. Shape of the Curve: The radial probability distribution curve for the 2s orbital has a characteristic shape with two peaks (maxima) and a node (a point where the probability is zero).
2. Label the Axes: The x-axis represents the distance from the nucleus (r), and the y-axis represents the radial probability density.
3. Draw the Curve: Start at the origin (0,0), rise to the first maximum, drop to zero at the node (where r is at a certain distance), then rise again to the second maximum.
1. Shape of the Curve: The radial probability distribution curve for the 2p orbital has one peak (maximum) and does not have a node.
2. Label the Axes: Similar to the 2s orbital, the x-axis is the distance from the nucleus (r), and the y-axis is the radial probability density.
3. Draw the Curve: Start at the origin (0,0), rise to the maximum, and then gradually decrease as you move away from the nucleus.
1. Number of Maxima: The 2s orbital has two maxima, while the 2p orbital has only one maximum.
2. Node Presence: The 2s orbital has a node (point of zero probability), while the 2p orbital does not have any nodes.
3. Probability Distribution: The 2s orbital shows a more complex distribution with regions of high and low probability, whereas the 2p orbital has a more uniform distribution around its maximum.
The radial probability distribution curves for the 2s and 2p orbitals illustrate the differences in electron distribution around the nucleus. The 2s orbital has two peaks and a node, indicating regions of high and zero probability, while the 2p orbital has one peak with no nodes, indicating a more consistent probability of finding the electron.
Topper's Solved these Questions
- ATOMIC STRUCTUREBOOK - CENGAGE CHEMISTRY ENGLISHCHAPTER - ATOMIC STRUCTUREEXERCISE - Exercises (Subjective)
52 Videos
- ATOMIC STRUCTUREBOOK - CENGAGE CHEMISTRY ENGLISHCHAPTER - ATOMIC STRUCTUREEXERCISE - Exercises Linked Comprehension
50 Videos
- APPENDIX - INORGANIC VOLUME 1BOOK - CENGAGE CHEMISTRY ENGLISHCHAPTER - APPENDIX - INORGANIC VOLUME 1EXERCISE - chapter-7 Single correct answer
1 Videos
- CHEMICAL BONDING AND MOLECULAR STRUCTUREBOOK - CENGAGE CHEMISTRY ENGLISHCHAPTER - CHEMICAL BONDING AND MOLECULAR STRUCTUREEXERCISE - Archives Subjective
15 Videos
Similar Questions
Knowledge Check
The orbital angular momentum of an electron in 2s-orbital is
AZeroBOneCTwoDThree
The energy of an electron of 2p1 orbital is
View SolutionThe radial distribution curve of 2s sub-level consists of x nodes. Value of x is :
View SolutionThe orbital angular momentum of an electron in 2s orbital is ………
View SolutionThe orbital angular momentum of an electron in 2s-orbital is
View SolutionSelect the correct plot of radial probability function (4πr2R2) for 2s - orbital.
View SolutionWhat are the values of the orbital angular momentum of an electron in the orbitals 1s,3s,3d and 2p:-
View SolutionFirst Ionisation energy of Be is higher than that of Boron.
Select the correct statements regarding this
(i) It is easier to extract electron from 2p orbital than 2s orbital
(ii) Penetration power of 2s orbital is greater than 2p orbital
(iii) Shielding of 2p electron by 2s electron
(iv) Radius of Boron atom is larger than that of Be
View Solution


