Explain Liquifaction of CO2 gas by Thomas Andrews plot graph and different effect of temperature and pressure and critical constant. Solution in Gujrati
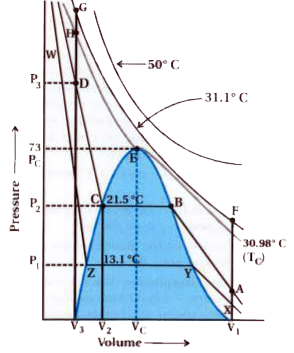
First complete data on pressure - volume - temperature relations of a substance in both gaseous and liquid state was obtained by Thomas Andrews on carbon dioxide.

From graph derivations of Andrews :
(i) At high temperature isotherms look like that of an ideal gas and the gas cannot be liquified even at very high pressure.
(ii) As the temperature is lowered, shape of the curve changes and data shows considerable deviation from ideal behaviour.
(iii) Explanation of TC, (E point) PC and VC : At 30.98∘C carbon dioxide remains gas upto 73 atmospheric pressure. (Point E in Figure). At 73 atmospheric pressure, liquid carbon dioxide appears for the first time.
Critical temperature (TC):30.98∘C temperature is known as critical temperasture of CO3 gas. While firct pressure of CO2 gas becomes liquid at 73 atoms.
Higher than 30.98∘CCO2 gas is in gaseous from (TC).
At critical temperature volume of 1 mole gas is known as critical volume (VC) and pressure is known as critical pressure (PC).
Critical pressure : The critical temperature (TC), critical pressure (PC) and critical volume (VC) are called critical constants.
30.98∘C further increase in pressure simply compresses the liquid carbon dioxide and the curve represents the compressibility of the liquid. The steep line represents the isotherm of liquid. Even a slight compression results in steep rise in pressure indicating very low compressibility of the liquid.
Below 30.98∘C(TC) or (21.5∘C point B) and BC :
Below 30.98∘C the behasviour of the gas on compression is quite different.
At 21.5∘C, carbon dioxide remains as a gas only upto point B.
Further compression does not chage the pressure. - Liquid and gaseous carbon dioxide coexist and further application of pressure results in the condensation of more gas until the point C is reached.
At point C, all the gas has been condensed and further application of pressure merely compresses the liquid as shown by steep line.
A slight compression from volume V2 to V3 results in steep rise in pressure from P2 to P3.
Below 30.98∘C (criticasl temperature) each curve shows the similar trend and only length of the horizontal line increases at lower temperatures. (At E point, after BC line length is increases.)
At critical point horizontal portion of the isotherm merges into one point. In figure : (i) Point A : Represents gaseous state (ii) Point D : Represent liquid state. (iii) Dome shaped area represents existence of liquid and gaseous carbon dioxide in equilibrium.
Topper's Solved these Questions
- STATES OF MATTER BOOK - KUMAR PRAKASHANCHAPTER - STATES OF MATTER EXERCISE - SECTION - A QUESTIONS (Sub Question)
3 Videos
- STATES OF MATTER BOOK - KUMAR PRAKASHANCHAPTER - STATES OF MATTER EXERCISE - SECTION - A QUESTIONS (TRY YOUR SELF)
47 Videos
- SOME BASIC CONCEPTS OF CHEMISTRYBOOK - KUMAR PRAKASHANCHAPTER - SOME BASIC CONCEPTS OF CHEMISTRYEXERCISE - Section - D (Solutions of NCERT Exemplar Problems) (Long Answer Type Questions)
4 Videos
- STRUCTURE OF ATOMBOOK - KUMAR PRAKASHANCHAPTER - STRUCTURE OF ATOMEXERCISE - QUESTINS PAPER FROM MODULE (SECTION -D)
2 Videos
Similar Questions
Derive Boyle.s formula according to his law.
View SolutionAt 300 K constant temperature gas having 20cm3, 1 bar pressure it is convert into 50cm3 then calculated pressure ?
View SolutionA vessel contains 1.6 g of dioxygen at STP (273.15 K, 1 atm pressure). The gas is now transferred to another vessel at constant temperature, where pressure becomes half of the original pressure. Calculate
(A) volume of the new vessel.
(B) number of molecules of dioxygen.
View SolutionExplain Heisenberg’s uncertainty principle.
View SolutionThe critical temperature and pressure of CO2 gas are 304.2K and 72.9atm respectively Calculate the radius of CO2 molecule assuming it to behave van der Waals gas .
View SolutionThe essential conditions for liquefaction of gases were discovered by Andrews in 1869 as a result of his study of pressure-volume-temperature relationship for CO2. If was found that above a certain temperature, it was impossible to liquefy a gas whatever the pressure was applied. The temperature below which the gas can be liquefied by the application of pressure alone is called critical temperature (Tc). The pressure required to liquefy a gas at this temperature is called the critical pressure (Pc). The volume occupied by one mole of the substance at the critical temperature and pressure is called critcal volume. Critical constants are related with van der Waals' constant as follows:
Vc=3b,Pc=a27b2,Tc=8a27Rb
The pressure required to liquefy a gas at the critical temperature is called :
View SolutionWhat is the nature of graph of PV versus P for a given mass of a gas at constant temperature?
View SolutionPlot density vs pressure for a fixed mass of an ideal gas at a constant temperature.
View SolutionDefine critical temperature and critical pressure of a gas.
View SolutionAssertion : Critical temperature of CO_(2) is 304K, it can be liquefied above 304K. Reason : For a given mass of gas, volume is to directly proportional to pressure at constant temperature
View SolutionThomas Andrew measured variation of the volume with pressure of ____________ at different constant temperatures.
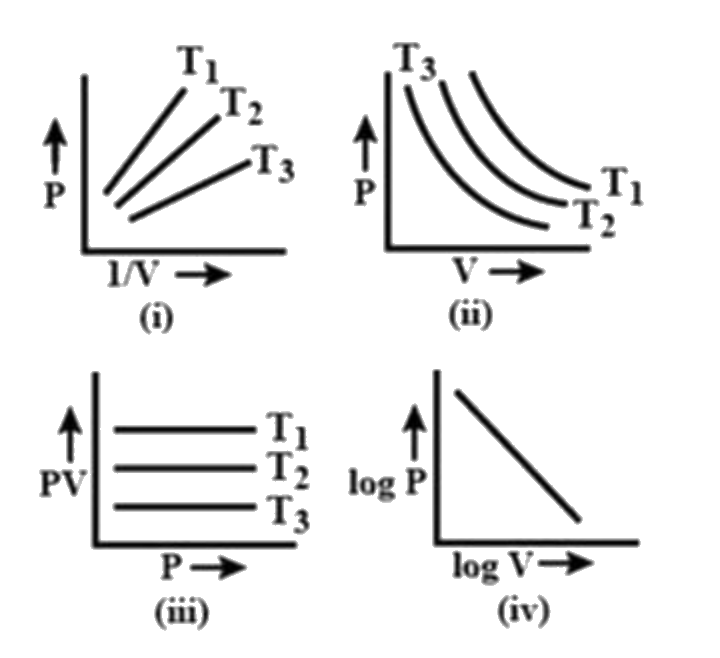
View SolutionGraph between pressure and volume are plotted at different temperature. Which of the following isotherms represent Boyle's law as PV = constant?

View SolutionA graph is plotted between pressure and volume at different temperature. On the basis of the graph what changes will you observe in the volume if (i) the pressure is increased at constant temperature (ii) the temperature is decreased at constant pressure
View SolutionExplain Liquifaction of CO_(2) gas by Thomas Andrews plot graph and different effect of temperature and pressure and critical constant.
View SolutionWhat is critical temperature ? What is value of critical temperature for CO_(2) gas ?
View Solution
