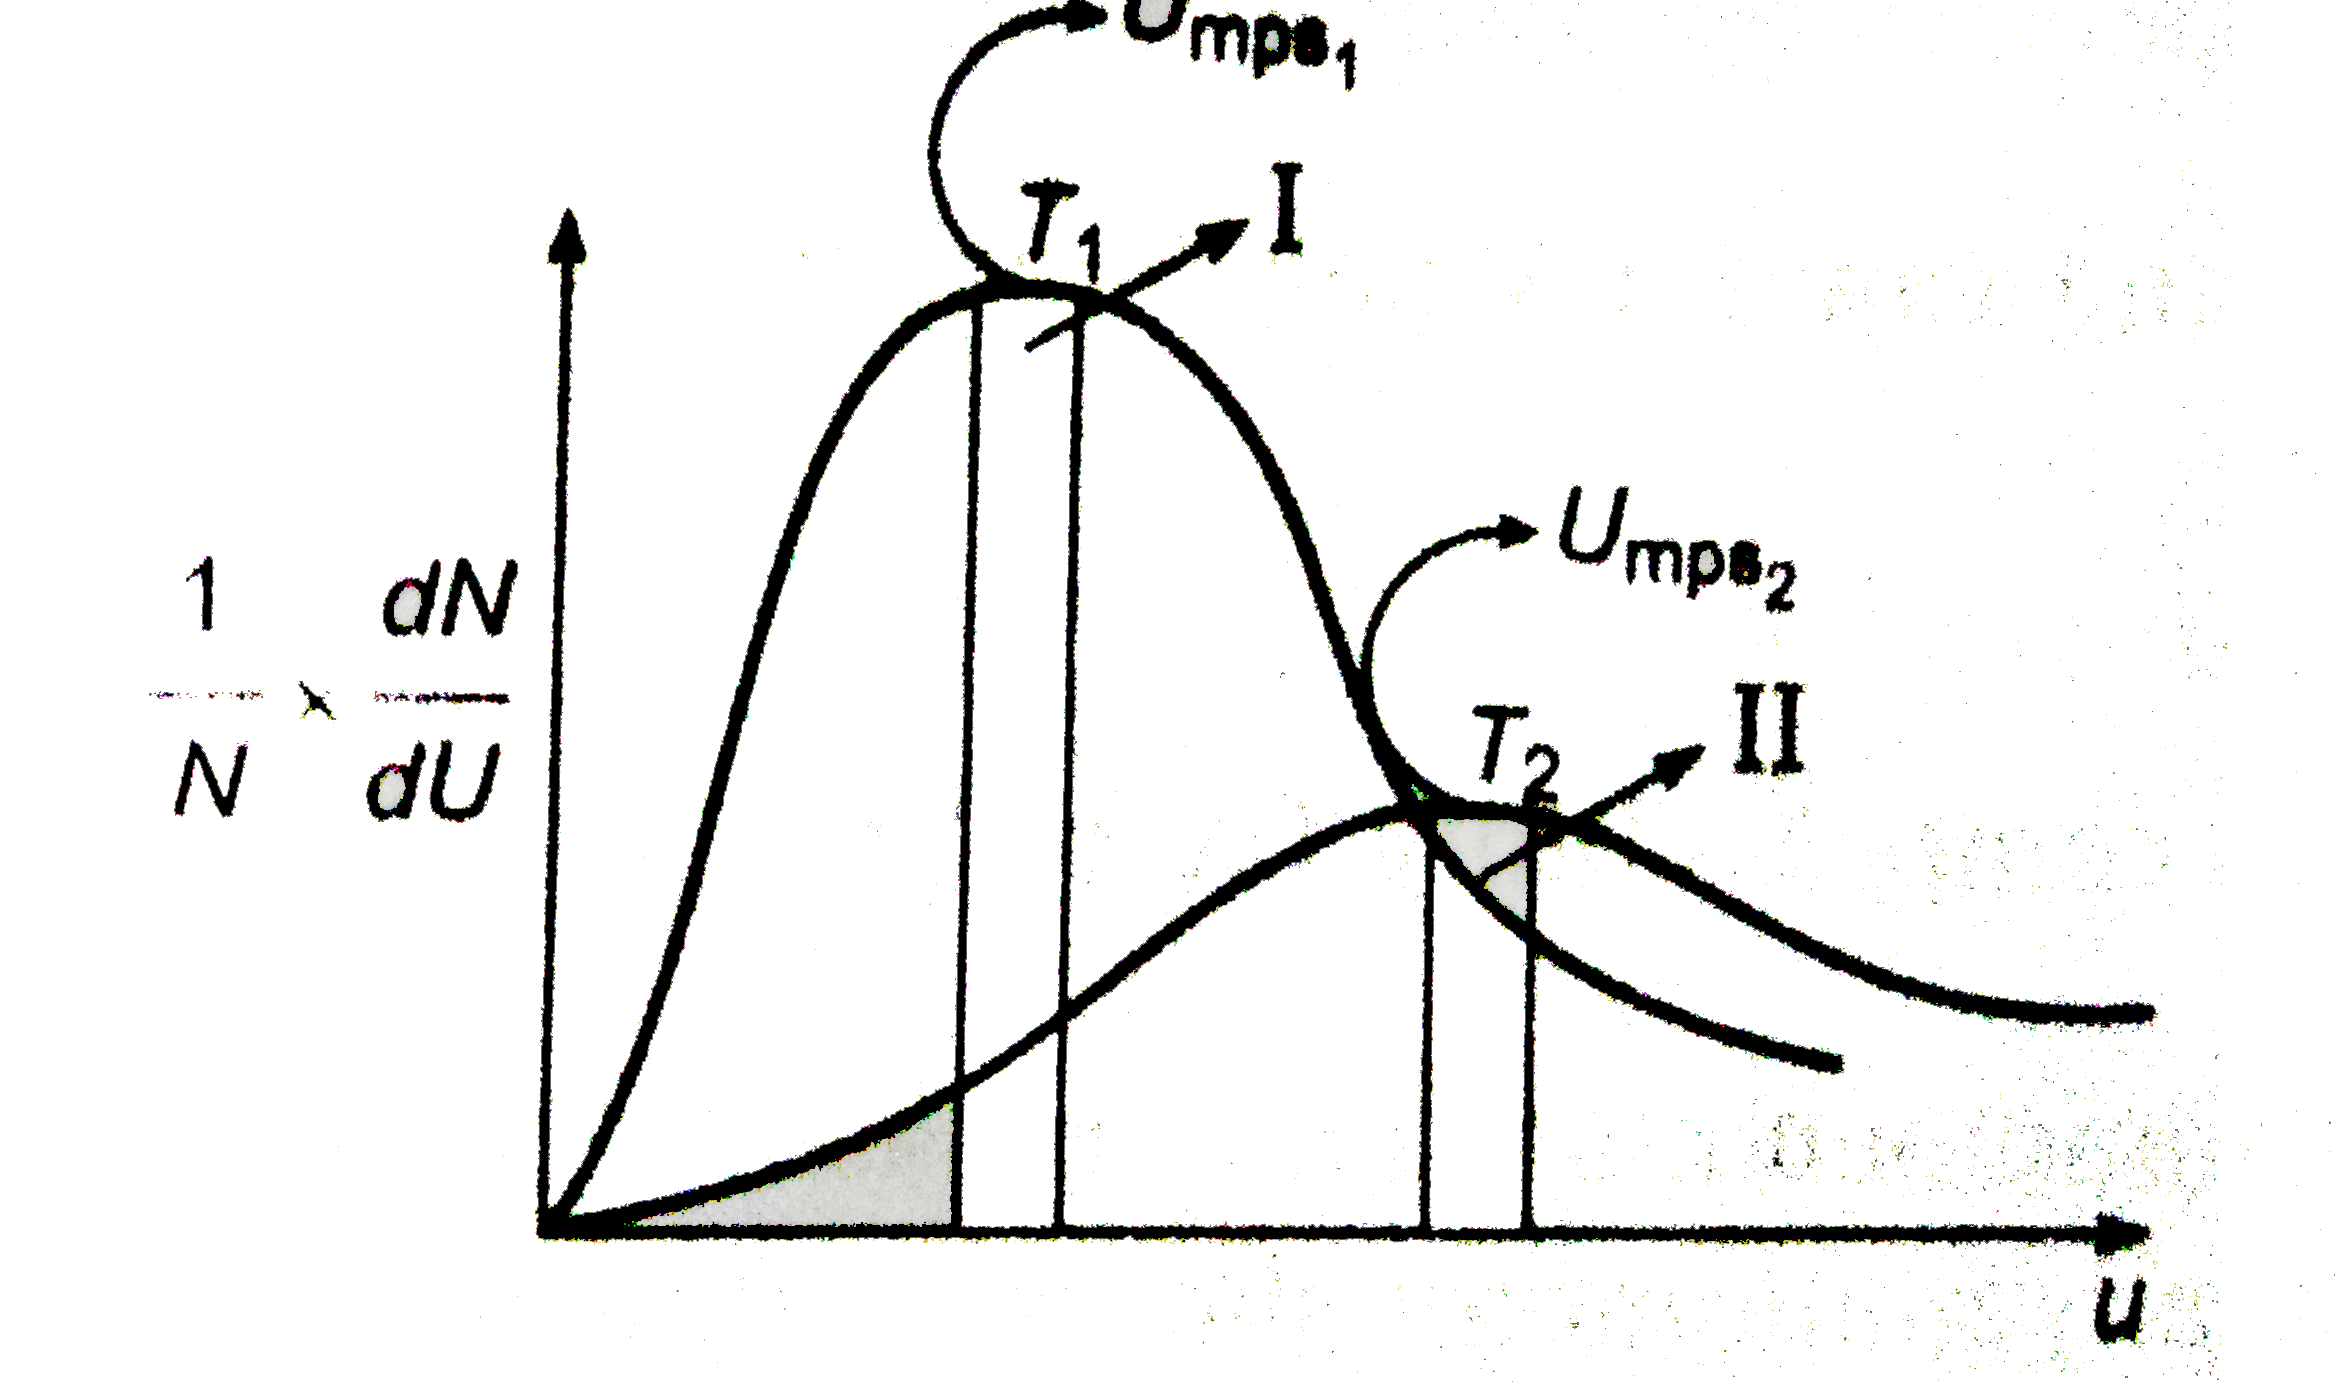
Following represents the Maxwell distribution curve for an ideal gas at two temperature T1 and T2 . Which of the following option(s) is/are true?
 Solution in Telugu
Total area under the two curves is independent to moles of gas
ump decrease as temperature decreases
T1>T2 and hence higher the temperature, sharper the curve
The fraction of molecules having speed ump decreases as temperature increases
The correct Answer is:a,b,d
(a,b,d) (A) ∵ area under the curve gives fraction of molecules and total area is constant.
(B) ump decreases with decrease in temperature.
(C) T2 is higher temperature
(D) As seen from graph, ∴ A,B,D
Topper's Solved these Questions
- GASEOUS STATEBOOK - NARENDRA AWASTHICHAPTER - GASEOUS STATEEXERCISE - Level 1 (Q.31 To Q.60)
1 Videos
- GASEOUS STATEBOOK - NARENDRA AWASTHICHAPTER - GASEOUS STATEEXERCISE - Level 1 (Q.121 To Q.150)
1 Videos
- ELECTROCHEMISTRYBOOK - NARENDRA AWASTHICHAPTER - ELECTROCHEMISTRYEXERCISE - Level 3 - Subjective Problems
1 Videos
- IONIC EEQUILIBRIUMBOOK - NARENDRA AWASTHICHAPTER - IONIC EEQUILIBRIUMEXERCISE - Assertin-Reason Type Questions
1 Videos
Similar Questions
Nitrogen forms several gaseous oxides. One of them has a density of 1.33 g/L measured 764 mmHg and 150∘C. Write the formula of the compound.
View SolutionDimethyl ether decomposes as
CH3OCH3(g)→CH4(g)+CO(g)+H2(g)
When CH3OCH3(g) decomposes to 20% extent under certain conditions, what is the ratio of diffusion of pure CH3OCH3(g) with methane?
View SolutionA solution containing 1MXSO4(aq) and 1MYSO4(aq) is electrolysed. If conc. Of X2+ is 10−zM when deposition Y2+ and X2+ starts simultaneously, calculate the value of Z.
Given: 2.303RTF=0.06
E∘x2+|X=−0.12V,E∘Y2+|Y=−0.24V
View SolutionSTATEMENT-1: All strong monoprotic acid with same concentration in dilute solution show same pH.
STATEMENT-2: Water shows levelling effect.
View SolutionShown below are the black body radiation curves at temperature T_(1) and T_(2) (T_(2) gt T_(1)) . Which of the following plots is correct?
View SolutionFigure shows graphs of pressure vs density for an ideal gas at two temperature T1andT2. Which of the following is correct?
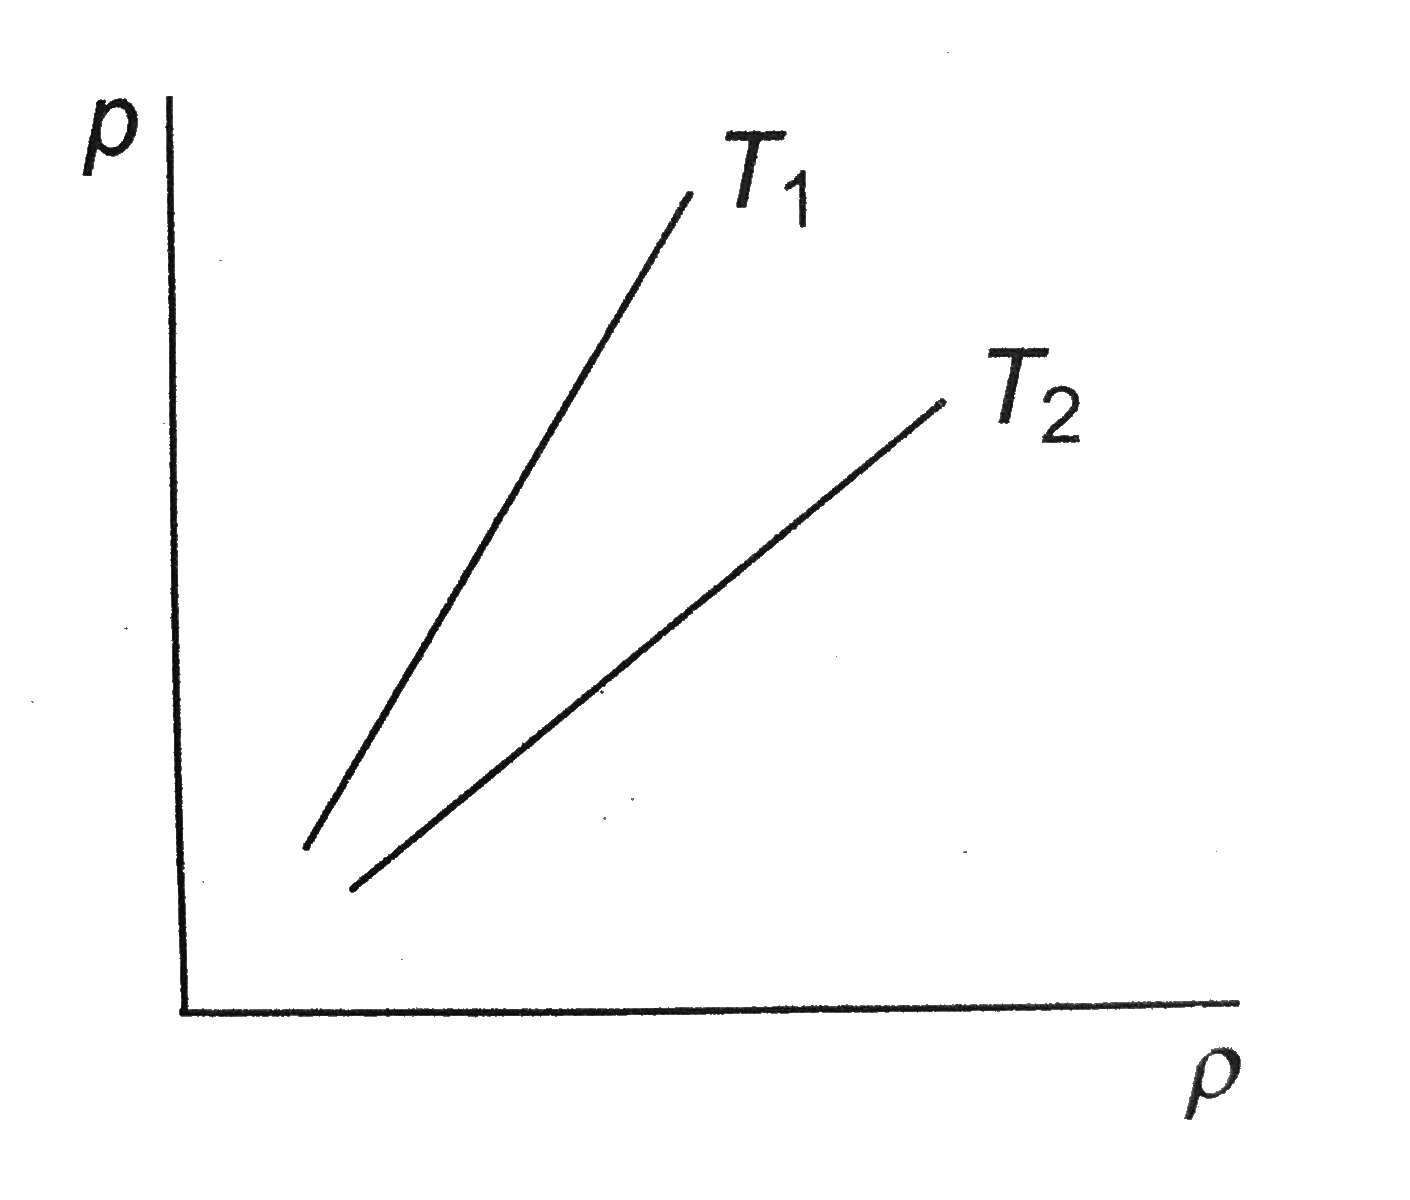
View SolutionFigure shows graphs of pressure versus density for an ideal gas at two temperatures T_(1) and T_(2) Which is correct ? .
View SolutionFor O2 gas at T1 and T2 following Maxwell speed distribution is observed [not to be scale]
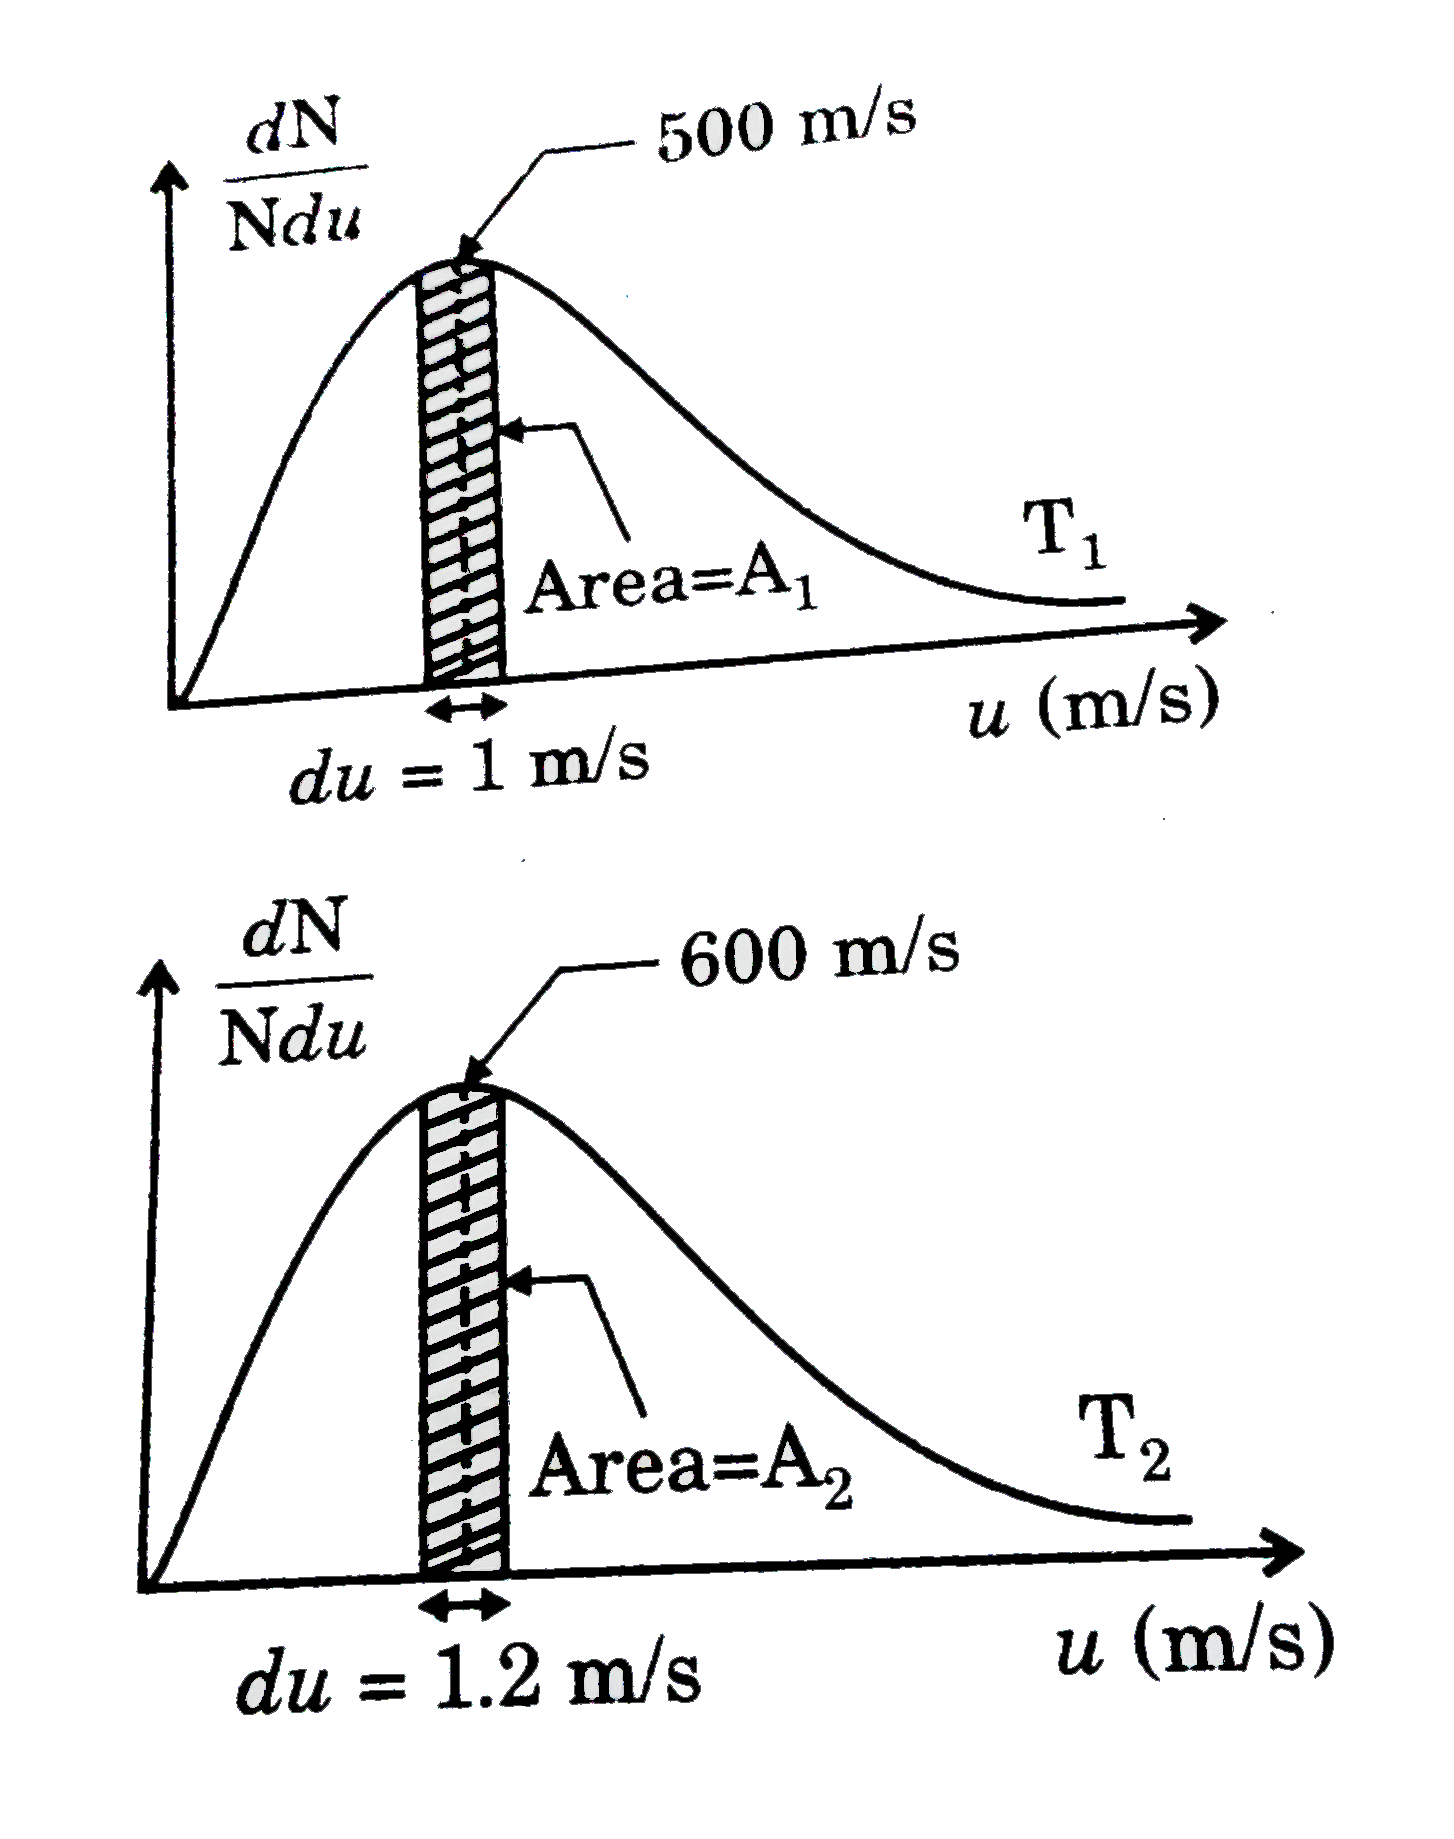
Ratio A1/A2 is equal to
View SolutionFollowing represents the Maxwell distribution curve for an ideal gas at two temperature T_(1) and T_(2) . Which of the following option(s) is/are true?
View SolutionFigure shows graphs of pressure vs density for an ideal gas at two temperature T1 and T2 . Which of the following is correct ?
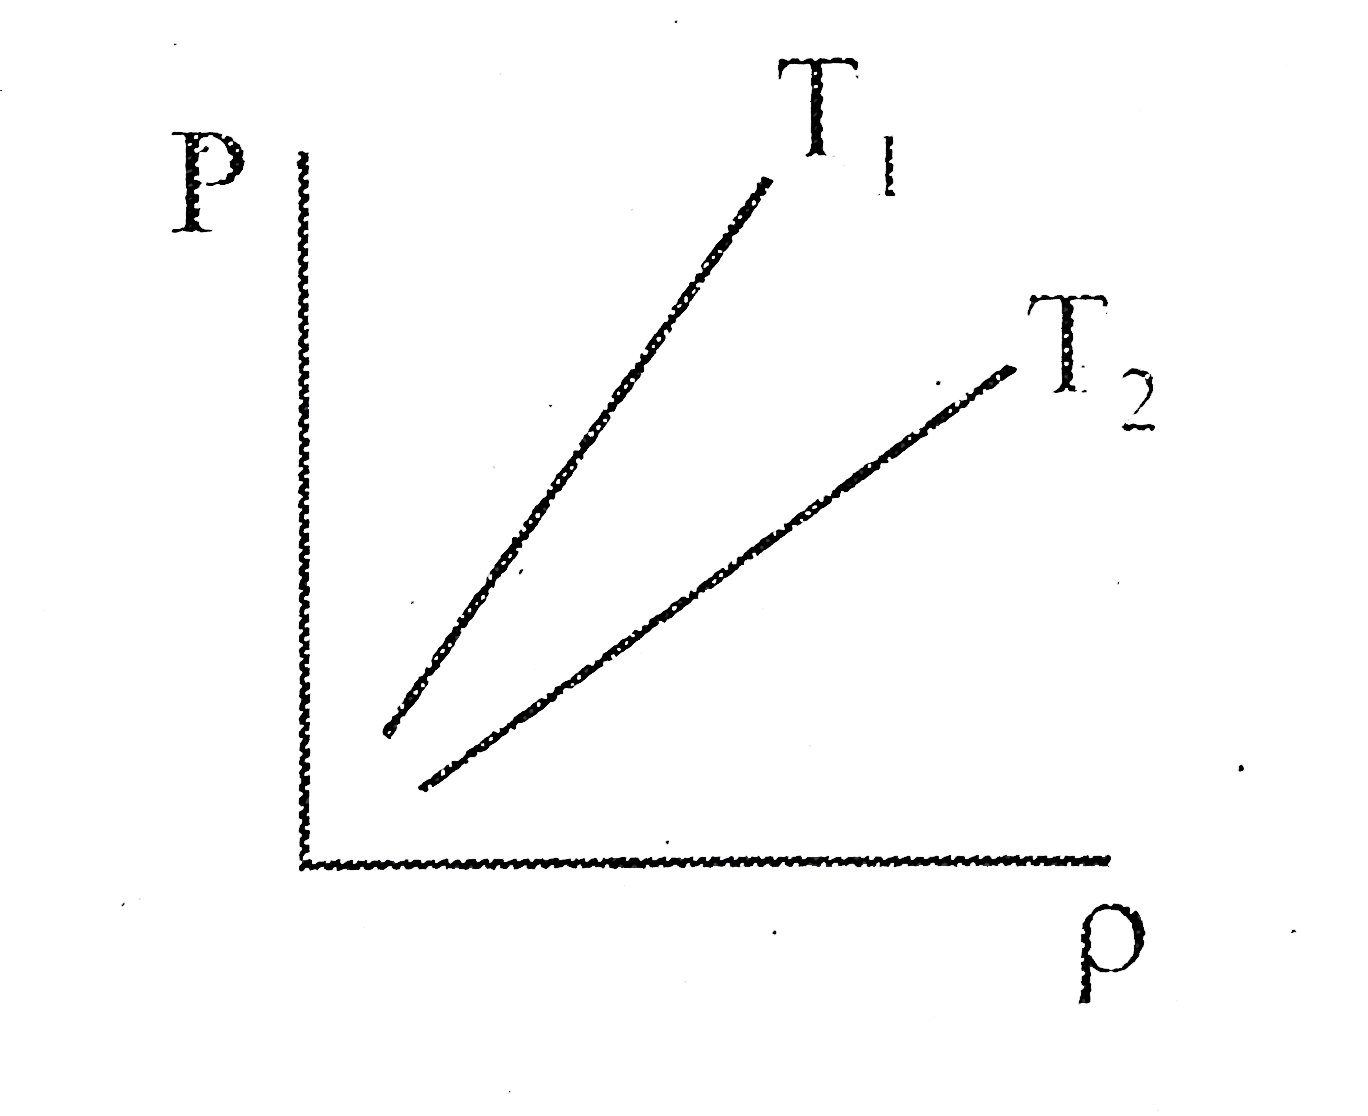
View SolutionTwo curves are given at temperatures T_(1) and T_(2) in an isothermal process, then-
View SolutionThe given figure shows the maxwell distribution of molecular speeds of a gas at three different temperature T_(1),T_(2) and T_(3) . The correct order of temperature is
View SolutionIsothermal curves for a given mass of gas are shown at two different temperture T1andT2 in Fig. State whether T1>T2orT2>T1. Justify your answer.
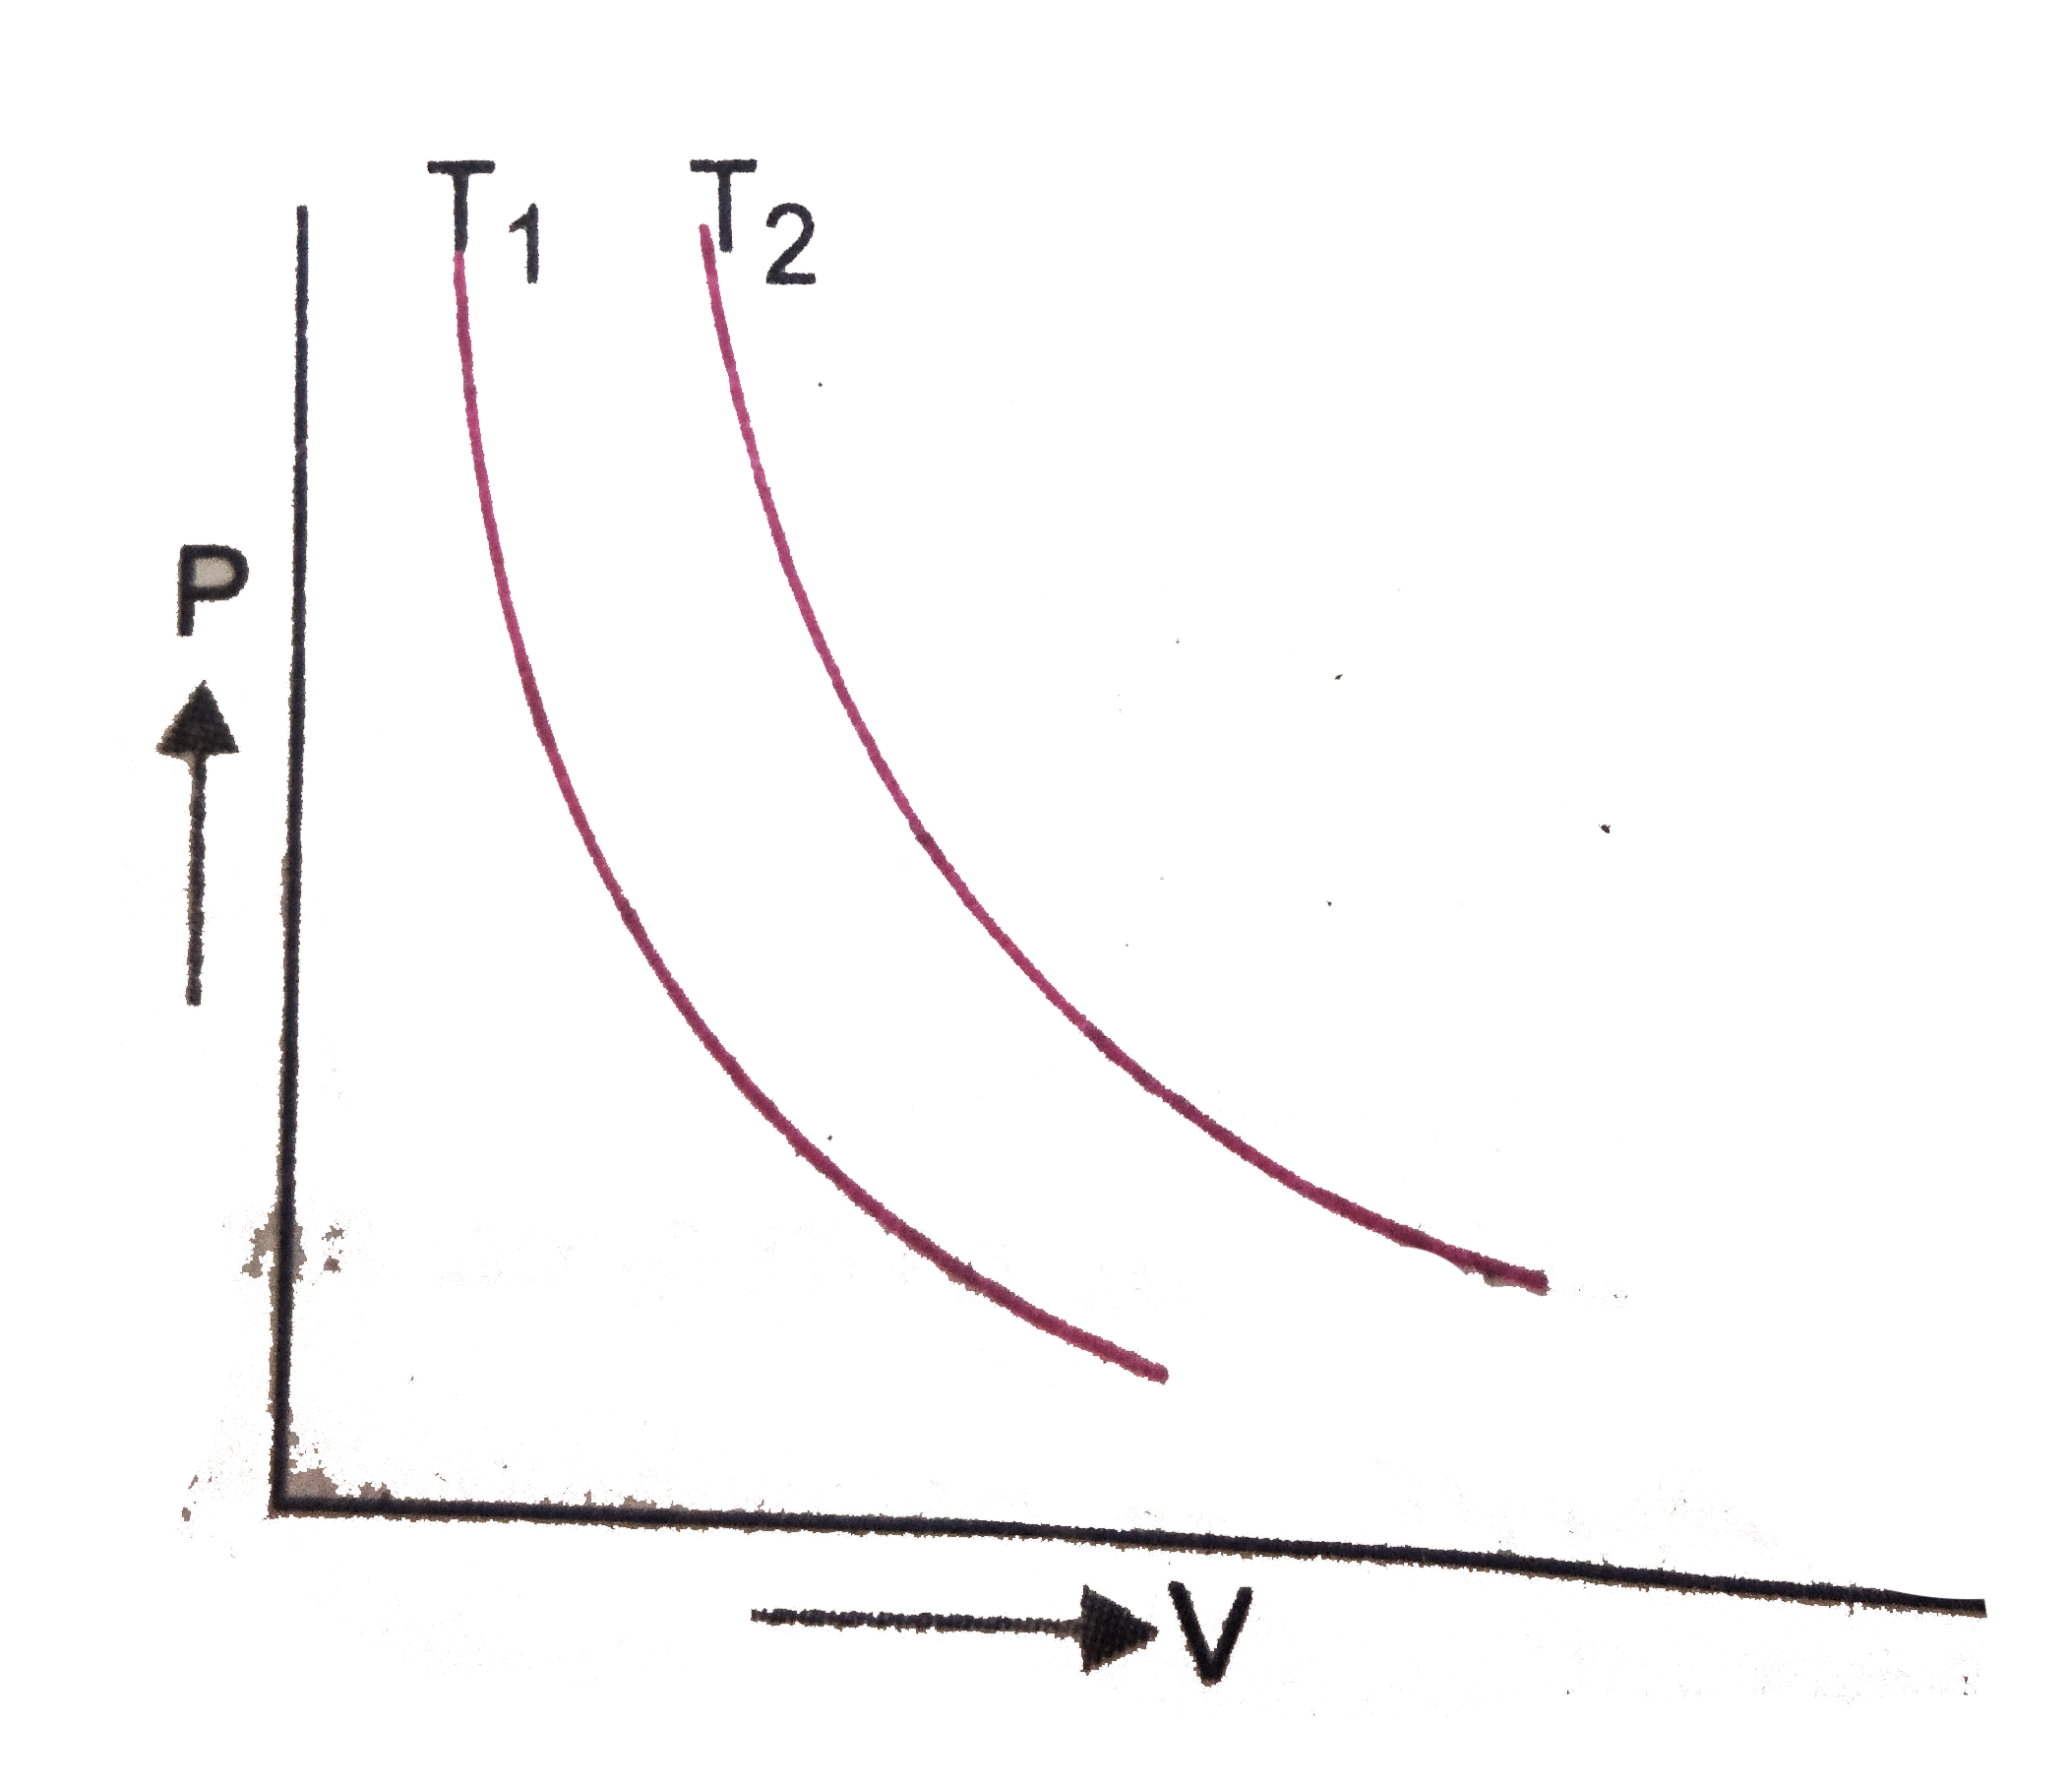
View SolutionThe following graph respresent the pressure versus number density for ideal gas at two different temperature T1andT2. The graph implies ................. .
View Solutionनिम्न चित्रों में T1 तथा T2(T2>T1) ताप पर कृष्ण वस्तु हेतु ऊर्जा वितरण दर्शाये गये हैं, कौन सा ग्राफ सही है
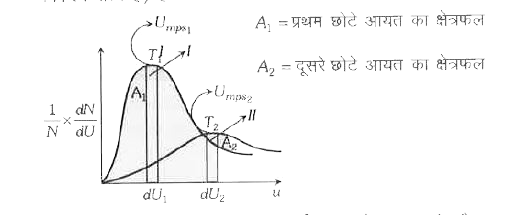
View Solutionदो तापमान T1 तथा T2 पर एक आदर्श गैस के लिए मैक्सबैल वितरण वक्र निम्न प्रकार दर्शाया गया है। निम्न में से कौनसा/से विकल्प सत्य है/हैं।
View Solution
