For a fixed amount of a real gas when a graph of Z us P was plotted then at very high pressure slope was observed to be 0.01atm−1. At the same temperature if a graph is plotted between PV us P then for 2 moles of the gas the y intercept is found to be 40 atm-litre. Calculate excluded volume in litres for 20 moles of the real gas/
The correct Answer is:4
Step by step video, text & image solution for For a fixed amount of a real gas when a graph of Z us P was plotted then at very high pressure slope was observed to be 0.01 atm^(-1). At the same temperature if a graph is plotted between PV us P then for 2 moles of the gas the y intercept is found to be 40 atm-litre. Calculate excluded volume in litres for 20 moles of the real gas/ by Chemistry experts to help you in doubts & scoring excellent marks in Class 12 exams.
Updated on:21/07/2023Topper's Solved these Questions
- GRAPHICAL INTERPRETATIONBOOK - GRB PUBLICATIONCHAPTER - GRAPHICAL INTERPRETATIONEXERCISE - Match The Column Type
15 Videos
- F-BLOCK ELEMENTSBOOK - GRB PUBLICATIONCHAPTER - F-BLOCK ELEMENTSEXERCISE - Subjective type
7 Videos
- HYDROCARBON (ALIPHATIC)BOOK - GRB PUBLICATIONCHAPTER - HYDROCARBON (ALIPHATIC)EXERCISE - Previous years jee questions
28 Videos
Similar Questions
For a fixes amount of real gas when a graph of zv/s was plotted than at very high pressure slope was observed to be 0.01atm−1. At the same temperature if a graph is plotted b//w pv v//s P then for 2 moles of the gas 'Y' intercept is found to be 40 atm-litre. calculate excluded volume in litres for 20 moles of the real gas.
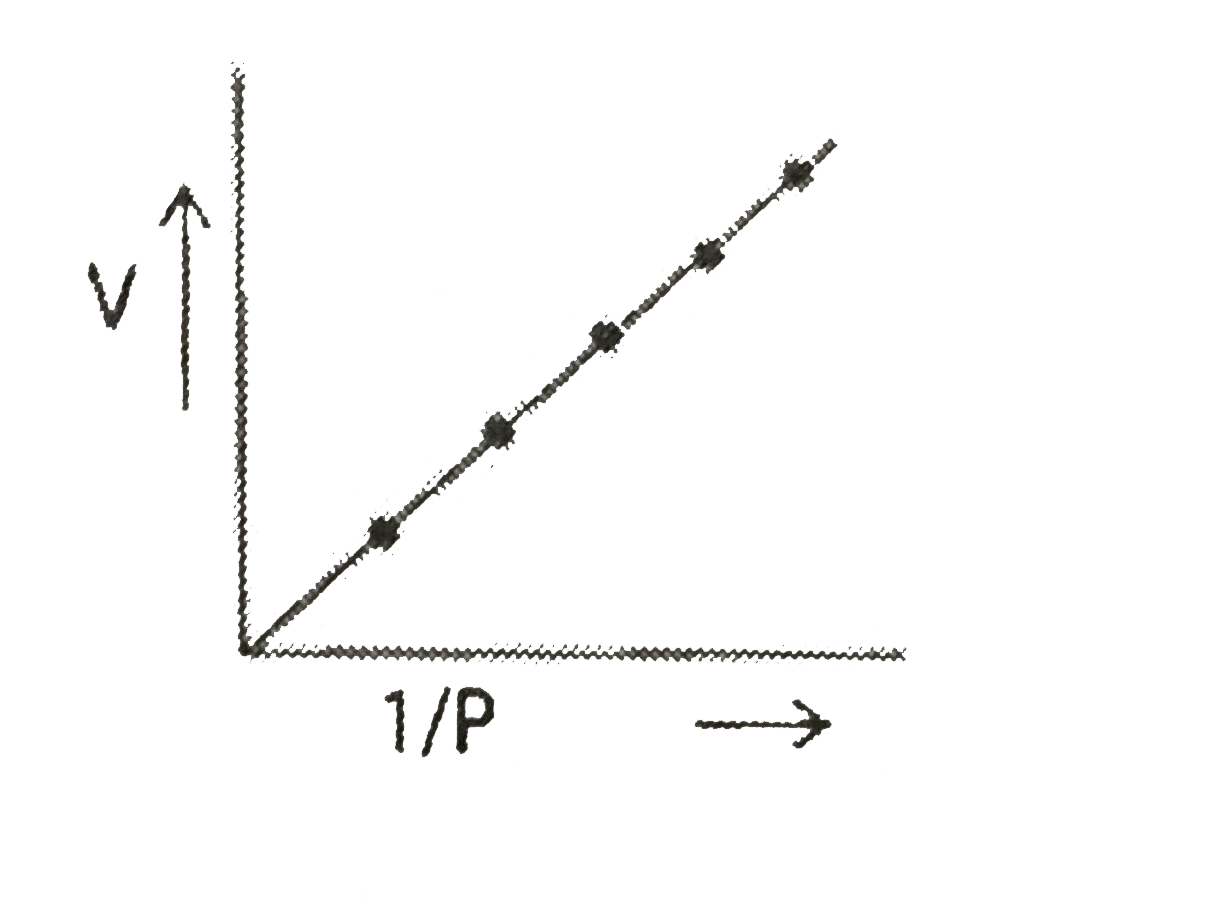
View SolutionThe slope of a given straight lime graph with constant temperature is found to be 0.2 L atm at 5 atm pressure. Calculate the volume of gas at that pressure.

View Solution
Knowledge Check
If a graph is plotted between log V and log T for 2 moles of a gas of constant pressure of 0.0821 atm, then which of the following statements are correct?
AThe curve is straight line with slope -1.BThe curve is straight line with slope +1CThe intercept on y-axis is equal to 2.DThe intercept on y-axis is equal to 0.3010.A fixed mass of an ideal gas of volume 50 litre measured at 2 atm and 0∘C. At the same temperature but at 5 atm its volume will be
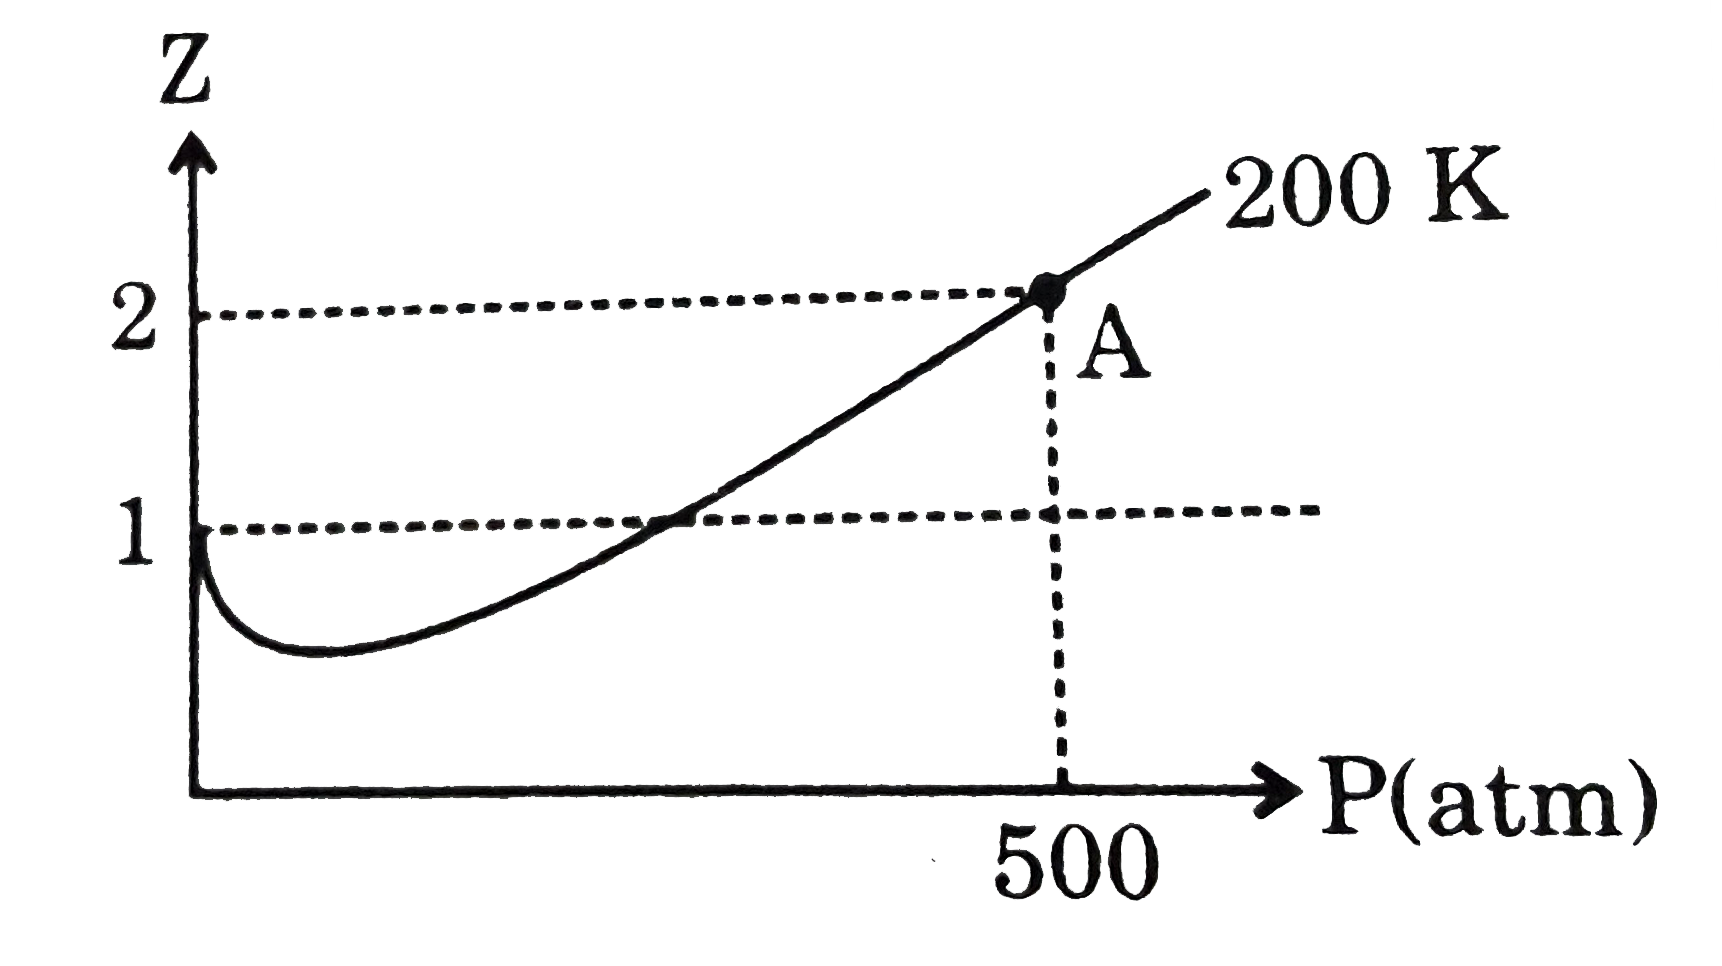
A20 litresB40 litresC60 litresD80 litresZ us P graph is plotted for 1 mole of hypothetical gas. Volume of gas at this point A is: [R=0.08atmL/mole−K]
 A0.01LB0.09LC0.064LD0.64L
A graph is plotted between PVm along Y-axis and P along X-axis whre Vm is the molar voulume of a real gas Find the intercept along Y-axis .
View SolutionWhat is the nature of graph of PV versus P for a given mass of a gas at constant temperature?
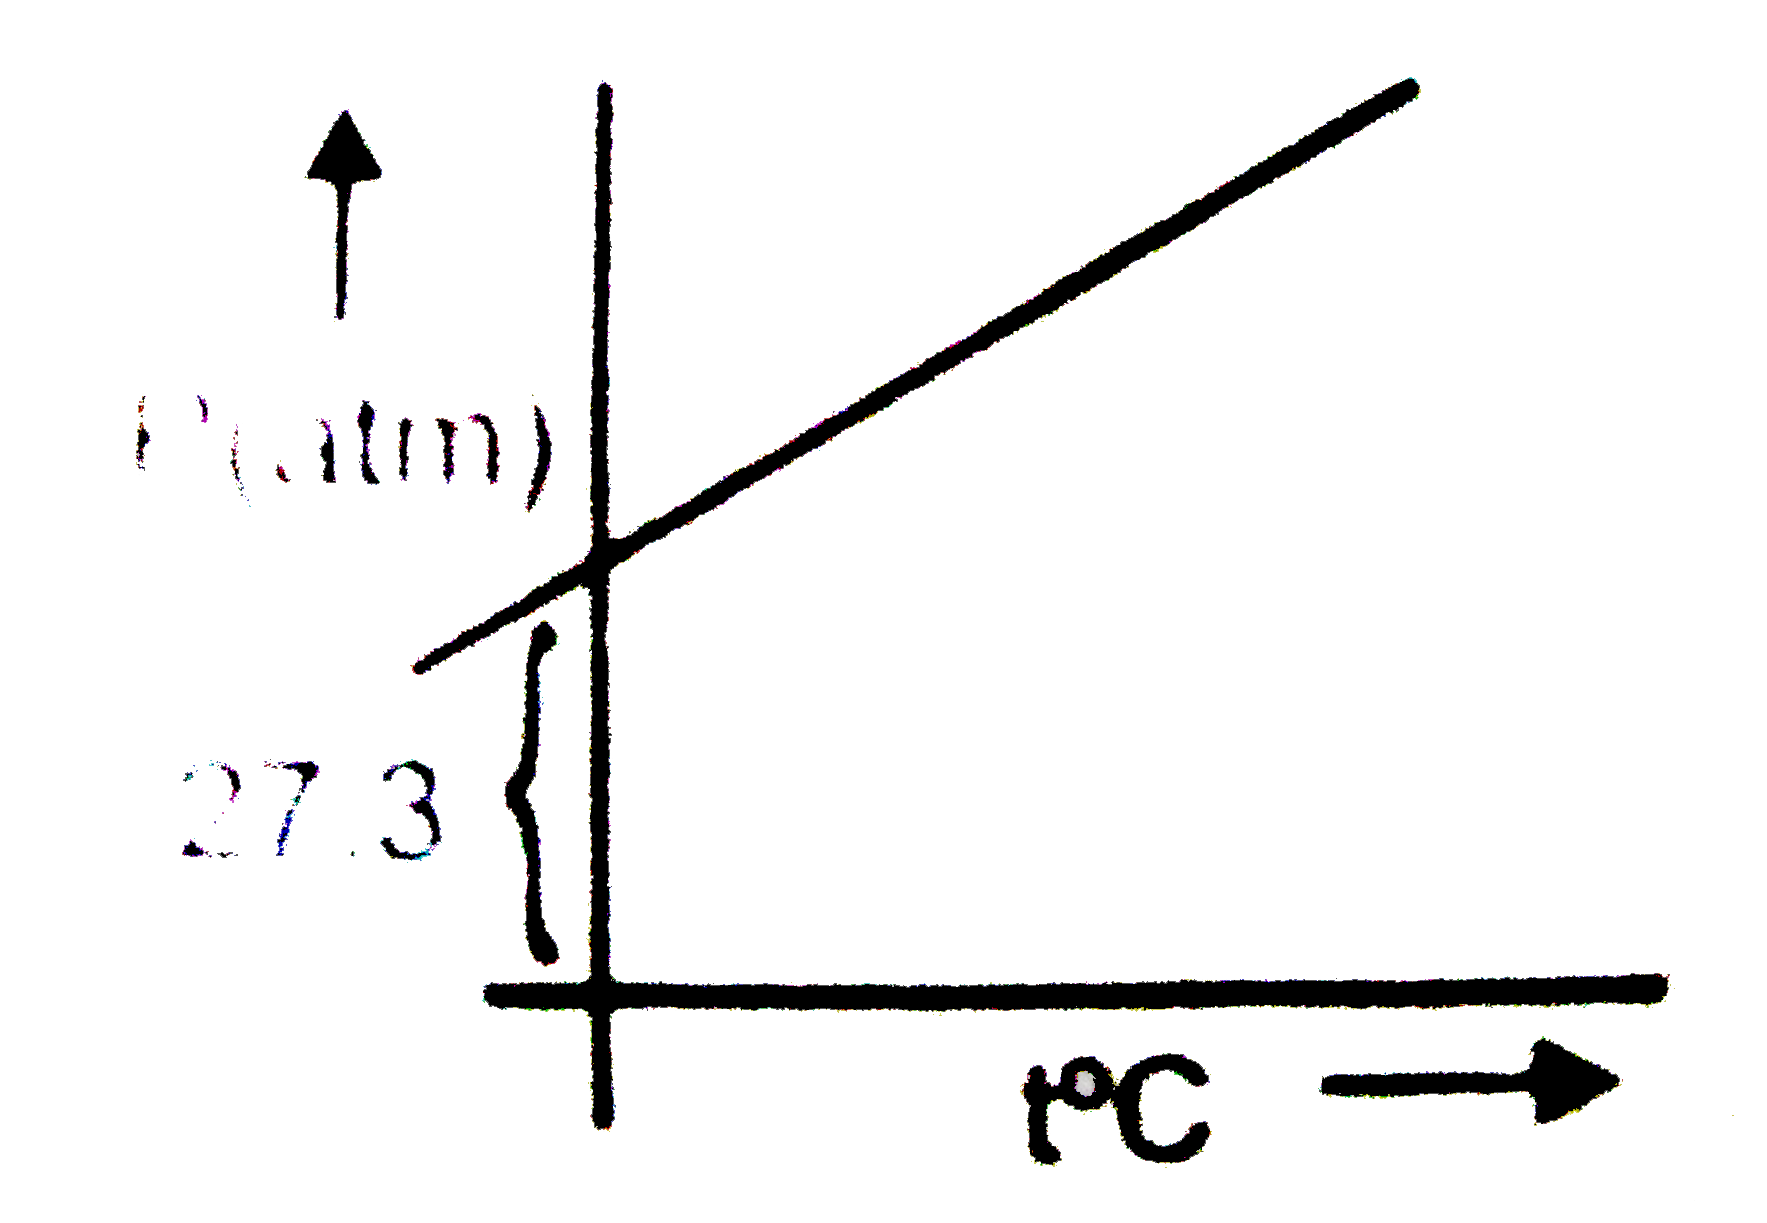
View SolutionA graph is plotted between p (atm) vs t∘C for 10 mol of an ideal gas as follows:
Then slope of curve and volume of container (L) respectively, are:

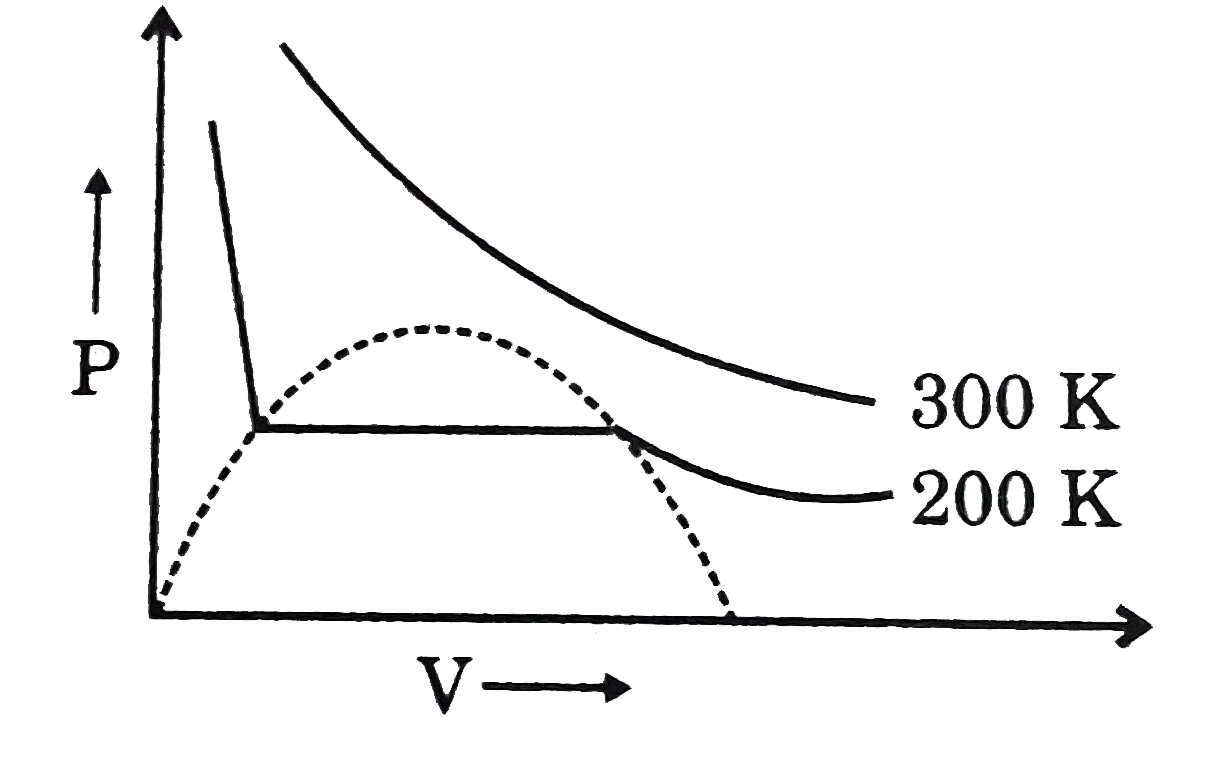
View SolutionP vs V graph is plotted for 1 mole of hypothetical gas. Range of a/b for this gas in (atm-L/mole). [R=0.08atm-litre/−mle−K]

View SolutionIf two moles of an ideal gas at 500 K occupies a volume of 41 litres, the pressure of the gas is (R=0.082LatmK−1mol−1)
View Solution
