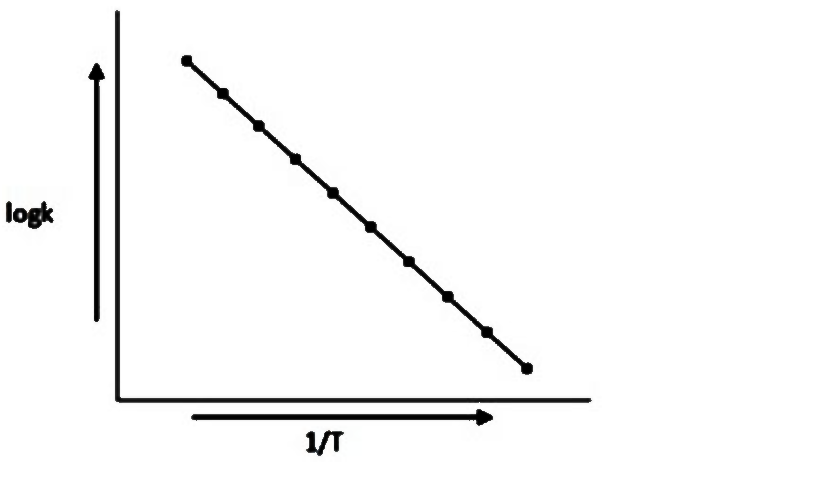
In a plot of log.k vs 1/T, the slope'is :
−Ea/2⋅303
Ea/2⋅303R
Ea/2⋅303
−Ea/2⋅303R
The correct Answer is:D
−Ea/2⋅303R
Topper's Solved these Questions
- SAMPLE PAPER 2012BOOK - ICSECHAPTER - SAMPLE PAPER 2012EXERCISE - PART-II (SECTION-A)
19 Videos
- SAMPLE PAPER 2012BOOK - ICSECHAPTER - SAMPLE PAPER 2012EXERCISE - PART-II (SECTION-B)
16 Videos
- SAMPLE PAPER 2011BOOK - ICSECHAPTER - SAMPLE PAPER 2011EXERCISE - PART-II(SECTION-B)
36 Videos
- SAMPLE PAPER 2013BOOK - ICSECHAPTER - SAMPLE PAPER 2013EXERCISE - PART-II (SECTION-C)
17 Videos
Similar Questions
The Ea of reaction in the presence of catalyst is 4.15 KJ/mol and in absence of catalyst is 8.3KJmol−1 . What is the slope of the plot of lnk vs 1T in the absence of catalyst.
View SolutionThe plot og logk vs 1/T helps to calculate
View SolutionThe Ea of reaction in the presence of catalyst is 5.25kJ/mol in the absence of catalyst is 8.314kJmol−1. What is the slope of the plot of Ink vs 1T in the absence of catalyst.
(R=8.314Jk−1mol−1)
View SolutionThe slope of straight line in a plot of log.[A] versus time for a first order raction is equal to −k/2.303.
View SolutionEffect of temperature on the equilibrium process analysed by using the thermodynamics
From the thermodynamics reaction
ΔG∘=−2.30RTlogk
ΔG∘: Standing free energy change
ΔG∘=ΔH∘−TΔS∘…(ii)
ΔH∘:Standard heat of the reaction gt
From eqns.(i) and(ii)
−2RTlogk=ΔH∘=TΔS∘
ΔS∘ : standard entropy change
⇒ logK=−ΔH∘2.3RT+ΔS∘2.3R
Clearly, if a plot of k vs 1/T is made then it is a straight lone having slope =−ΔH∘2.3R amd y intercept =ΔS∘2.3R
If at temperature T1 equilibrium constant be k1 and at temperature T2equilibrium constant be k2 then :
⇒ logK1=−ΔH∘2.3RT1+ΔS∘2.3R..(iv)
⇒ logK2=−ΔH∘2.3RT2+ΔS∘2.3R...(v)
Substracting e.q (iv) from (v), we get
from the relation we can conclude that the of equilibrium constant increase in temperature for endothermic reaction eith but value of equilibrium constant decrease with the increase in temperature for exothermic reaction
If statndard heat of dissociation of PCl5 is 230 cal then slope of the graph of log vs 1T is :
View SolutionEffect of temperature on the equilibrium process analysed by using the thermodynamics
From the thermodynamics reaction
ΔG∘=−2.30RTlogk
ΔG∘: Standing free energy change
ΔG∘=ΔH∘−TΔS∘…(ii)
ΔH∘:Standard heat of the reaction gt
From eqns.(i) and(ii)
−2RTlogk=ΔH∘=TΔS∘
ΔS∘ : standard entropy change
⇒ logK=−ΔH∘2.3RT+ΔS∘2.3R
Clearly, if a plot of k vs 1/T is made then it is a straight lone having slope =−ΔH∘2.3R amd y intercept =ΔS∘2.3R
If at temperature T1 equilibrium constant be k1 and at temperature T2equilibrium constant be k2 then :
⇒ logK1=−ΔH∘2.3RT1+ΔS∘2.3R..(iv)
⇒ logK2=−ΔH∘2.3RT2+ΔS∘2.3R...(v)
Substracting e.q (iv) from (v), we get
from the relation we can conclude that the of equilibrium constant increase in temperature for endothermic reaction eith but value of equilibrium constant decrease with the increase in temperature for exothermic reaction
For exothermic reaction if ΔS∘<0 then the sketch of log k vs 1T may be
View SolutionWhen a plot between logk and 1/T is plotted we get the graph as shown.

What is the value of slope in the graph?
View SolutionRate constant 'k' of a reaction varies with temperature 'T' according to the equation:
log,K=logA−Ea2.303R(1T)
where Ea is the activation energy. When a graph is plotted for logk vs (1)/(T )astraightl∈ewithaslopeof−4250Kisobta∈ed.Calca––te‘E_a'forthereaction.(R=8.314JK^(-1) mol^(-1))
View SolutionRate constant k of a reaction varies with temperature according to the equation
logk = constant −Ea2.303R(1T)
where Ea is the energy of activation for the reaction . When a graph is plotted for log k versus 1T , a straight line with a slope - 6670 K is obtained. Calculate the energy of activation for this reaction
View SolutionAssertion (A) : k=Ae−Ea/RT, the Arrhenius equation represents the dependence of rate constant with temperature.
Reason (R ): Plot of log.k against 1/T is linear and the activation energy can be calculated with this plot.
View Solution
