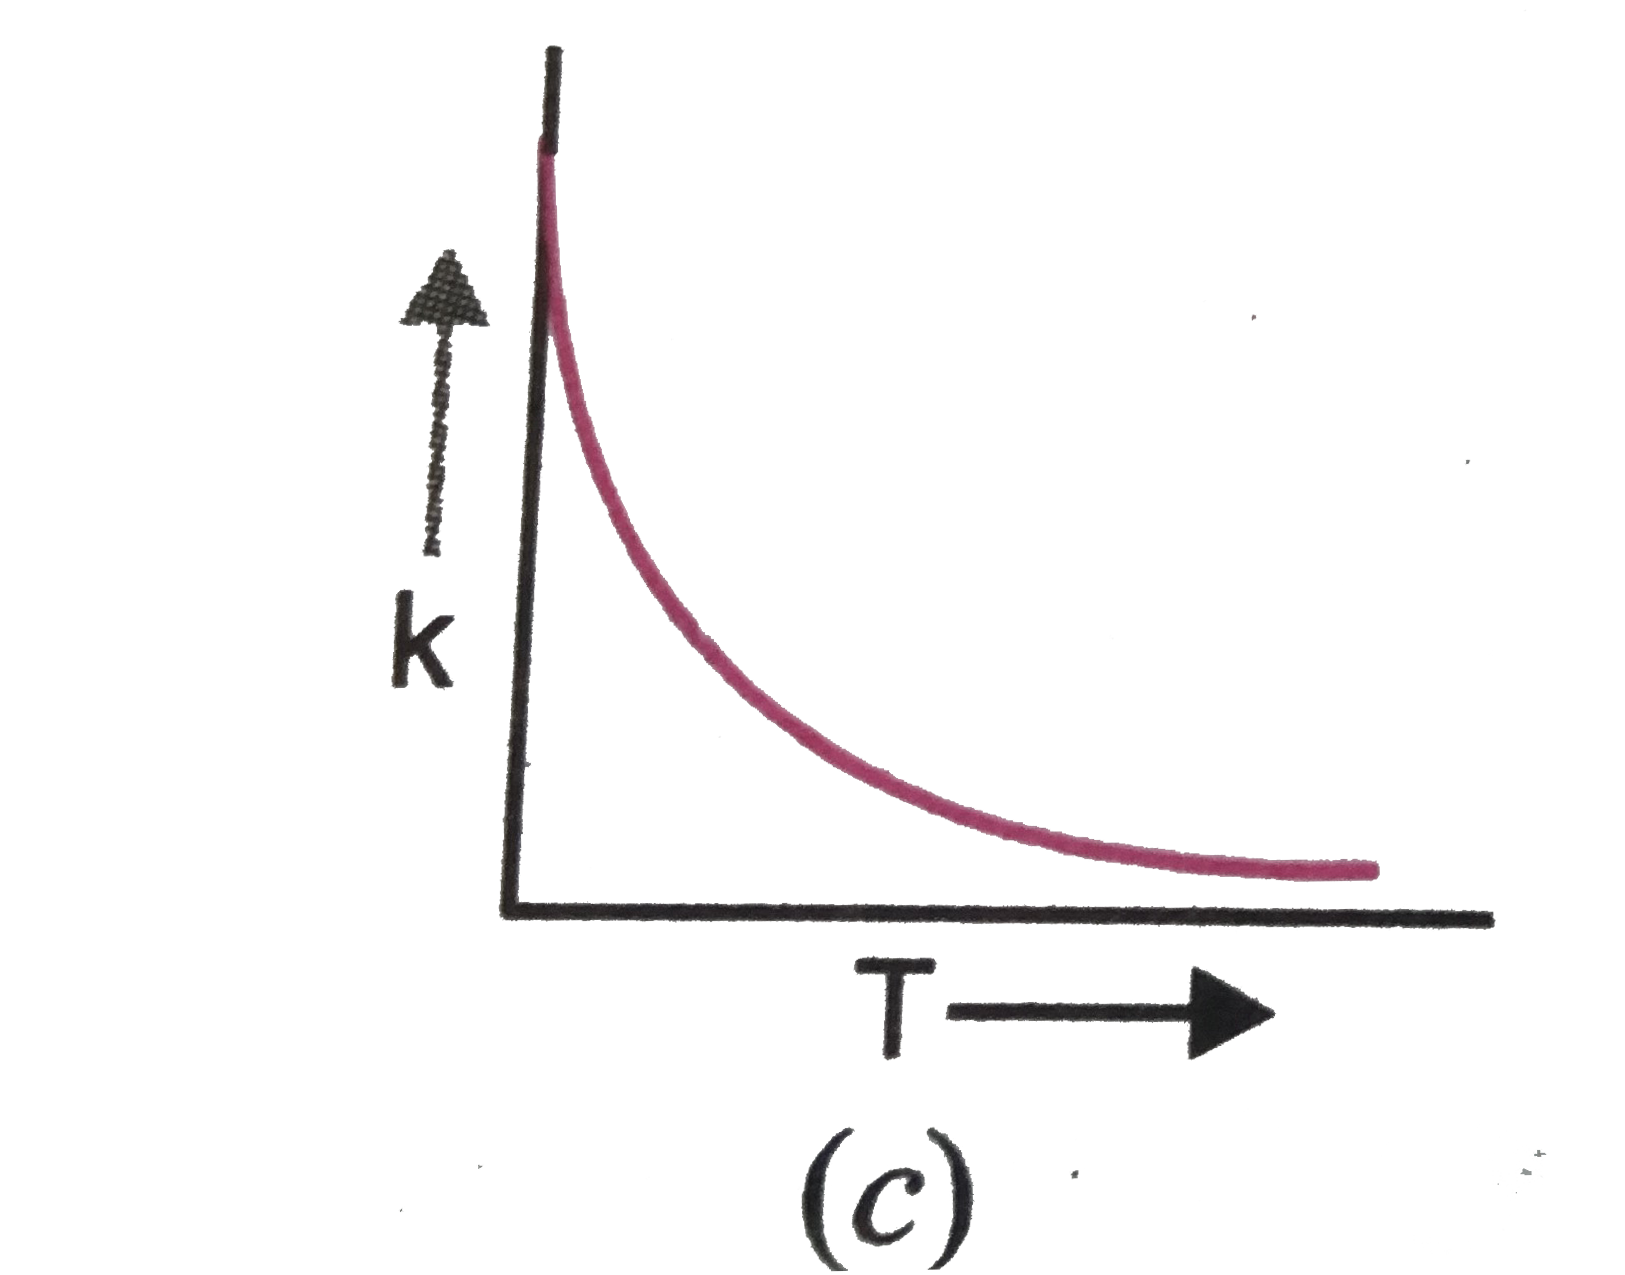
Plots showing the variation of the rate constant (k) with temperature (T) are given below. The plot that follows the Arrhenius equation is



The correct Answer is:A
k=Ae−Ea/RT=AeEa/RT Thus, as T decreases, the exponential factor in the denominator decreases or Ad−Ea/RT increases. Hence, k increases explonentially as T increases.
Topper's Solved these Questions
- CHEMICAL KINETICSBOOK - PRADEEPCHAPTER - CHEMICAL KINETICSEXERCISE - COMPETITION FOCUS (JEE(Main and Advanced)/Medical Entrance) (II. Multiple Choice Questions)
1 Video
- CHEMICAL KINETICSBOOK - PRADEEPCHAPTER - CHEMICAL KINETICSEXERCISE - COMPETITION FOCUS (JEE(Main and Advanced)/Medical Entrance) (I. Multiple Choice Questions) With one or more than one correct answers
7 Videos
- CHEMICAL KINETICSBOOK - PRADEEPCHAPTER - CHEMICAL KINETICSEXERCISE - VALUE BASED QUESTIONS (WITH ANSWERS)
2 Videos
- BIOMOLECULES BOOK - PRADEEPCHAPTER - BIOMOLECULES EXERCISE - IMPORTANT QUESTIONS (FOR BOARD EXAMINATION)
25 Videos
- CHEMISTRY IN EVERYDAY LIFE BOOK - PRADEEPCHAPTER - CHEMISTRY IN EVERYDAY LIFE EXERCISE - IMPORTANT QUESTION FOR BOARD EXAMINATION
30 Videos
Similar Questions
Which one of the following given graphs represents the variation of rate constant (k) with temperature (t) for an endothermic reaction ?
View SolutionWhich one of the following given graphs represents the variation of rate constant (k) with temperature (f) for an endothermic reaction ?
View Solution
Knowledge Check
Plots showing the variation of the rate constant (k) with temperature (T) are given below. The plot that follows the Arrhenius equation is
A B
B C
C D
D
Plots showing the variation of the rate constant (k) with temperature (T) are given below. The plot that follows the Arrhenius equation is
A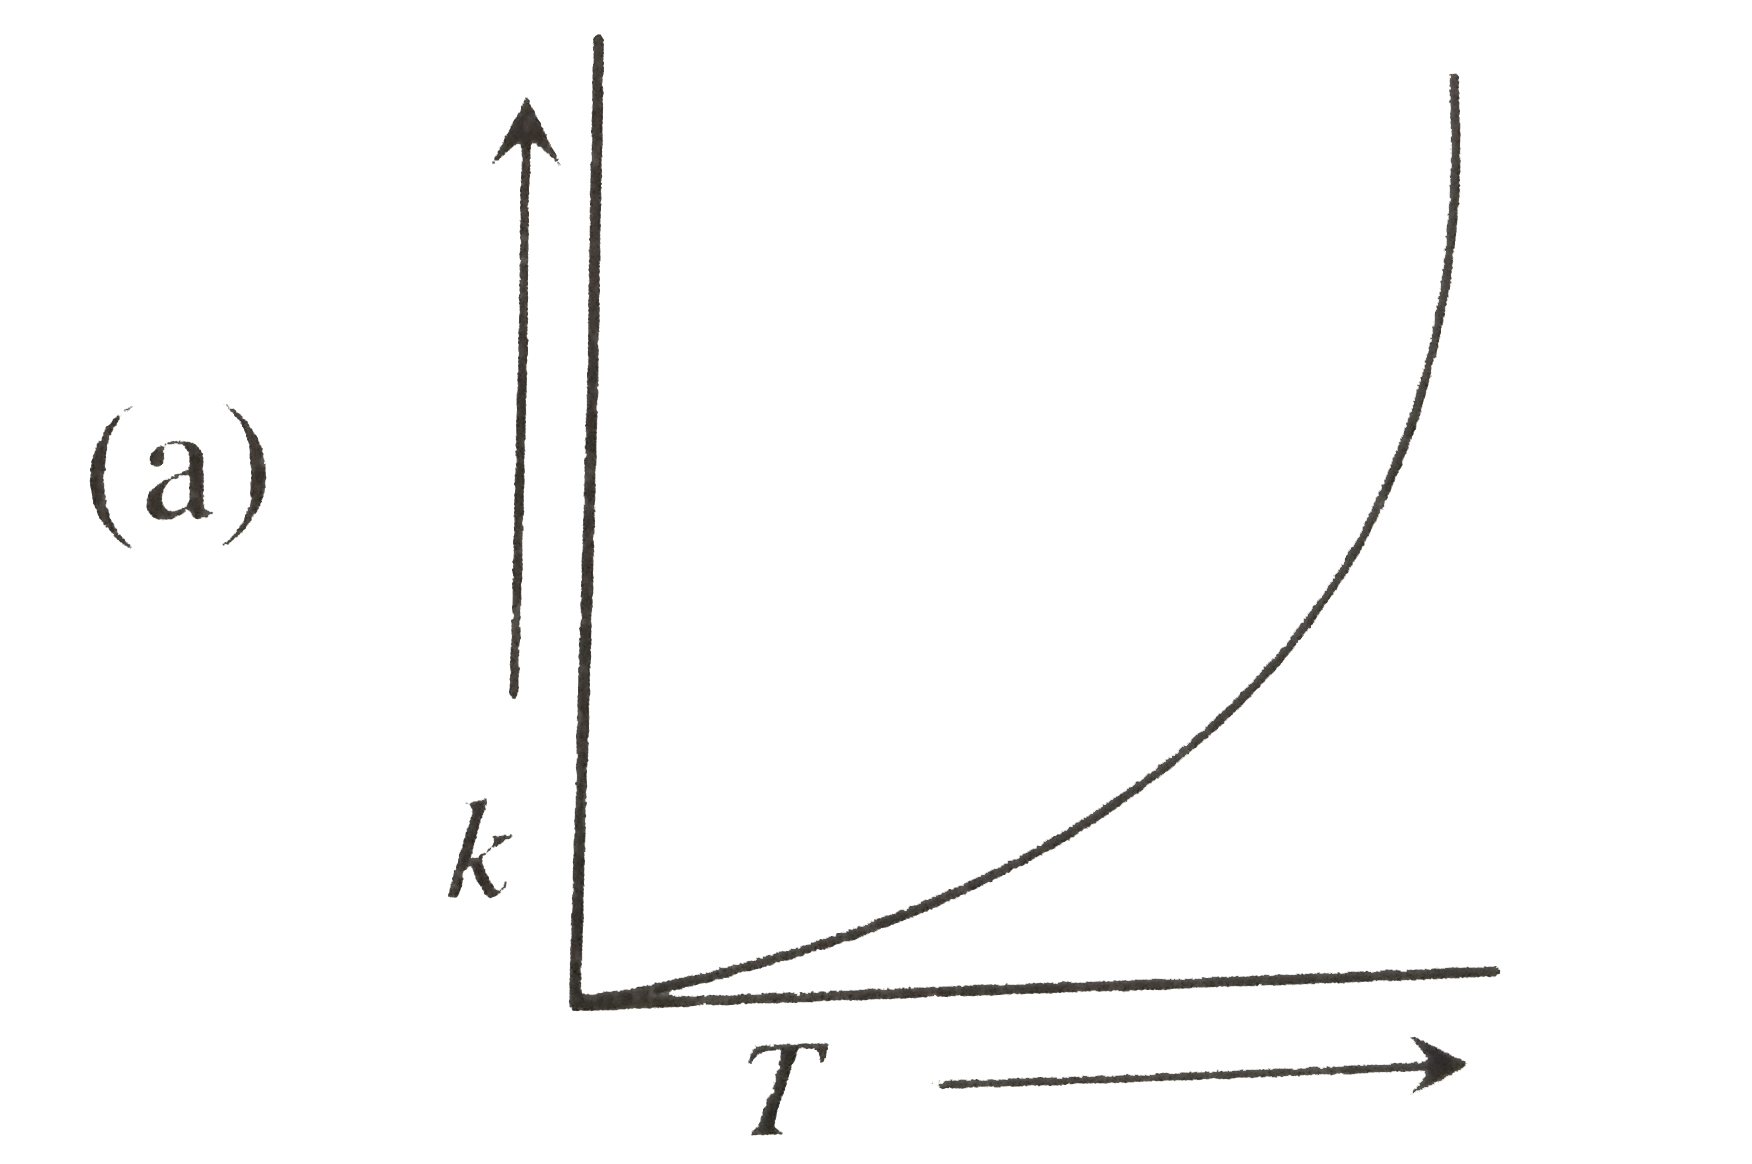 B
B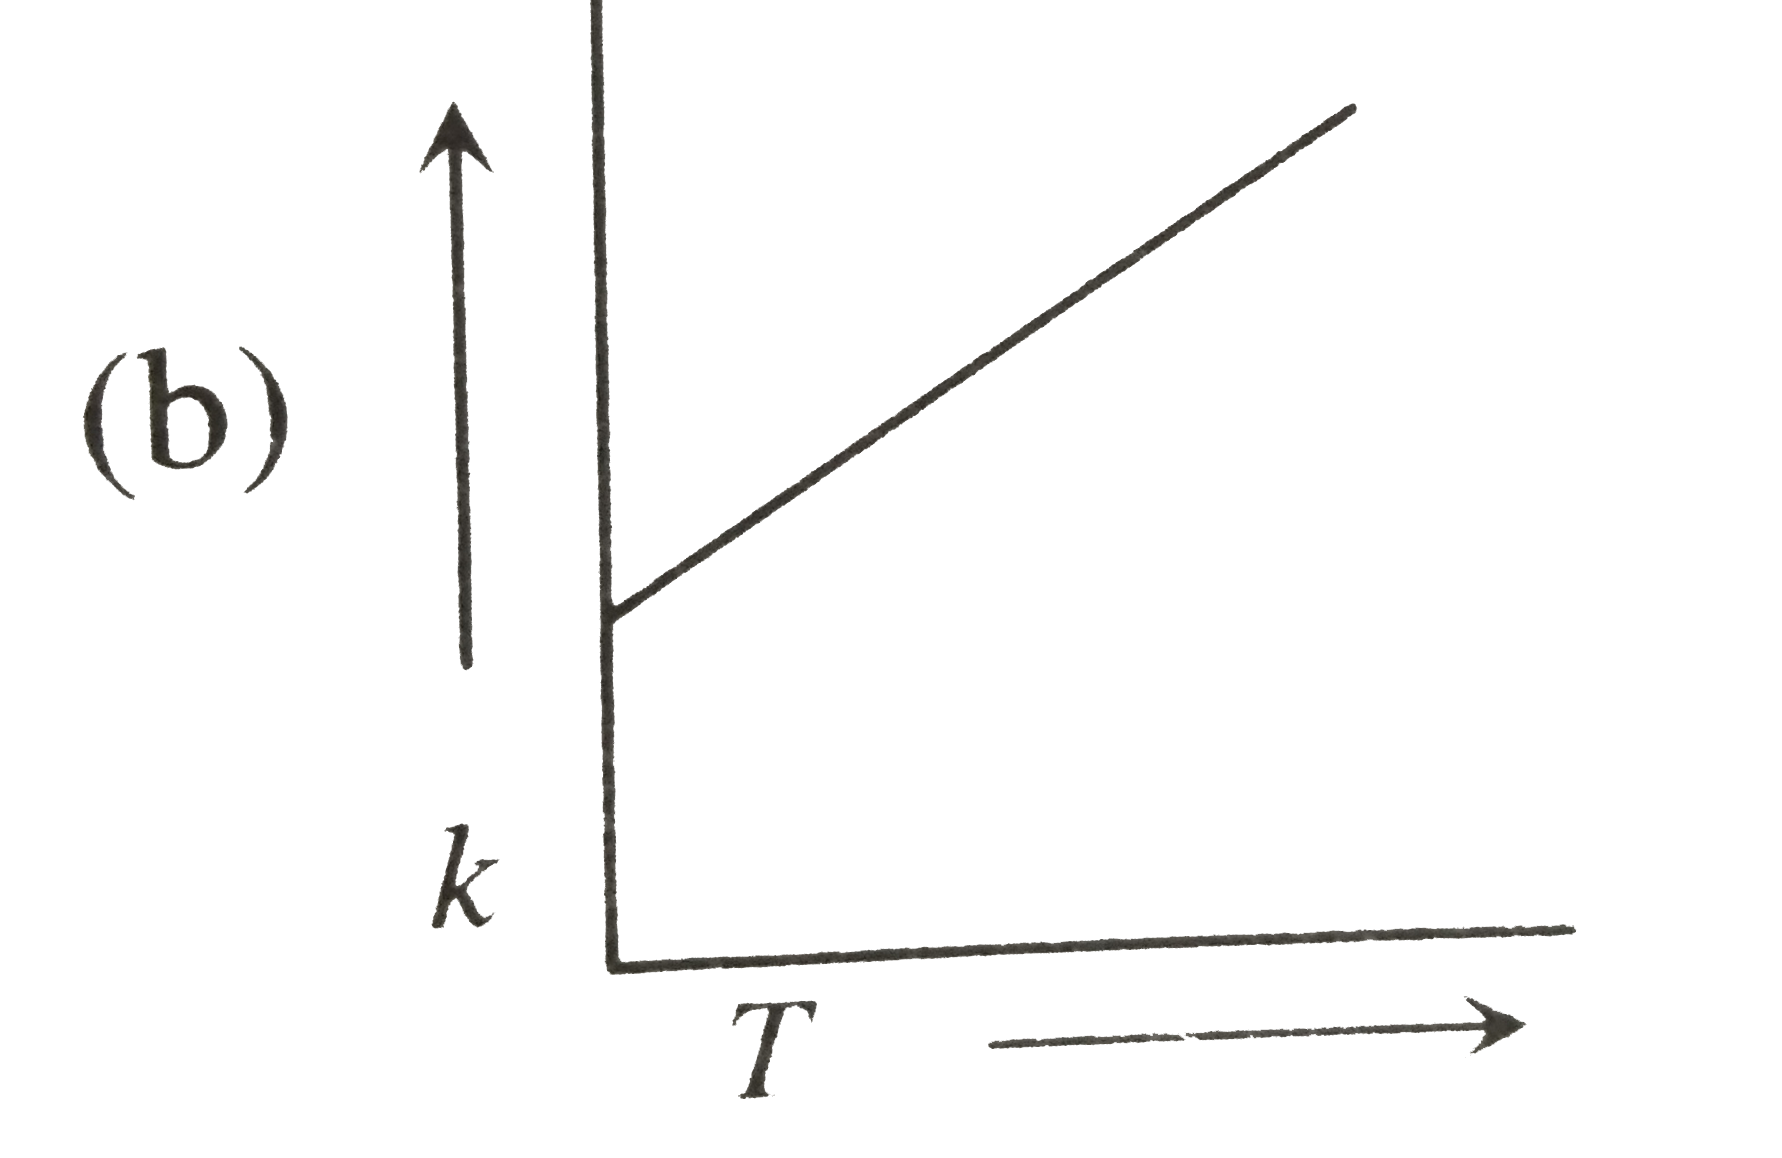 C
C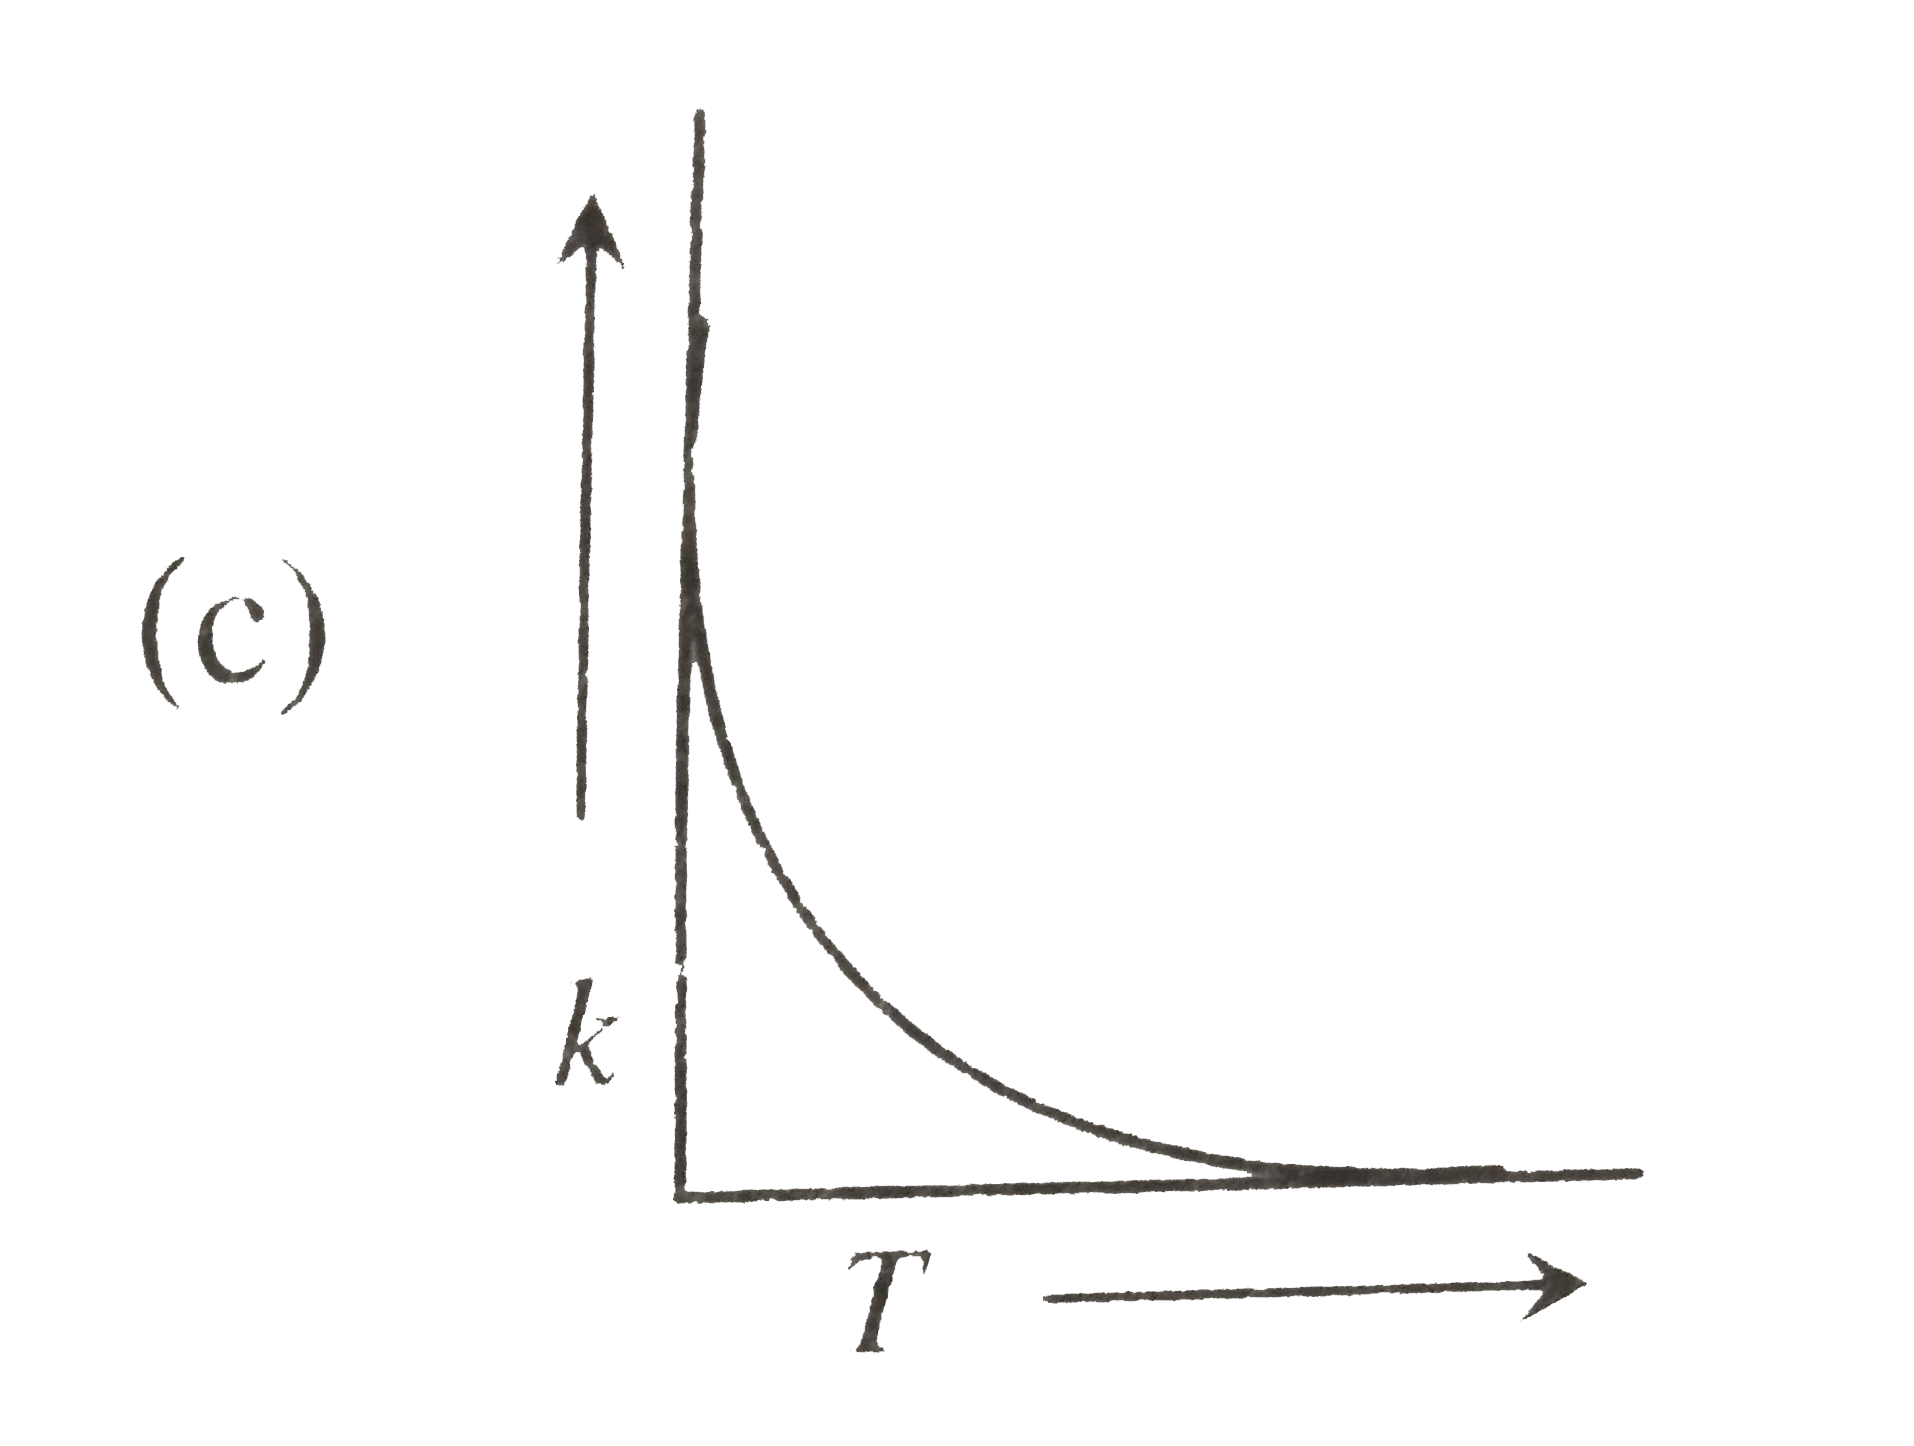 D
D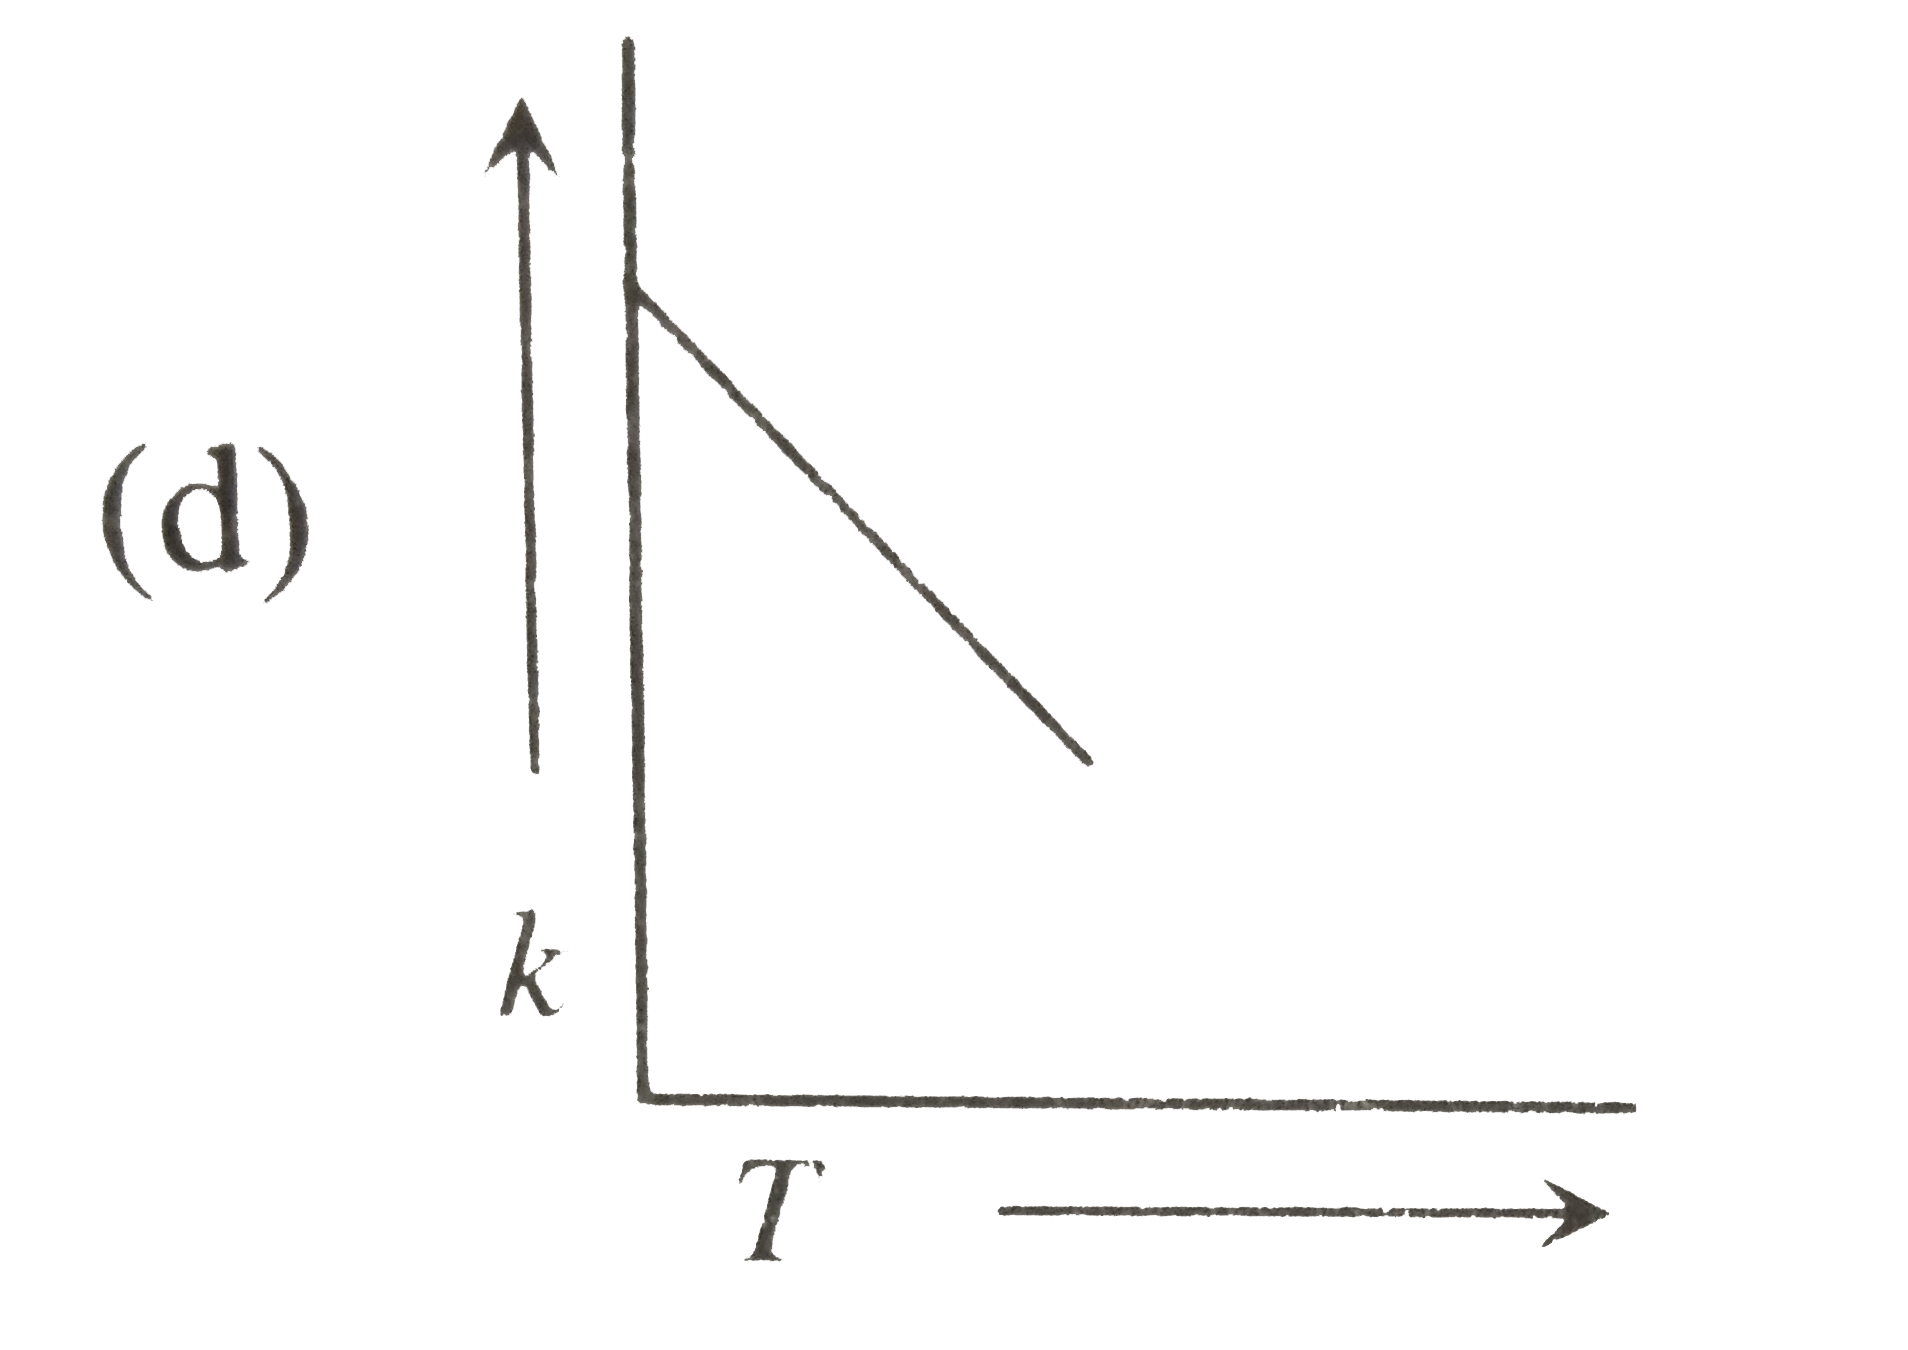
Plots showing the variation of the rate constant (k) with temperature (T) are given below. The plot that follows Arrhenius equations is
A B
B C
C D
D
The variation of rate constant with temperature is given by the integrated from of the Arrhenius equation, log10k=−Ea2.303RT + constant
where k = rate cosntant and Ea is the experimental activation energy. If for a certain reaction, log10k=−3163.0T+11.899, calculate Ea.
View SolutionWhich of the following graph is incorrect for variation of rate constant (K) with temperature for a reaction obeying Arrhenius equation ?
View SolutionAccroding to Arrhenius equation, the rate constnat (k) is related to temperature (T)as
View SolutionThe variation of rate constant with temperature can be explained by Arrhenius equation. However , the can be explained by Activation energy is found to be temperature dependent/In such cases dinKdT=EaRT2 should be used to predict variation of rate constant with tempreature. On the basic of this information , answer the question that follow :
If Arrhenius constant and Ea (activation energy0 are assumed to be constant then which of the following graph will be correct
View SolutionThe variation of rate constant with temperature can be explained by Arrhenius equation. However , the can be explained by Activation energy is found to be temperature dependent/In such casesdinKdT=EaRT2 should be used to predict variation of rate constant with tempreature. On the basic of this information , answer the question that follow :
If for a reaction in K=20−20T+3 in T then Ea at 300 K will be
View Solution