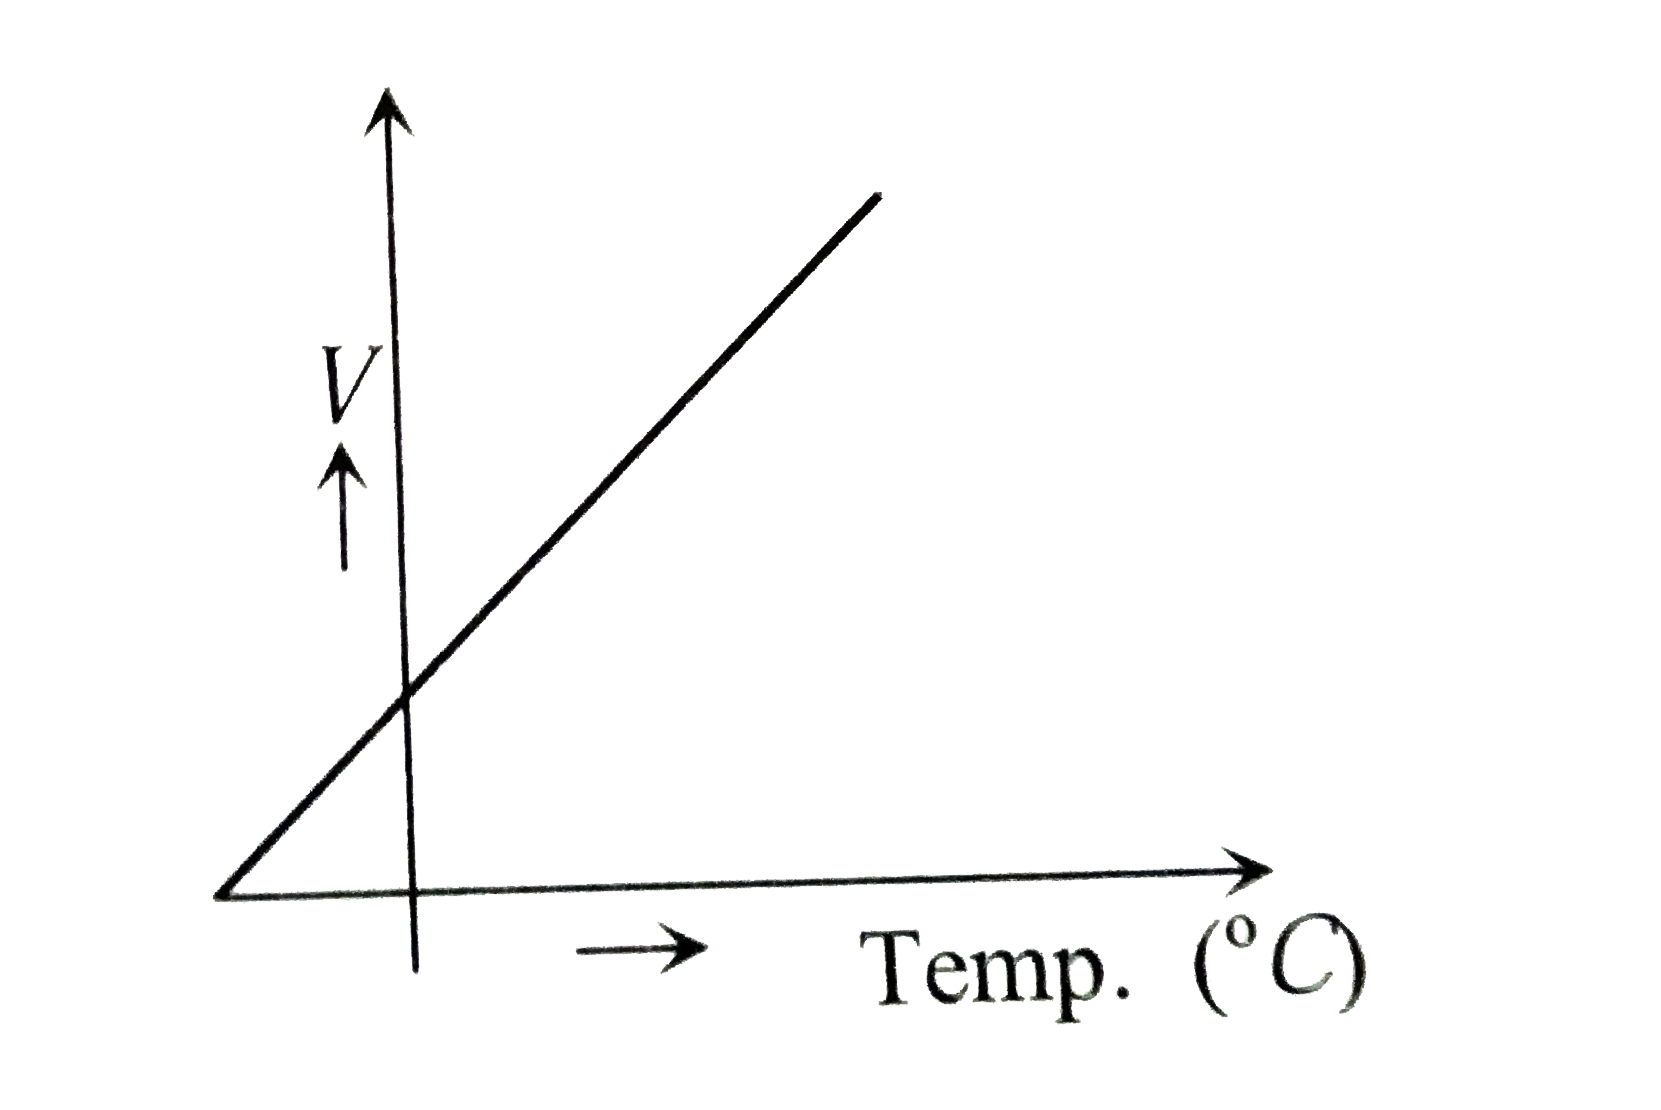
The following graph illustrates

A
Dalton's law
B
Charle' law
C
Boyle's law
D
Gau-Lussac's law
Video Solution
Text Solution
The correct Answer is:B
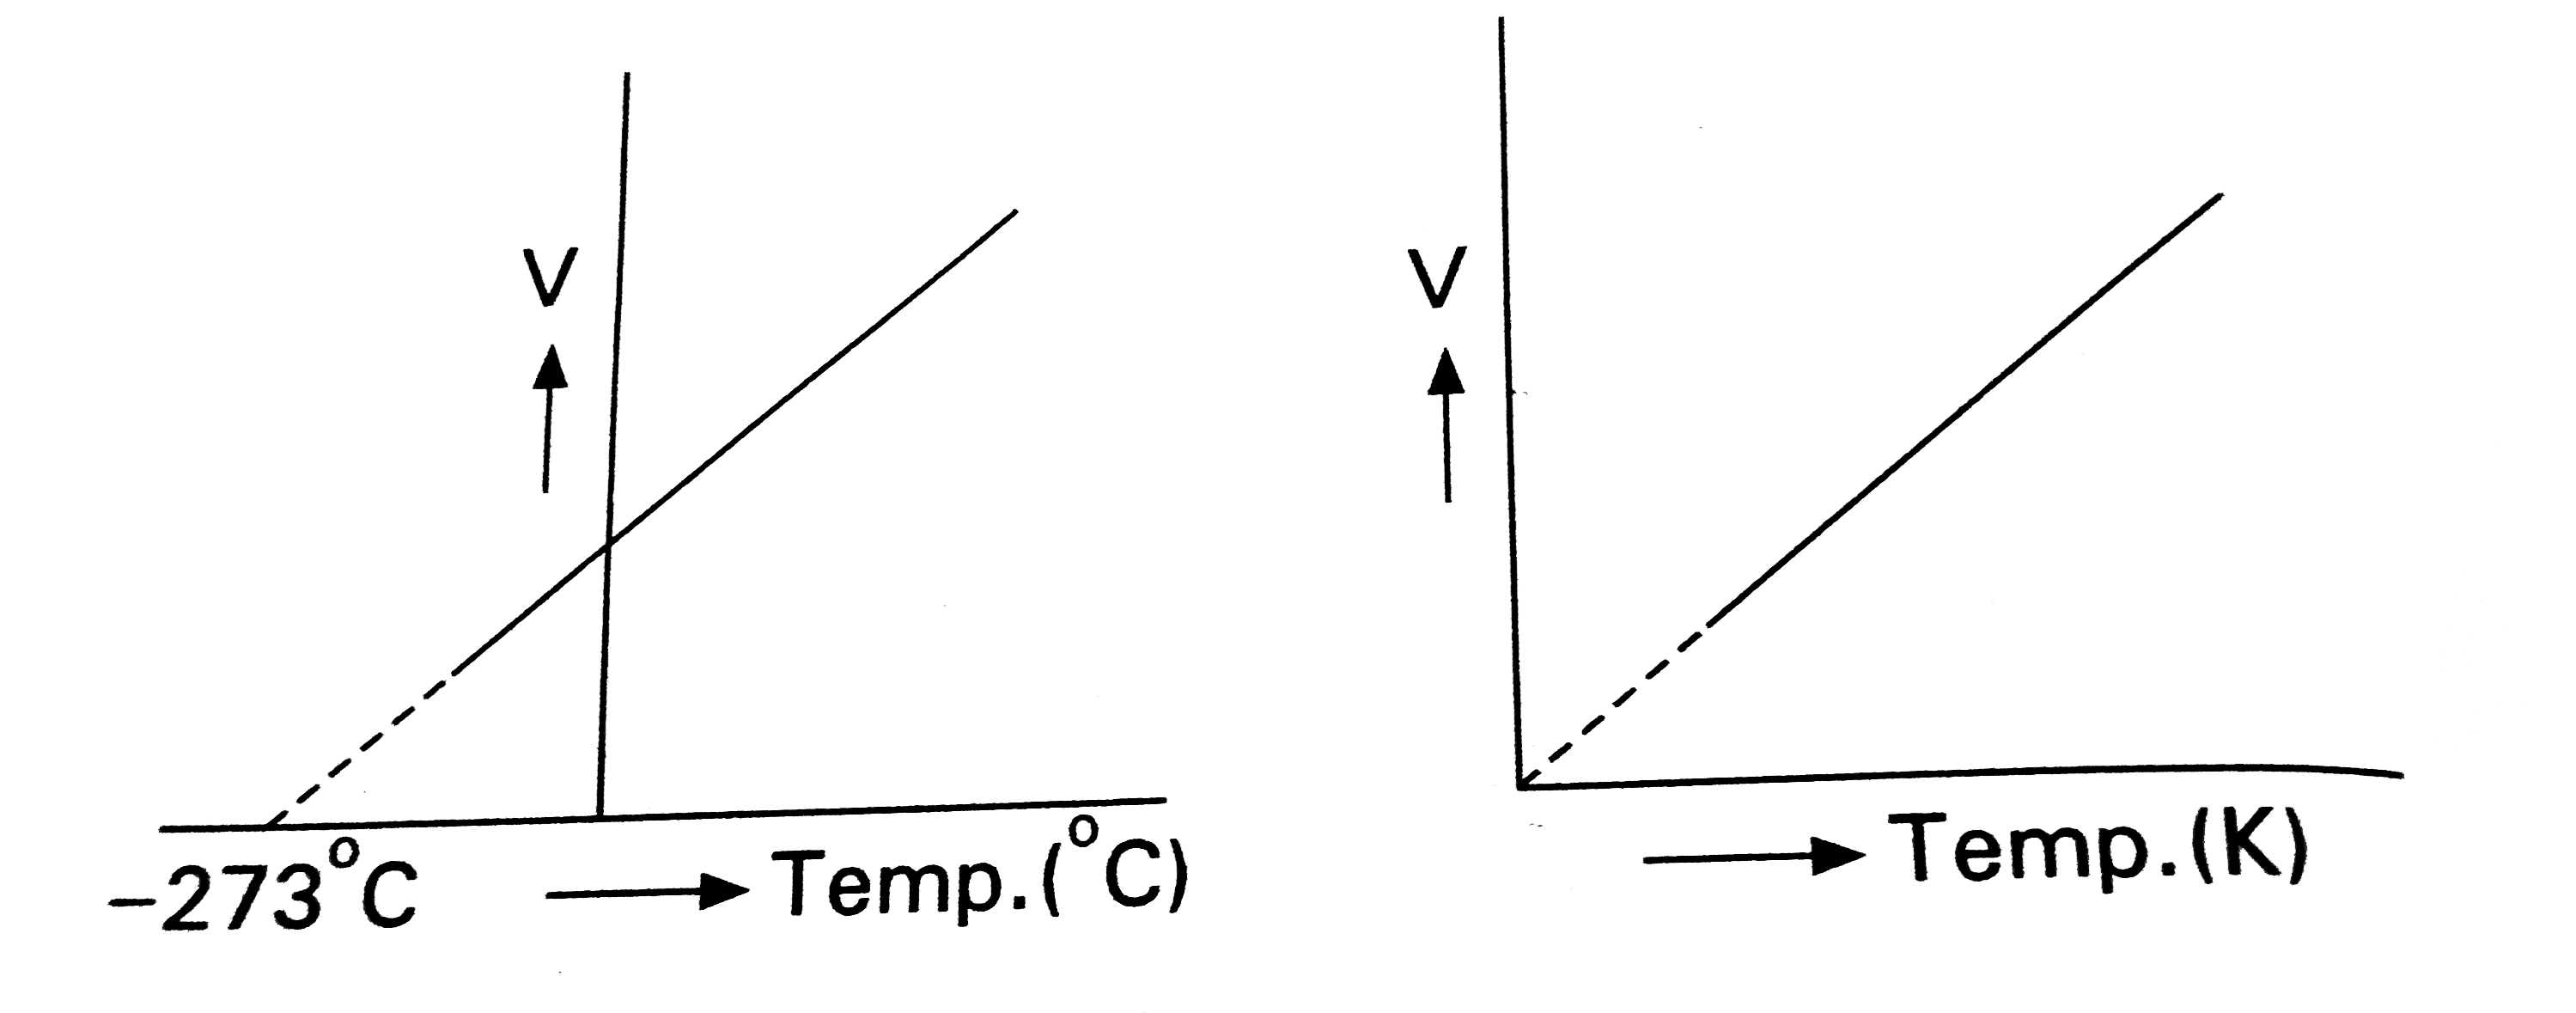
According to Charle's law V∝T
Vt=Vo+Voαt
compare it with Y=C+mx
|
Topper's Solved these Questions
- GASEOUS STATE BOOK - ERRORLESS CHAPTER - GASEOUS STATE EXERCISE - ORDINARY THINKING (Objective Questions) Kinetic theory of gases and Molecular collisions
28 Videos
- GASEOUS STATE BOOK - ERRORLESS CHAPTER - GASEOUS STATE EXERCISE - ORDINARY THINKING (Objective Questions) Molecular speeds
24 Videos
- GASEOUS STATE BOOK - ERRORLESS CHAPTER - GASEOUS STATE EXERCISE - JEE SECTION JEE (Advanced) 2018 Numeric answer type question
1 Videos
- ENVIRONMENTAL CHEMISTRYBOOK - ERRORLESS CHAPTER - ENVIRONMENTAL CHEMISTRYEXERCISE - CRITICAL THINKING (Objective question )
16 Videos
- GENERAL ORGANIC CHEMISTRYBOOK - ERRORLESS CHAPTER - GENERAL ORGANIC CHEMISTRYEXERCISE - Matrix Match type questions
4 Videos
Similar Questions
Knowledge Check
The following graphs illustrate:
 ADalton's lawBCharles's lawCBoyle's lawDGay-Lussac's law
Which of the following data illustrates the law of conservation of mass?
A56 g of CO reacts with 32 g oxygen to produce 44 g of CO2B1.70 g of AgNO3 reacts with 100 mL of 0.1 MHCl to produce 1.435 g of AgCl and 0.63 g of HNO3.C12 g of C is heated in vaccume and on cooling there is no change on mass.DNone of the above.Which of the following pairs illustrates the law of multiple proportions?
APH3,HCLBPbO, PbO2CH2S,SO2DCuCl2,CuSO4
Each of the questions is based on the table given below -----
Which of the following graphs well illustrates expenditure for water supply and cleaning in the ratio of expenditure in public sector under various plannings ?

View SolutionWhich of the following illustrates a decrease in the unemployment using the PPC?
View SolutionWhich one of the following illustrates a person with linguistic intelligence?
View SolutionWhich of the following best illustrates FEEDBACK in development
View SolutionWhich of the following best illustrates feedback in development ?
View Solution
