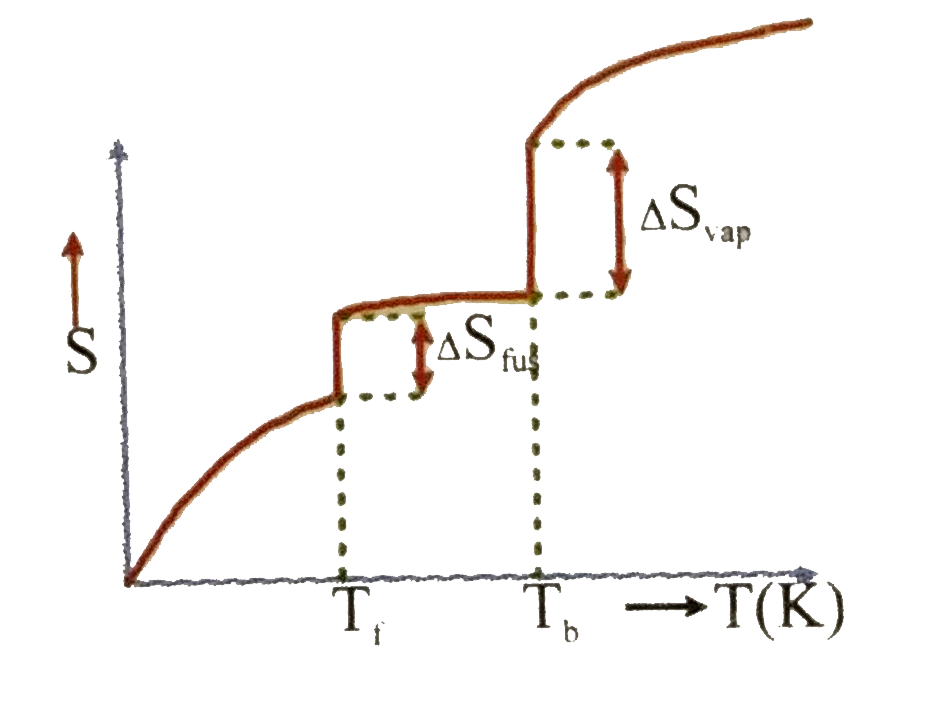
Which of the following graphs best illustrates the variation of entropy of a substance with temp.
A
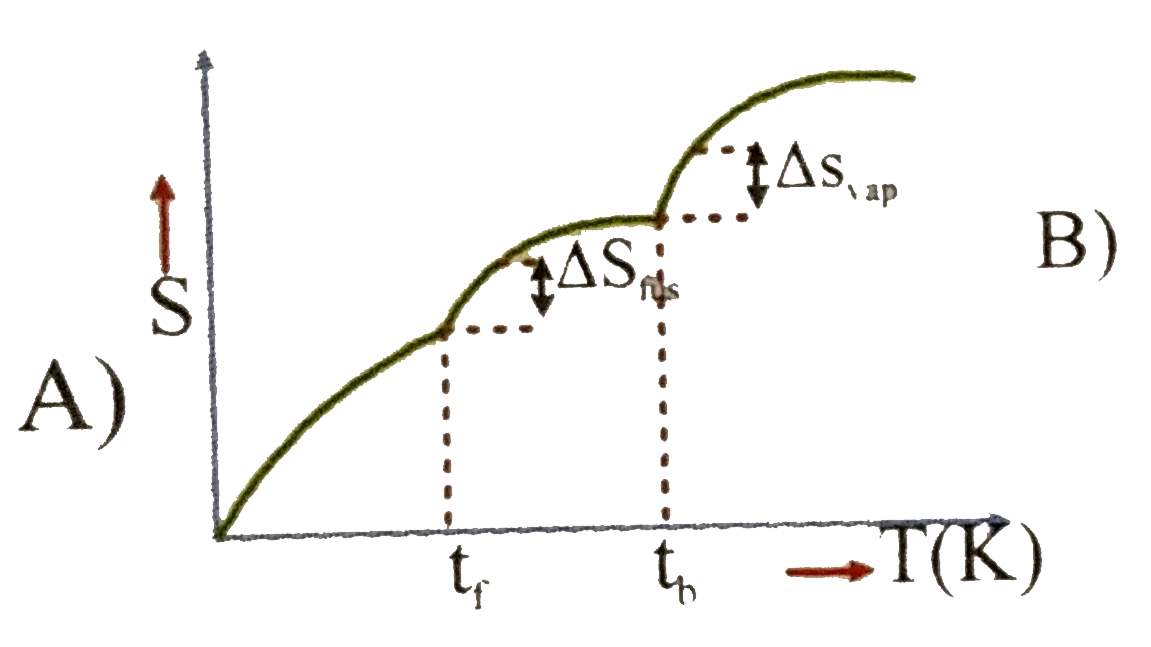
B
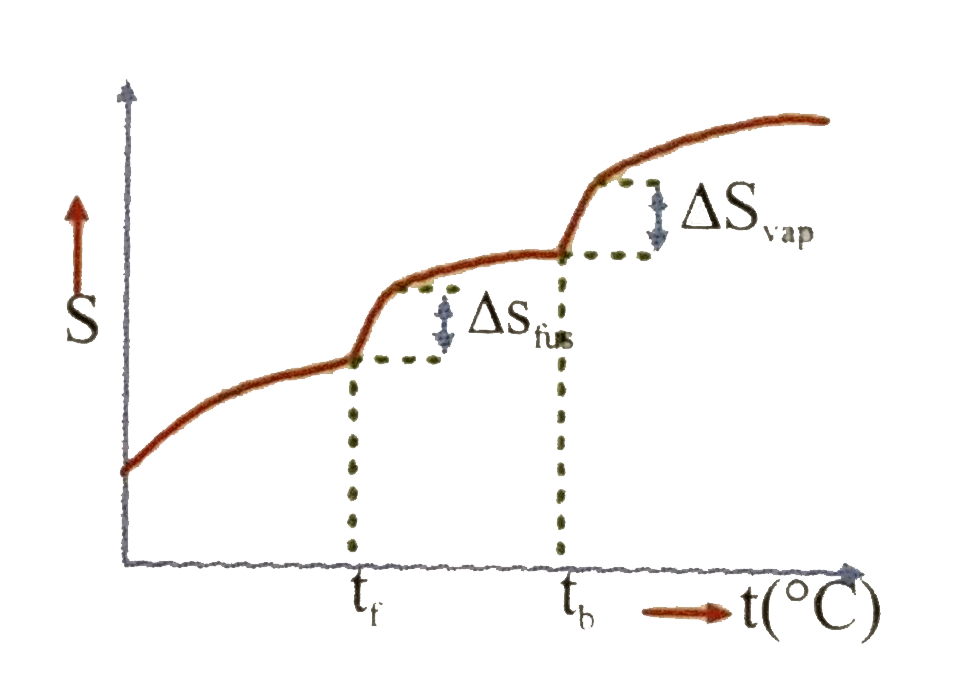
C
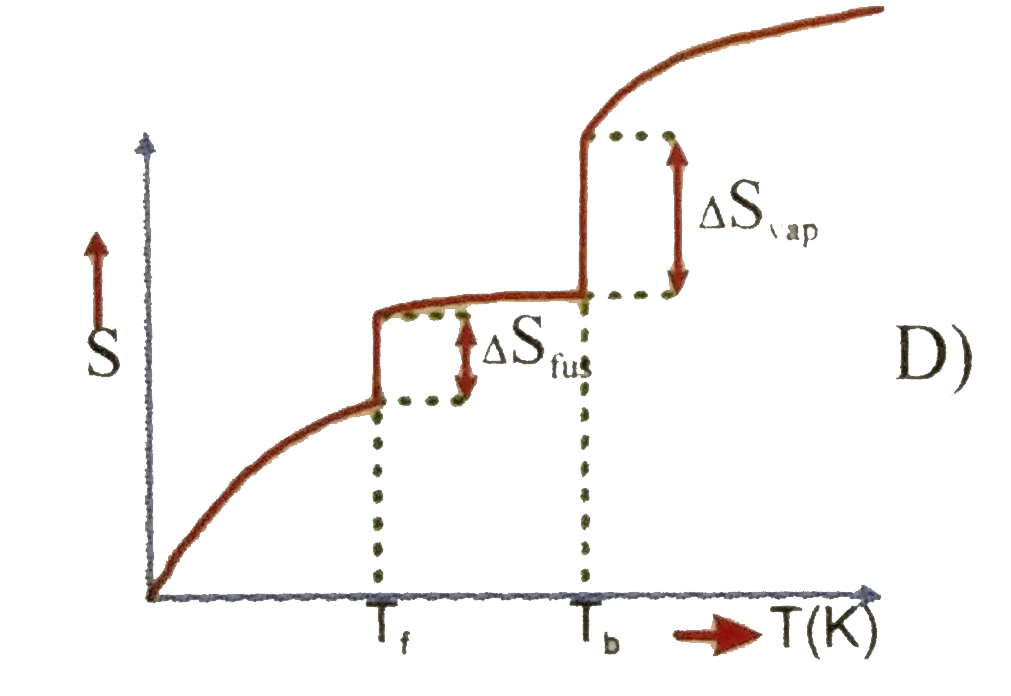
D
Text Solution
The correct Answer is:C
ΔfusionS<ΔvapS
|
Topper's Solved these Questions
- THERMODYNAMICSBOOK - NARAYNACHAPTER - THERMODYNAMICSEXERCISE - Passages
13 Videos
- THERMODYNAMICSBOOK - NARAYNACHAPTER - THERMODYNAMICSEXERCISE - Matching type
6 Videos
- THERMODYNAMICSBOOK - NARAYNACHAPTER - THERMODYNAMICSEXERCISE - Level -V
106 Videos
- STRUCTURE OF ATOMBOOK - NARAYNACHAPTER - STRUCTURE OF ATOMEXERCISE - EXERCISE - IV EXEMPLAR PROBLEMS
24 Videos
Similar Questions
Knowledge Check
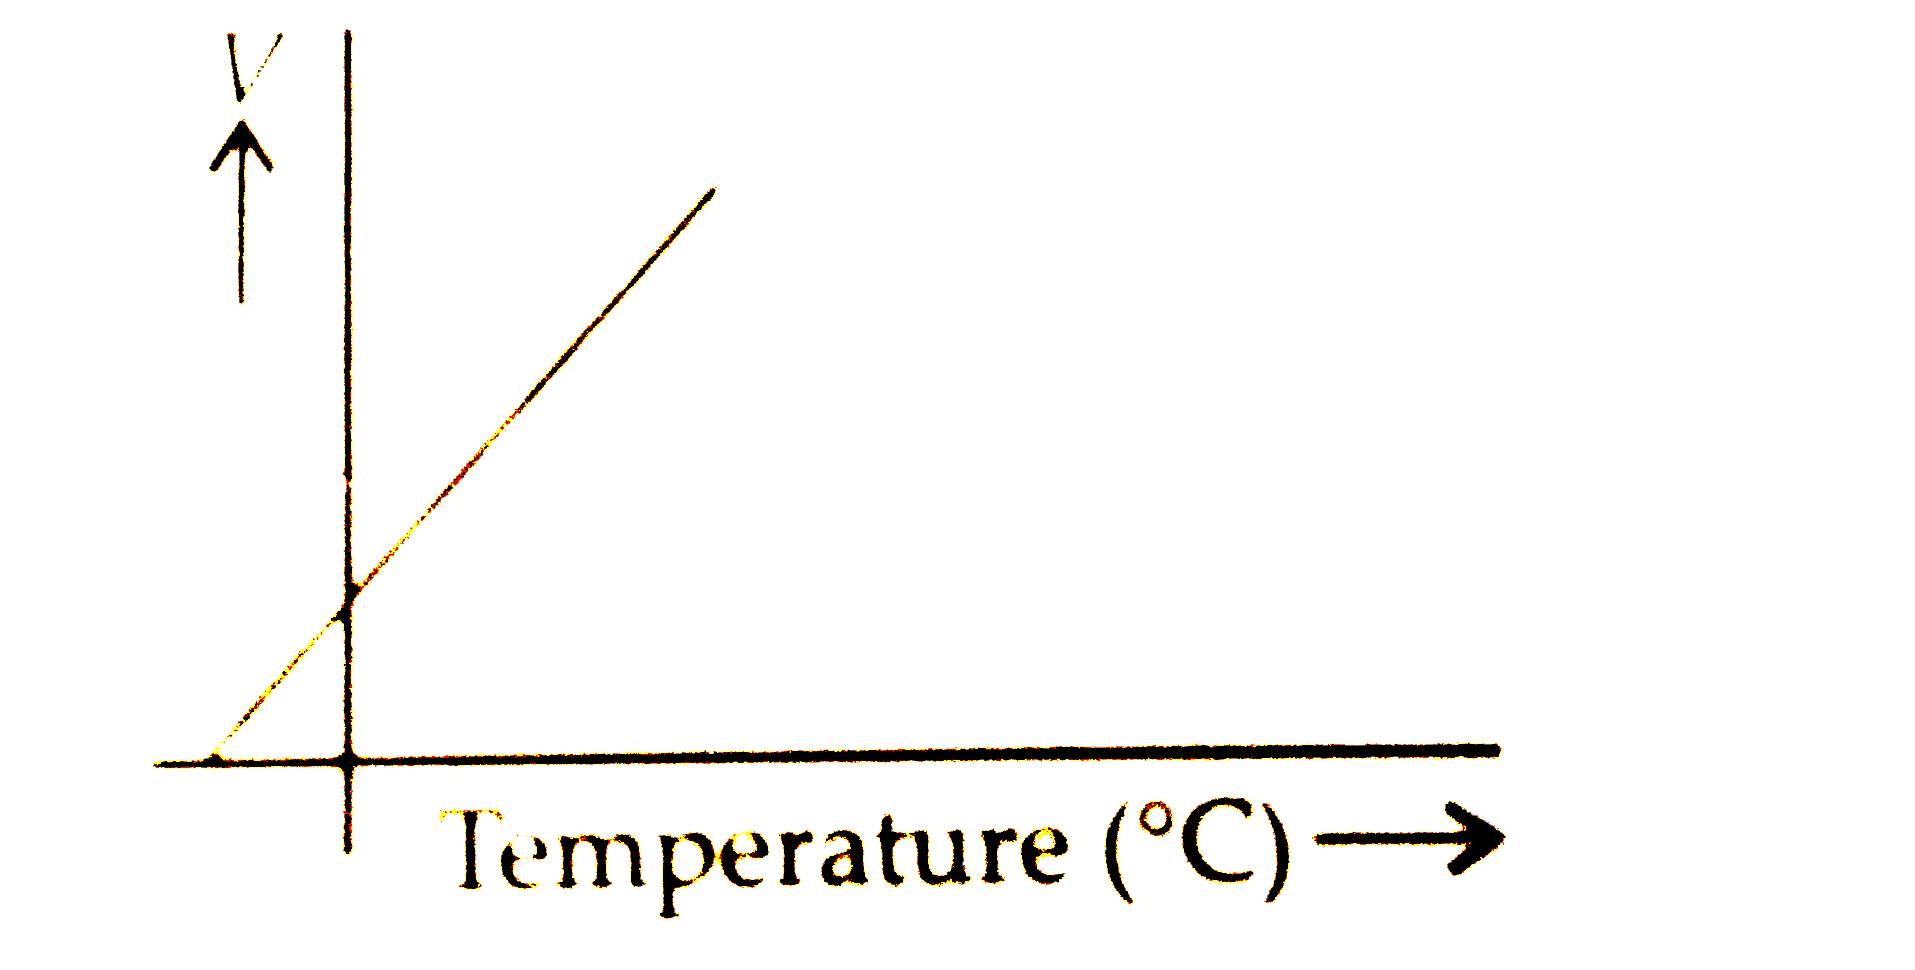
The following graphs illustrate:
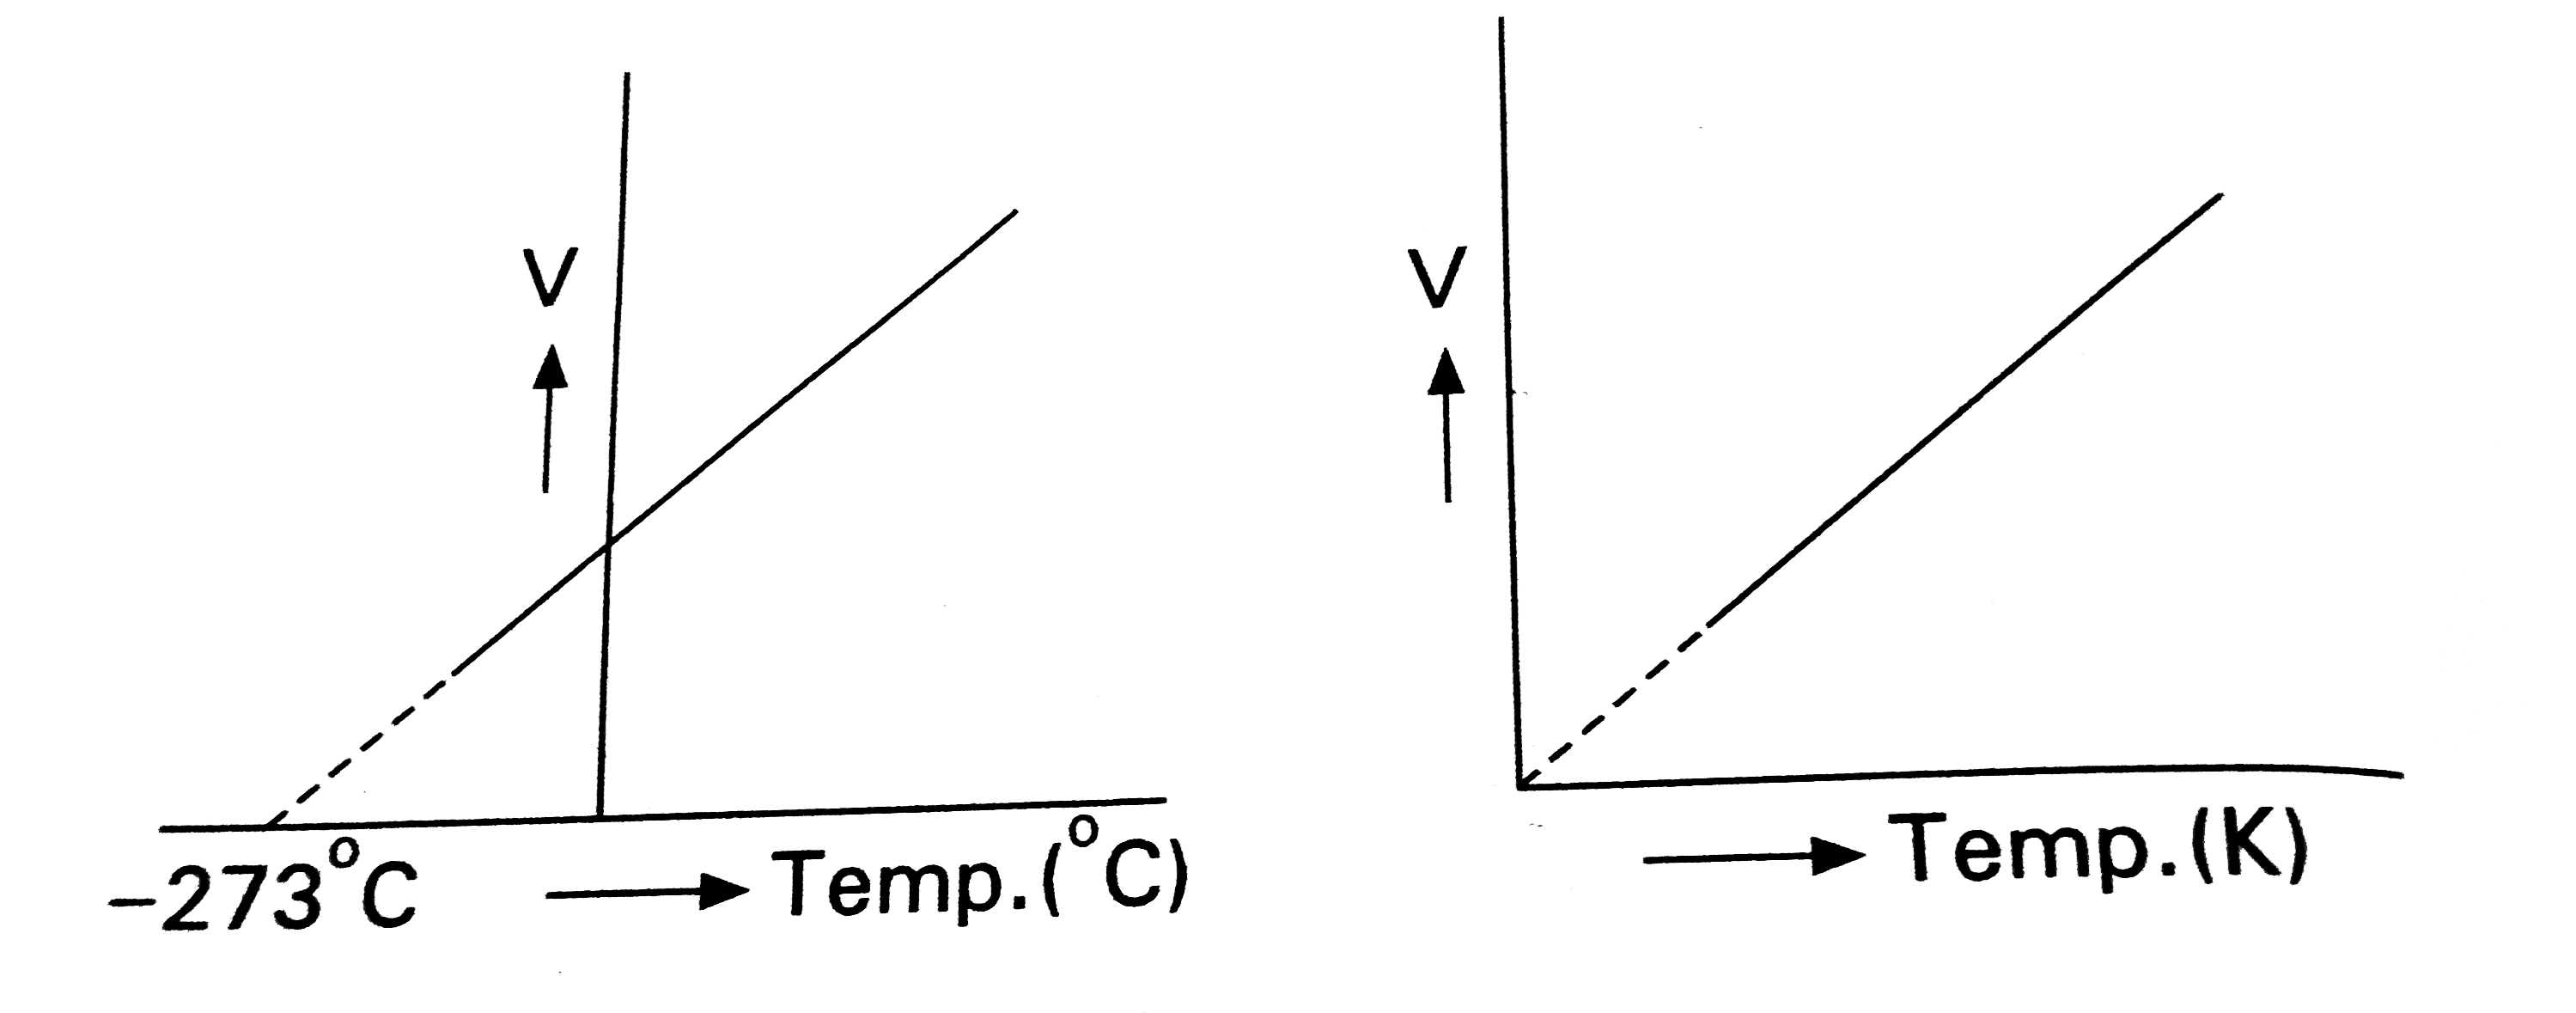 ADalton's lawBCharles's lawCBoyle's lawDGay-Lussac's law
The following graph illustrates
 ADalton's lawBCharles' lawCBoyle's lawDGay-Lussac's law
Which of the following graphs best represents the motion of a raindrop?
A B
B C
C D
D
Which of the following best illustrates feedback in development ?
View SolutionWhich of the following graphs best represents the variation of acceleration 'a' with displacement x?
View SolutionWhich of the following best illustrates feedback in development ?
View SolutionWhich of the following graphs best represents the variation of acceleration 'a' with displacement x?
View SolutionWhich of the following graphs represents the variation of activity (A) of a radioactive substance with time (t).
View Solution


