The graph of PV vs P for a gas is
parabolic
hyperbolic
a straight line parallel to X-axis
a straight line passing through origin
Step by step video solution for The graph of PV vs P for a gas is by Chemistry experts to help you in doubts & scoring excellent marks in Class 9 exams.
Updated on:21/07/2023Similar Questions
Knowledge Check
Assertion : At constant temperature PV vs P plot for real gases is not a straight line .
Reason : In the curves of dihydrogen and helium , as the pressure increases the value of PV also increases .AIf both assertion and reason are true and reason is the correct explanation of assertion .BIf both assertion and reason are true but reason is not the correct explanation of assertion .CIf assertion is true but reason is false .DIf both assertion and reason are false .
The graph between PV vs P at constant temperature is linear parallel to the pressure axis.
View SolutionThe plot of PV vs P at particular temperature is called isovbar.
View SolutionAssertion :− At constant temperature PV vs V plot for real gas is not a straight line.
Reason :− At high pressure, all gases have Z>1 but at low pressure most gases have Z<1
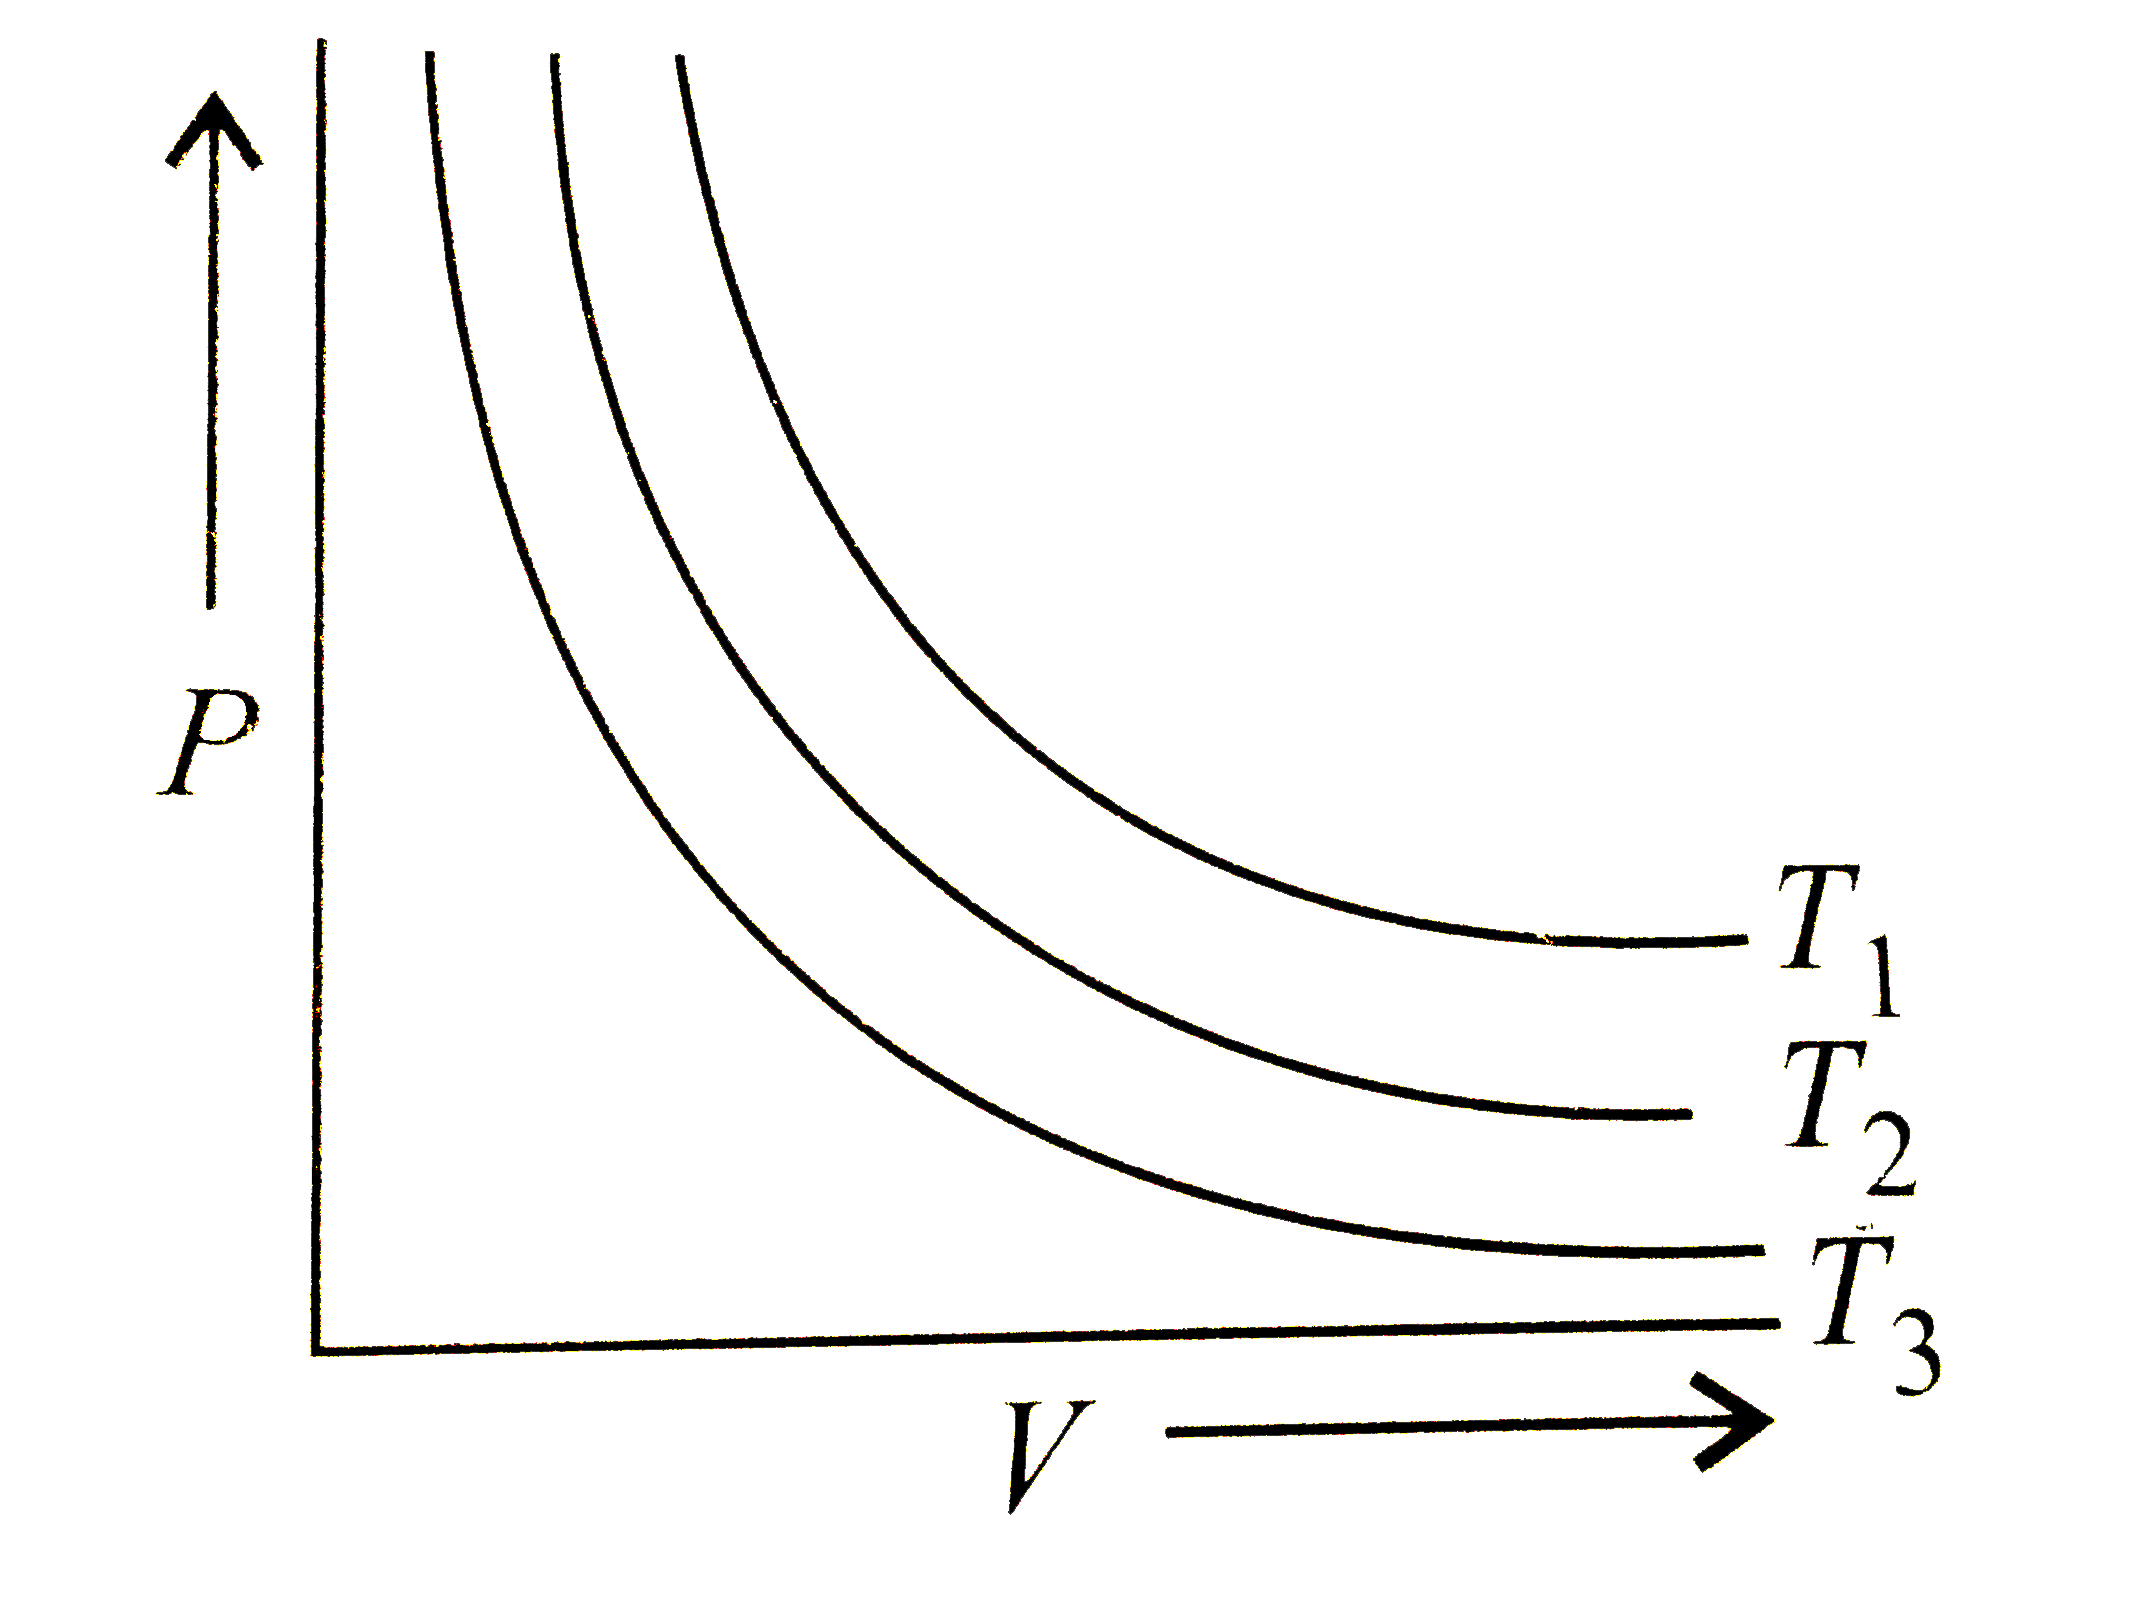
View SolutionDraw a graph of log P vs log (1/V) for a fixed amount of a gas at constant temperature.
View SolutionFor an adiabatic process graph between PV & V for a sample of ideal gas will be
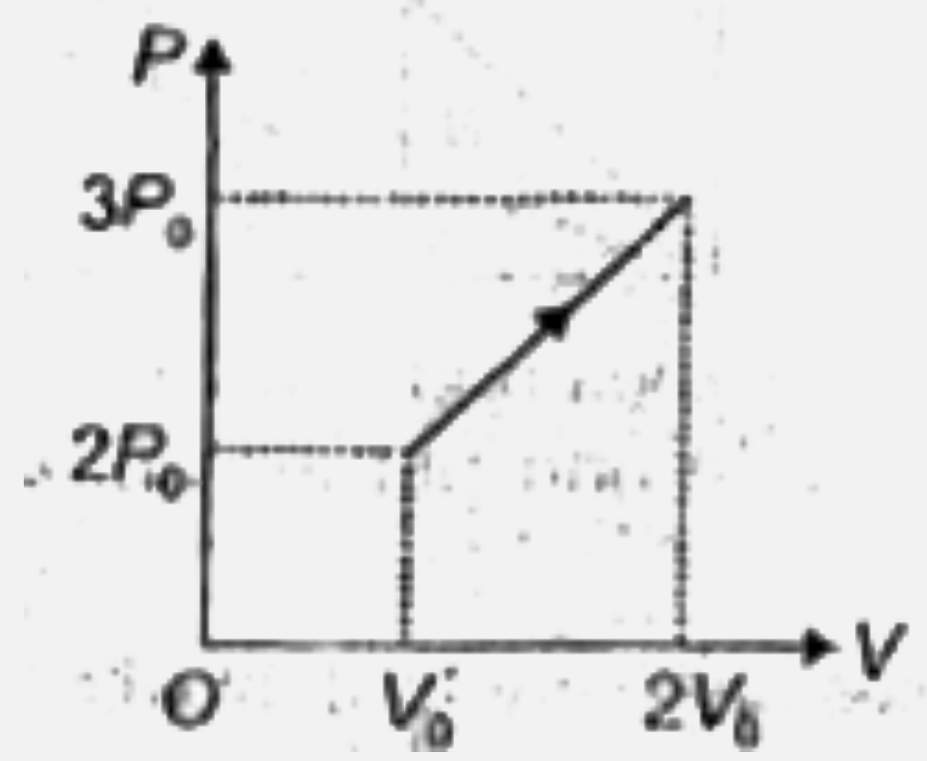
View SolutionThe PV-graph for a monatomic gas is shown in figure. Find the energy absorbed by the gas during this process.

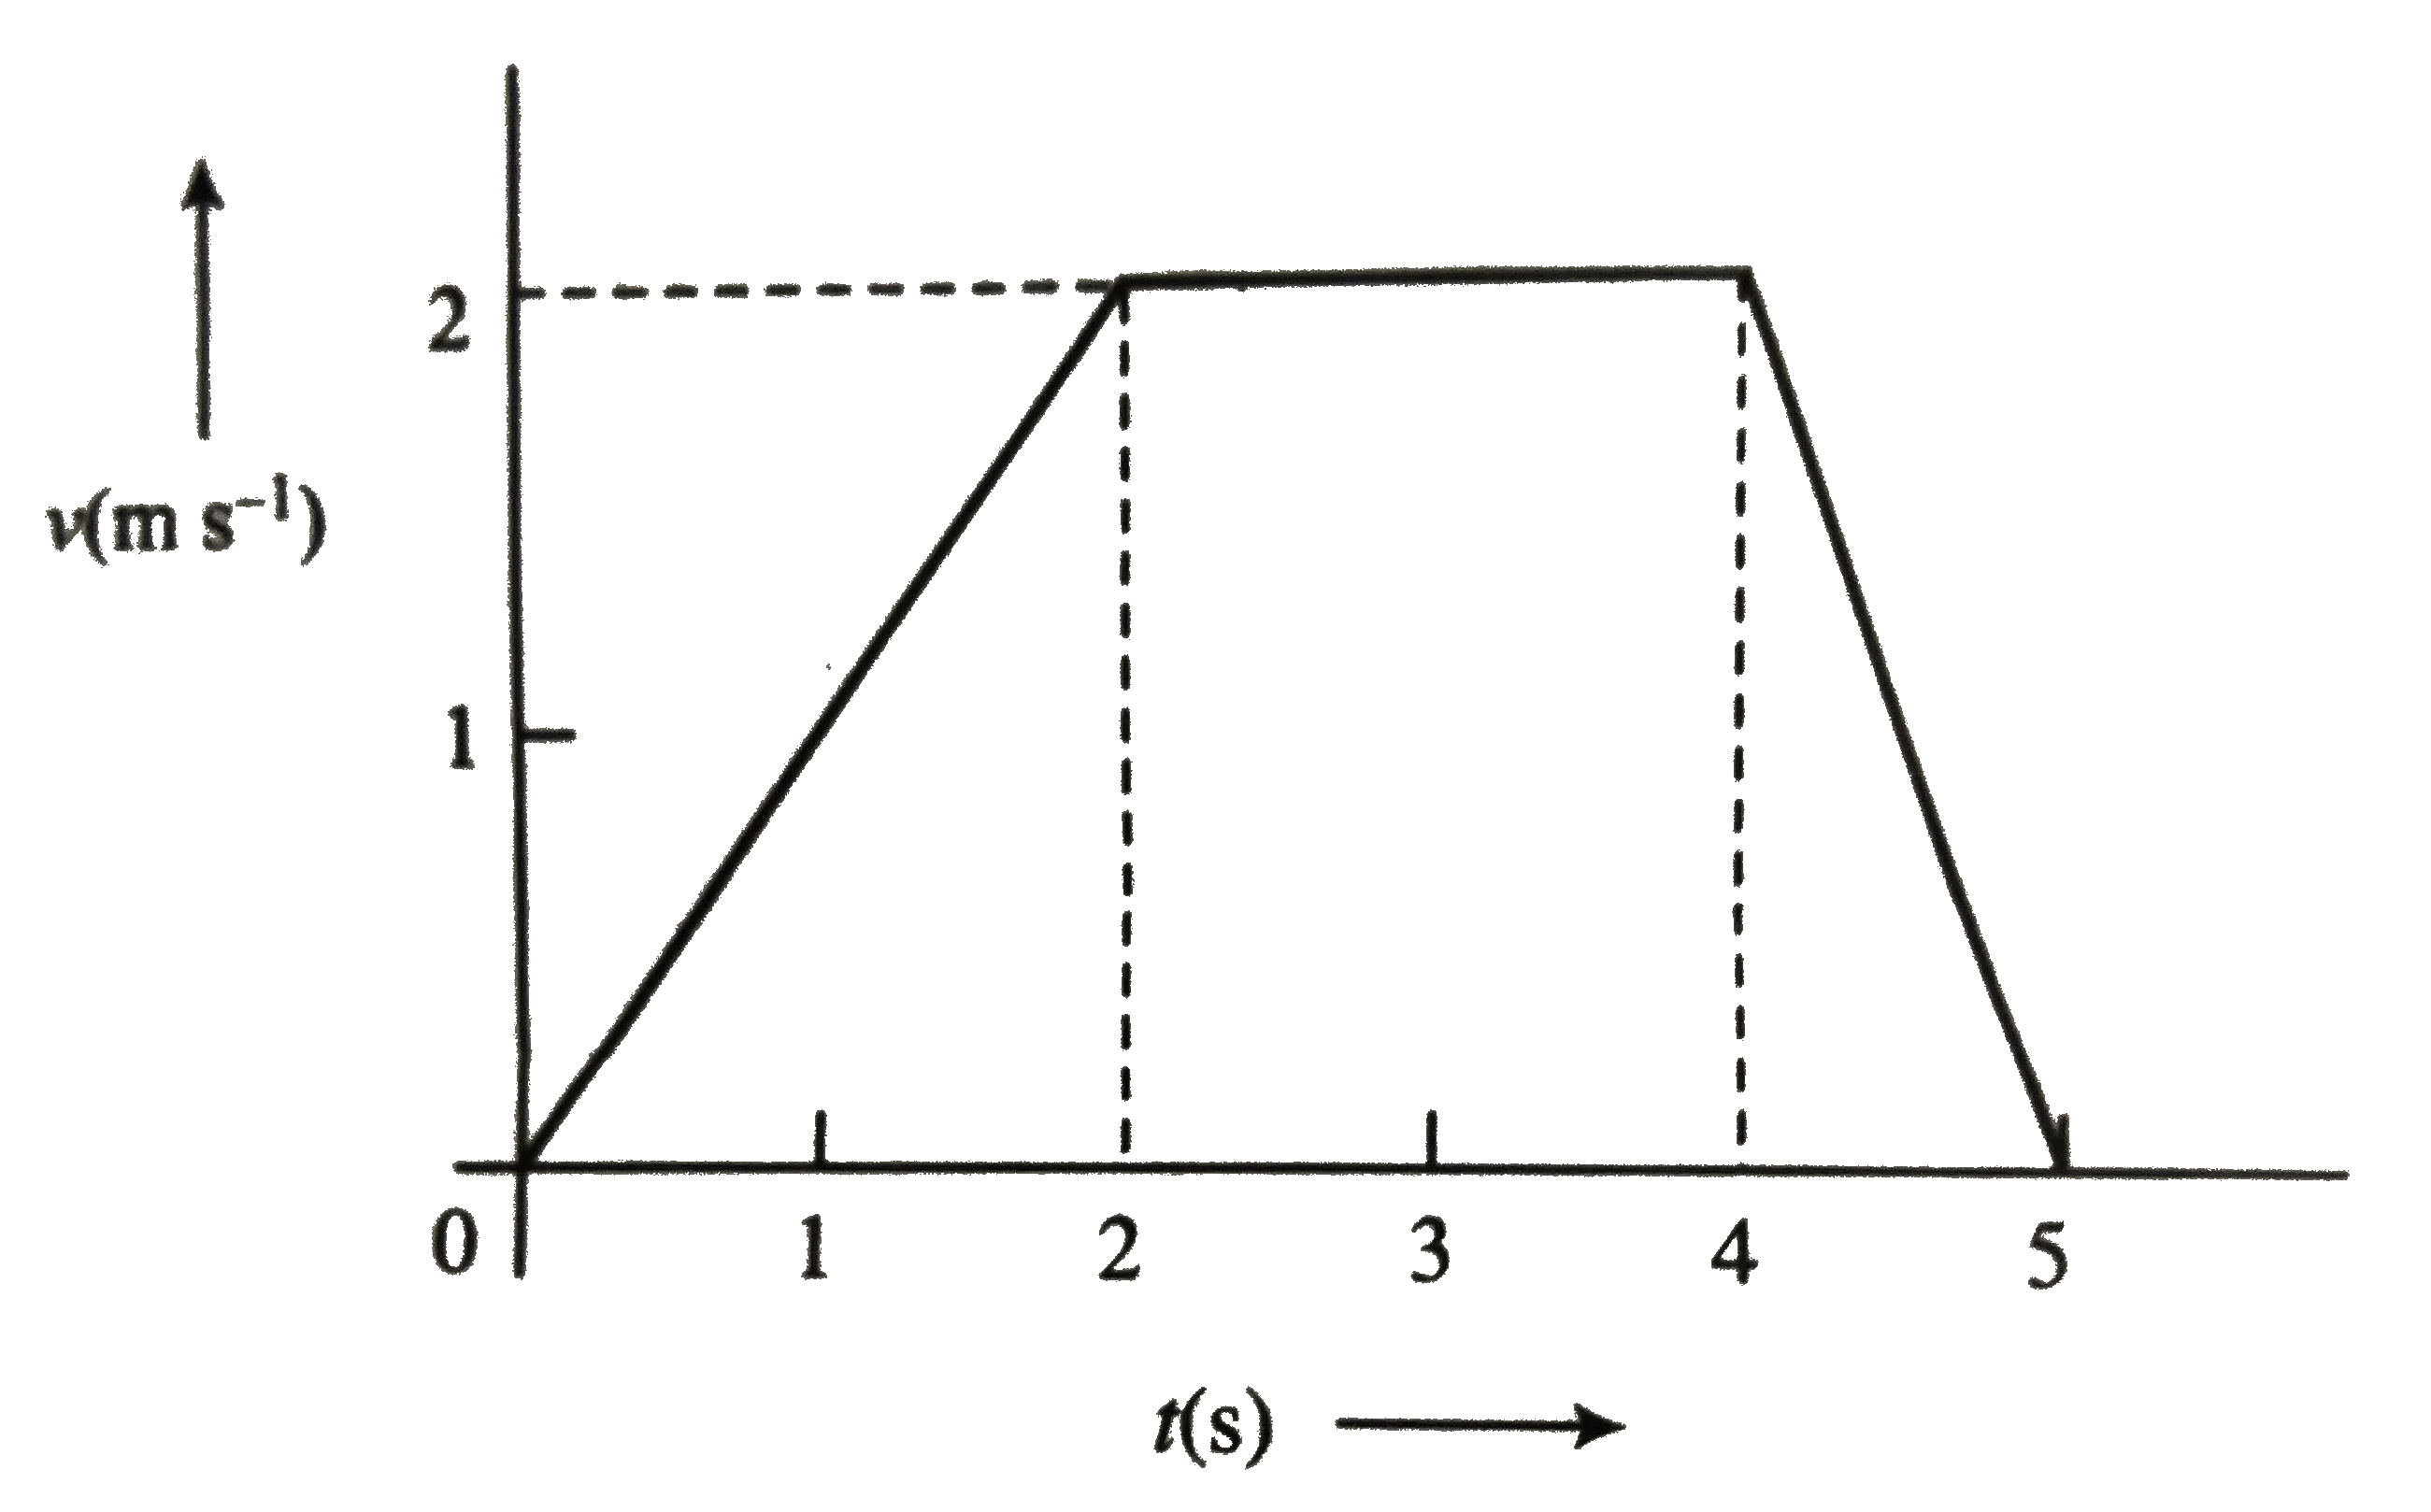
View SolutionStarting at x=0, a particle moves according to the graph of v vs t shown in . Sketch a staph of the instantaneoud acceleration a vs t, indicationg numerical values at significant points of the graph.
 .
.
View Solution


