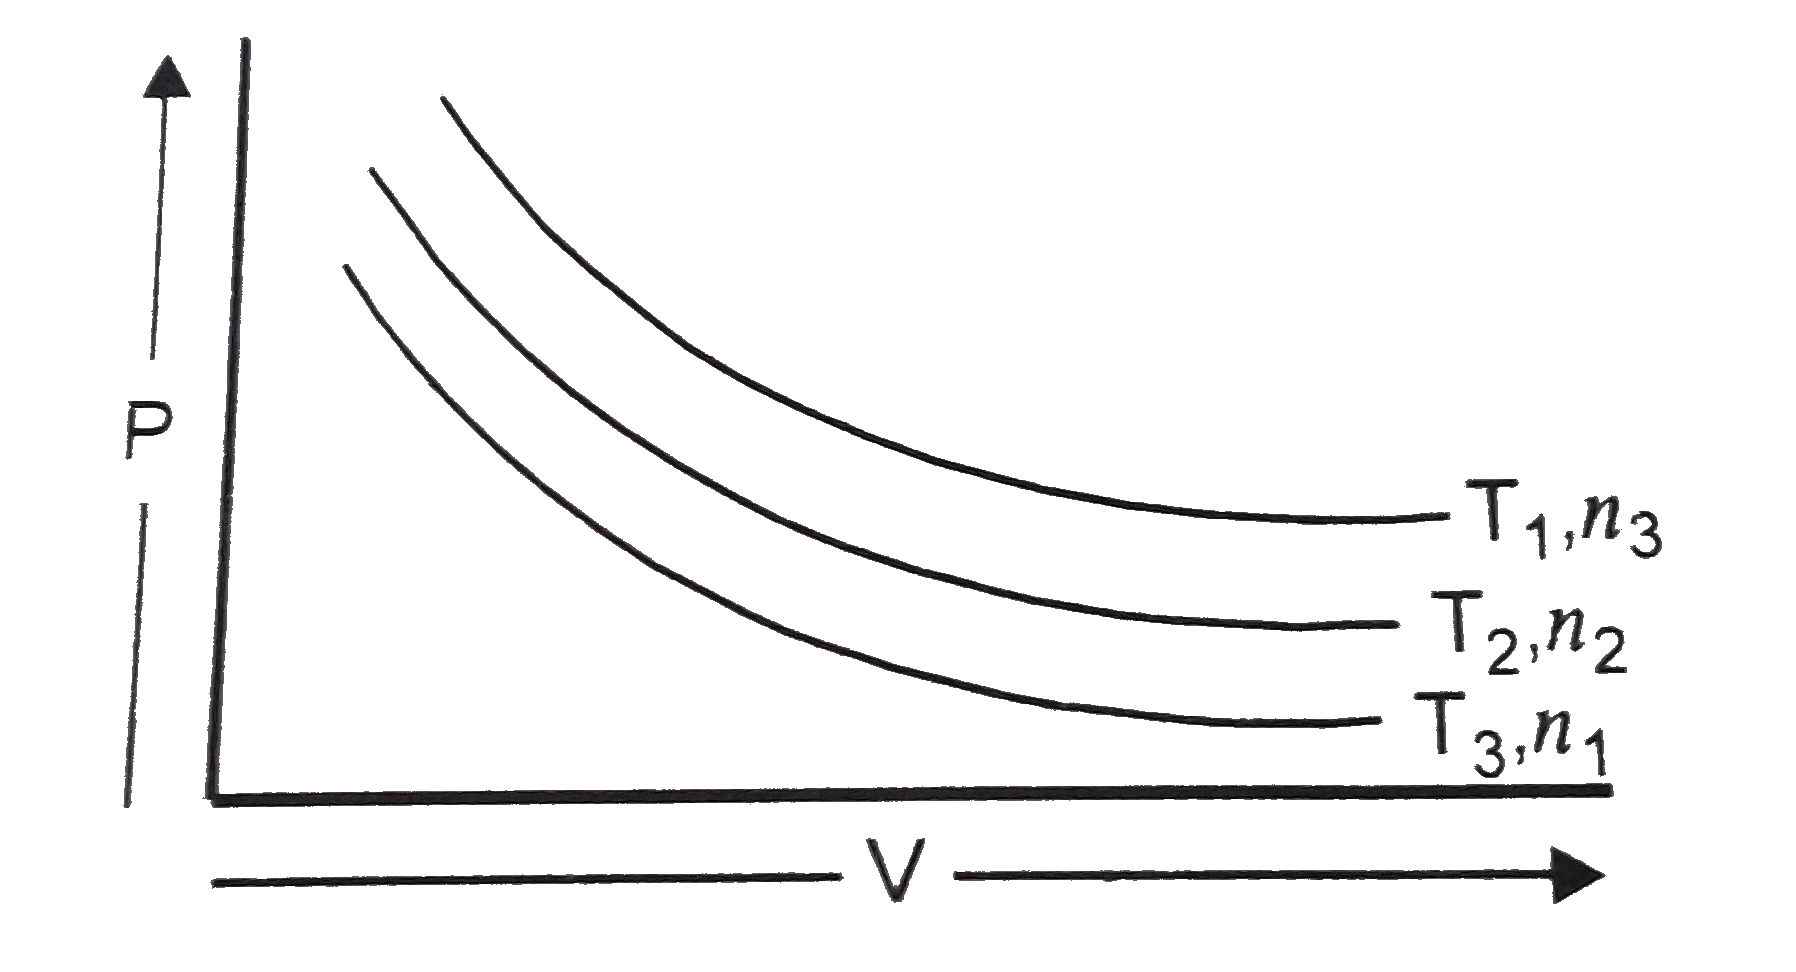
The graph of P vs V is given at temperature and number of moles :

The correct relationship is/are
A
T1>T2>T3
B
T1<T2<T3
C
n1>n2>n3
D
n3>n2>n1
Video Solution
Text Solution
The correct Answer is:A, D
Both relationships are correct.
|
Similar Questions
Knowledge Check
The graph of PV vs P for a gas is
AparabolicBhyperbolicCa straight line parallel to X-axisDa straight line passing through originVolume : Temperature relationship is given by
ABoyleBGay LussacCDaltonDCharles
The graph between PV vs P at constant temperature is linear parallel to the pressure axis.
View SolutionThe plot of PV vs P at particular temperature is called isovbar.
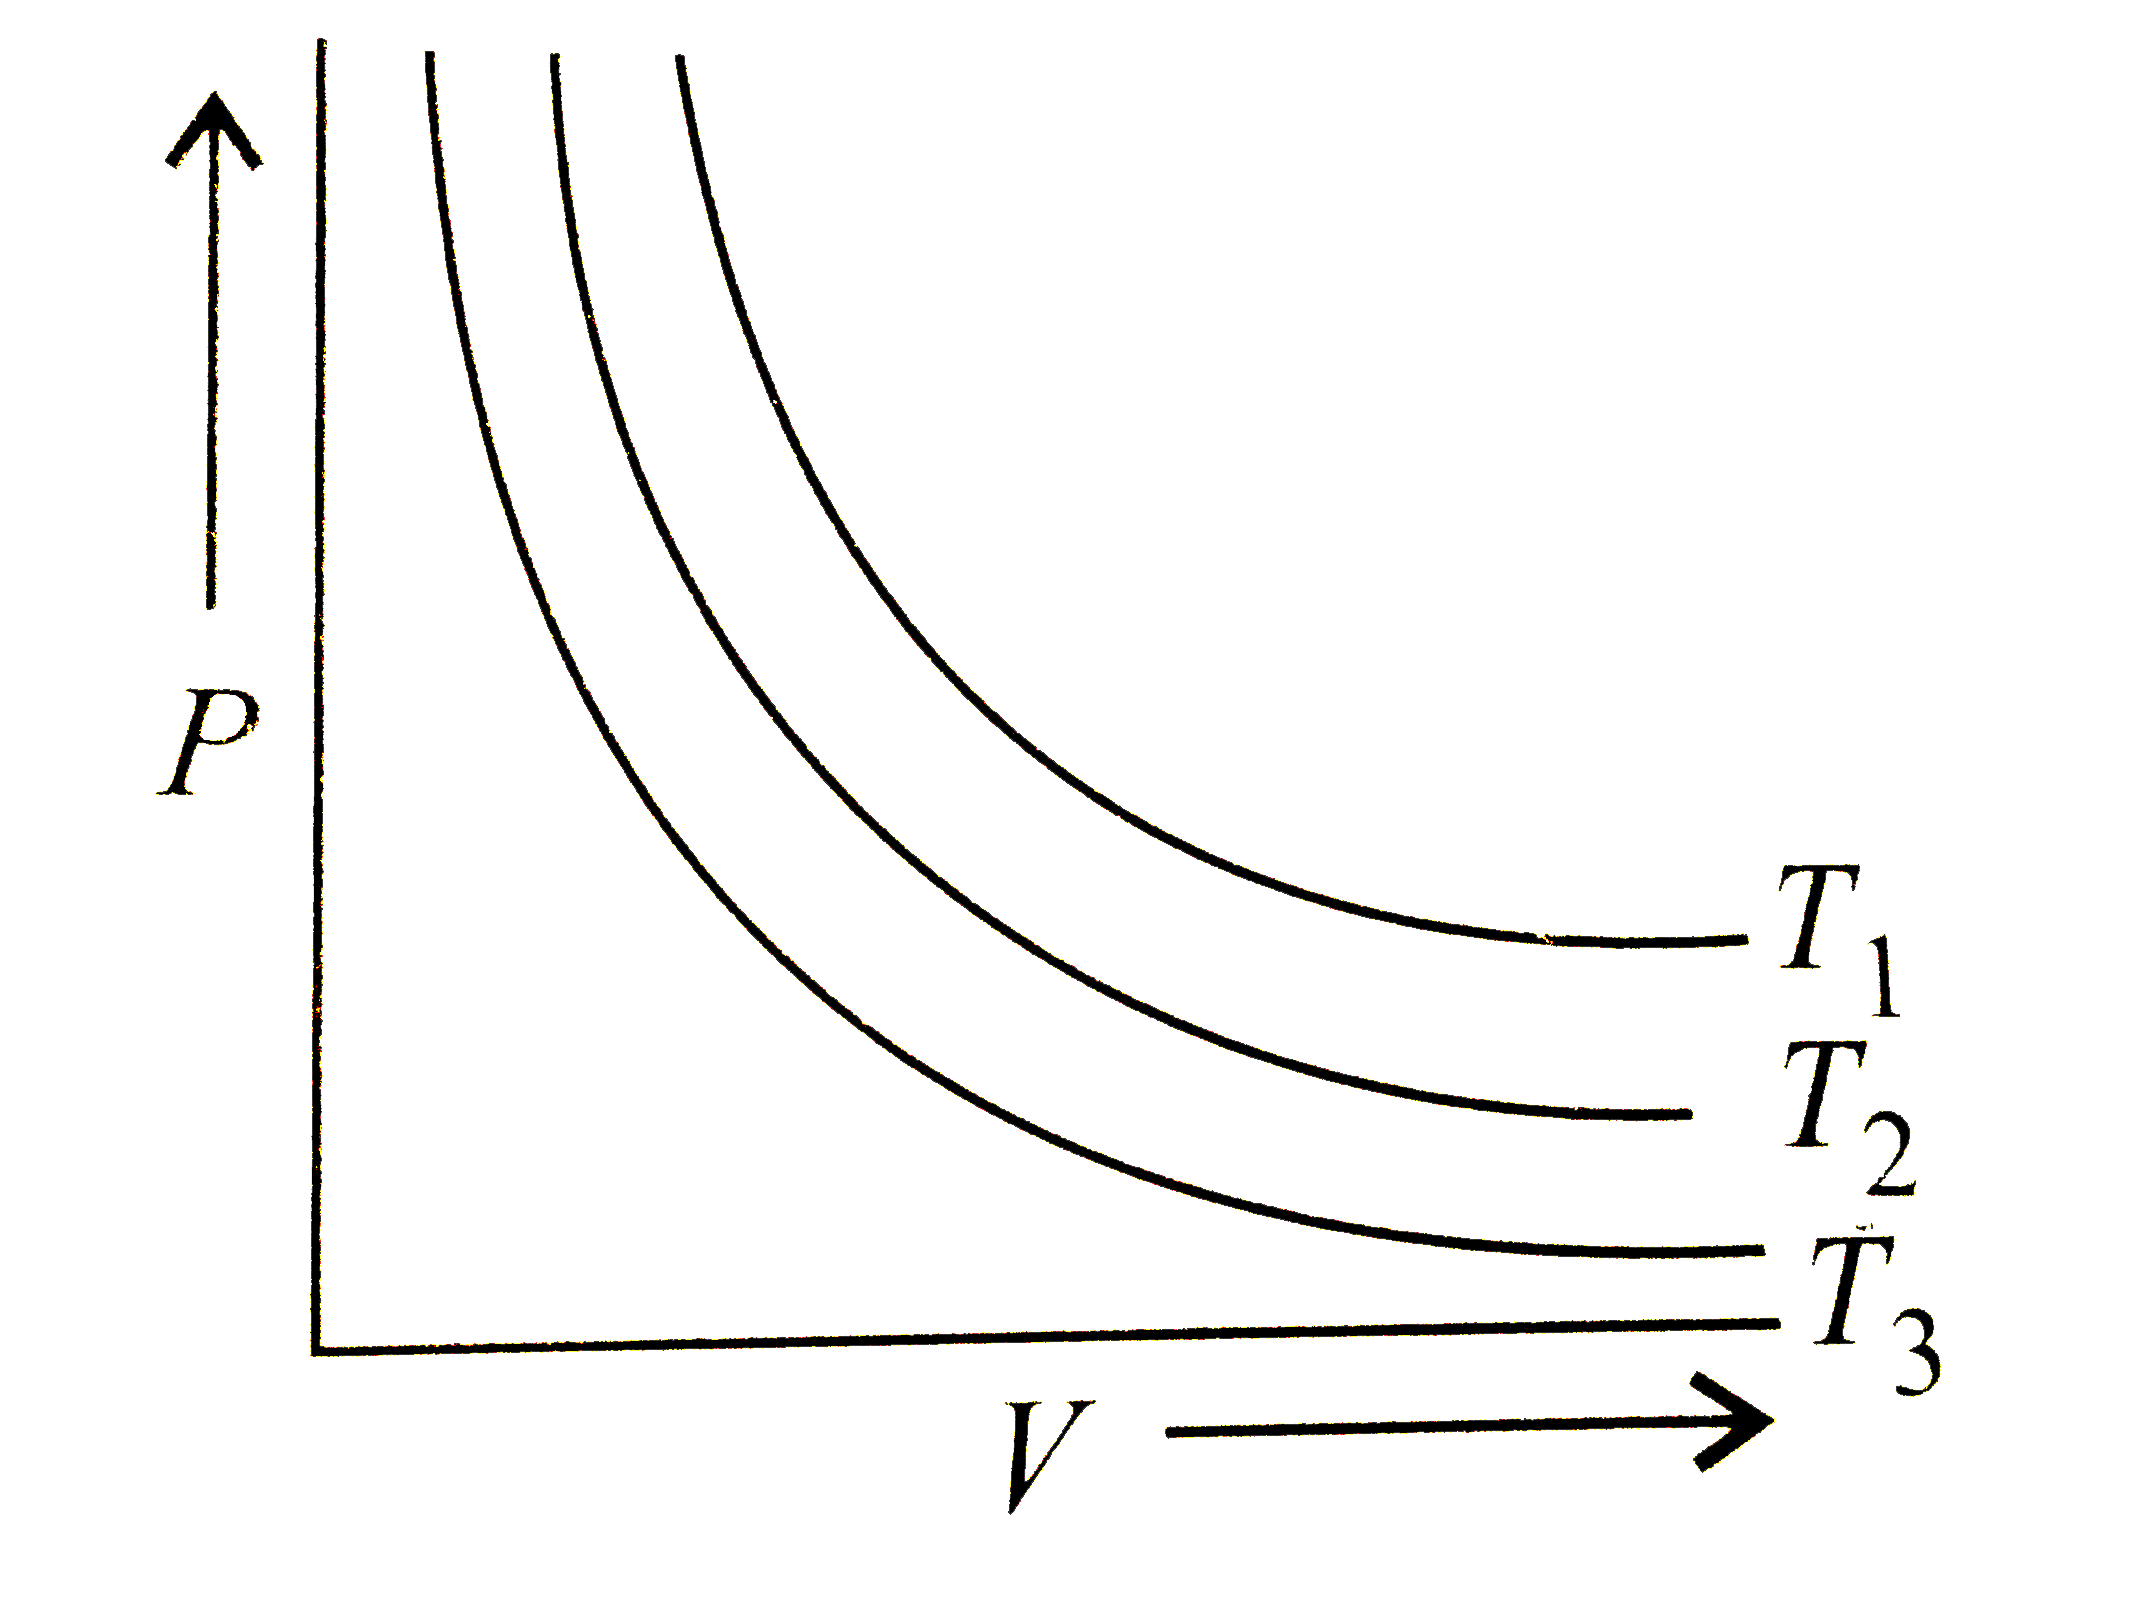
View SolutionThe correct graph and values of temperature in them is given as

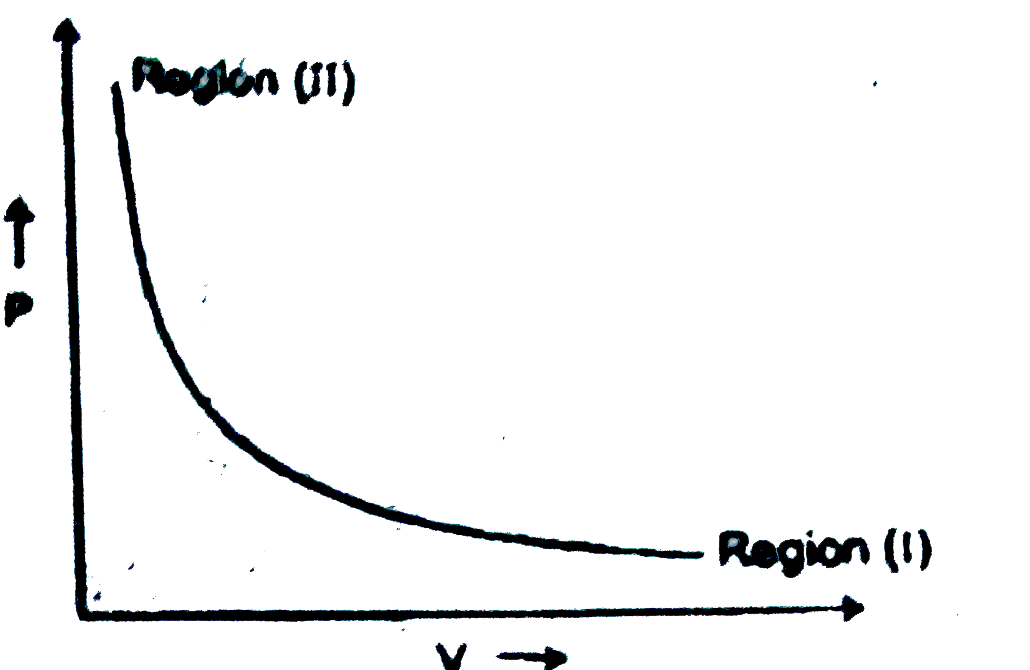
View SolutionFollowing graph represents a pressure (P) volume (V) relationship at a fixed temperature (T) for n moles of a real gas. The graph has two regions marked (I) and (II). Which of the following options is true.

View SolutionFollowing graph represents a pressure (P) volume (V) relationship at a fixed temperature (T) for n moles of a real gas. The graph has two regions marked (I) and (II). Which of the following options is true.
View SolutionGraphs: s vs t, v vs t and a vs t
View Solution

