The graphs representing distribution of molecular speeds at 300 K for gases CI2 and N2 are as show in figure :
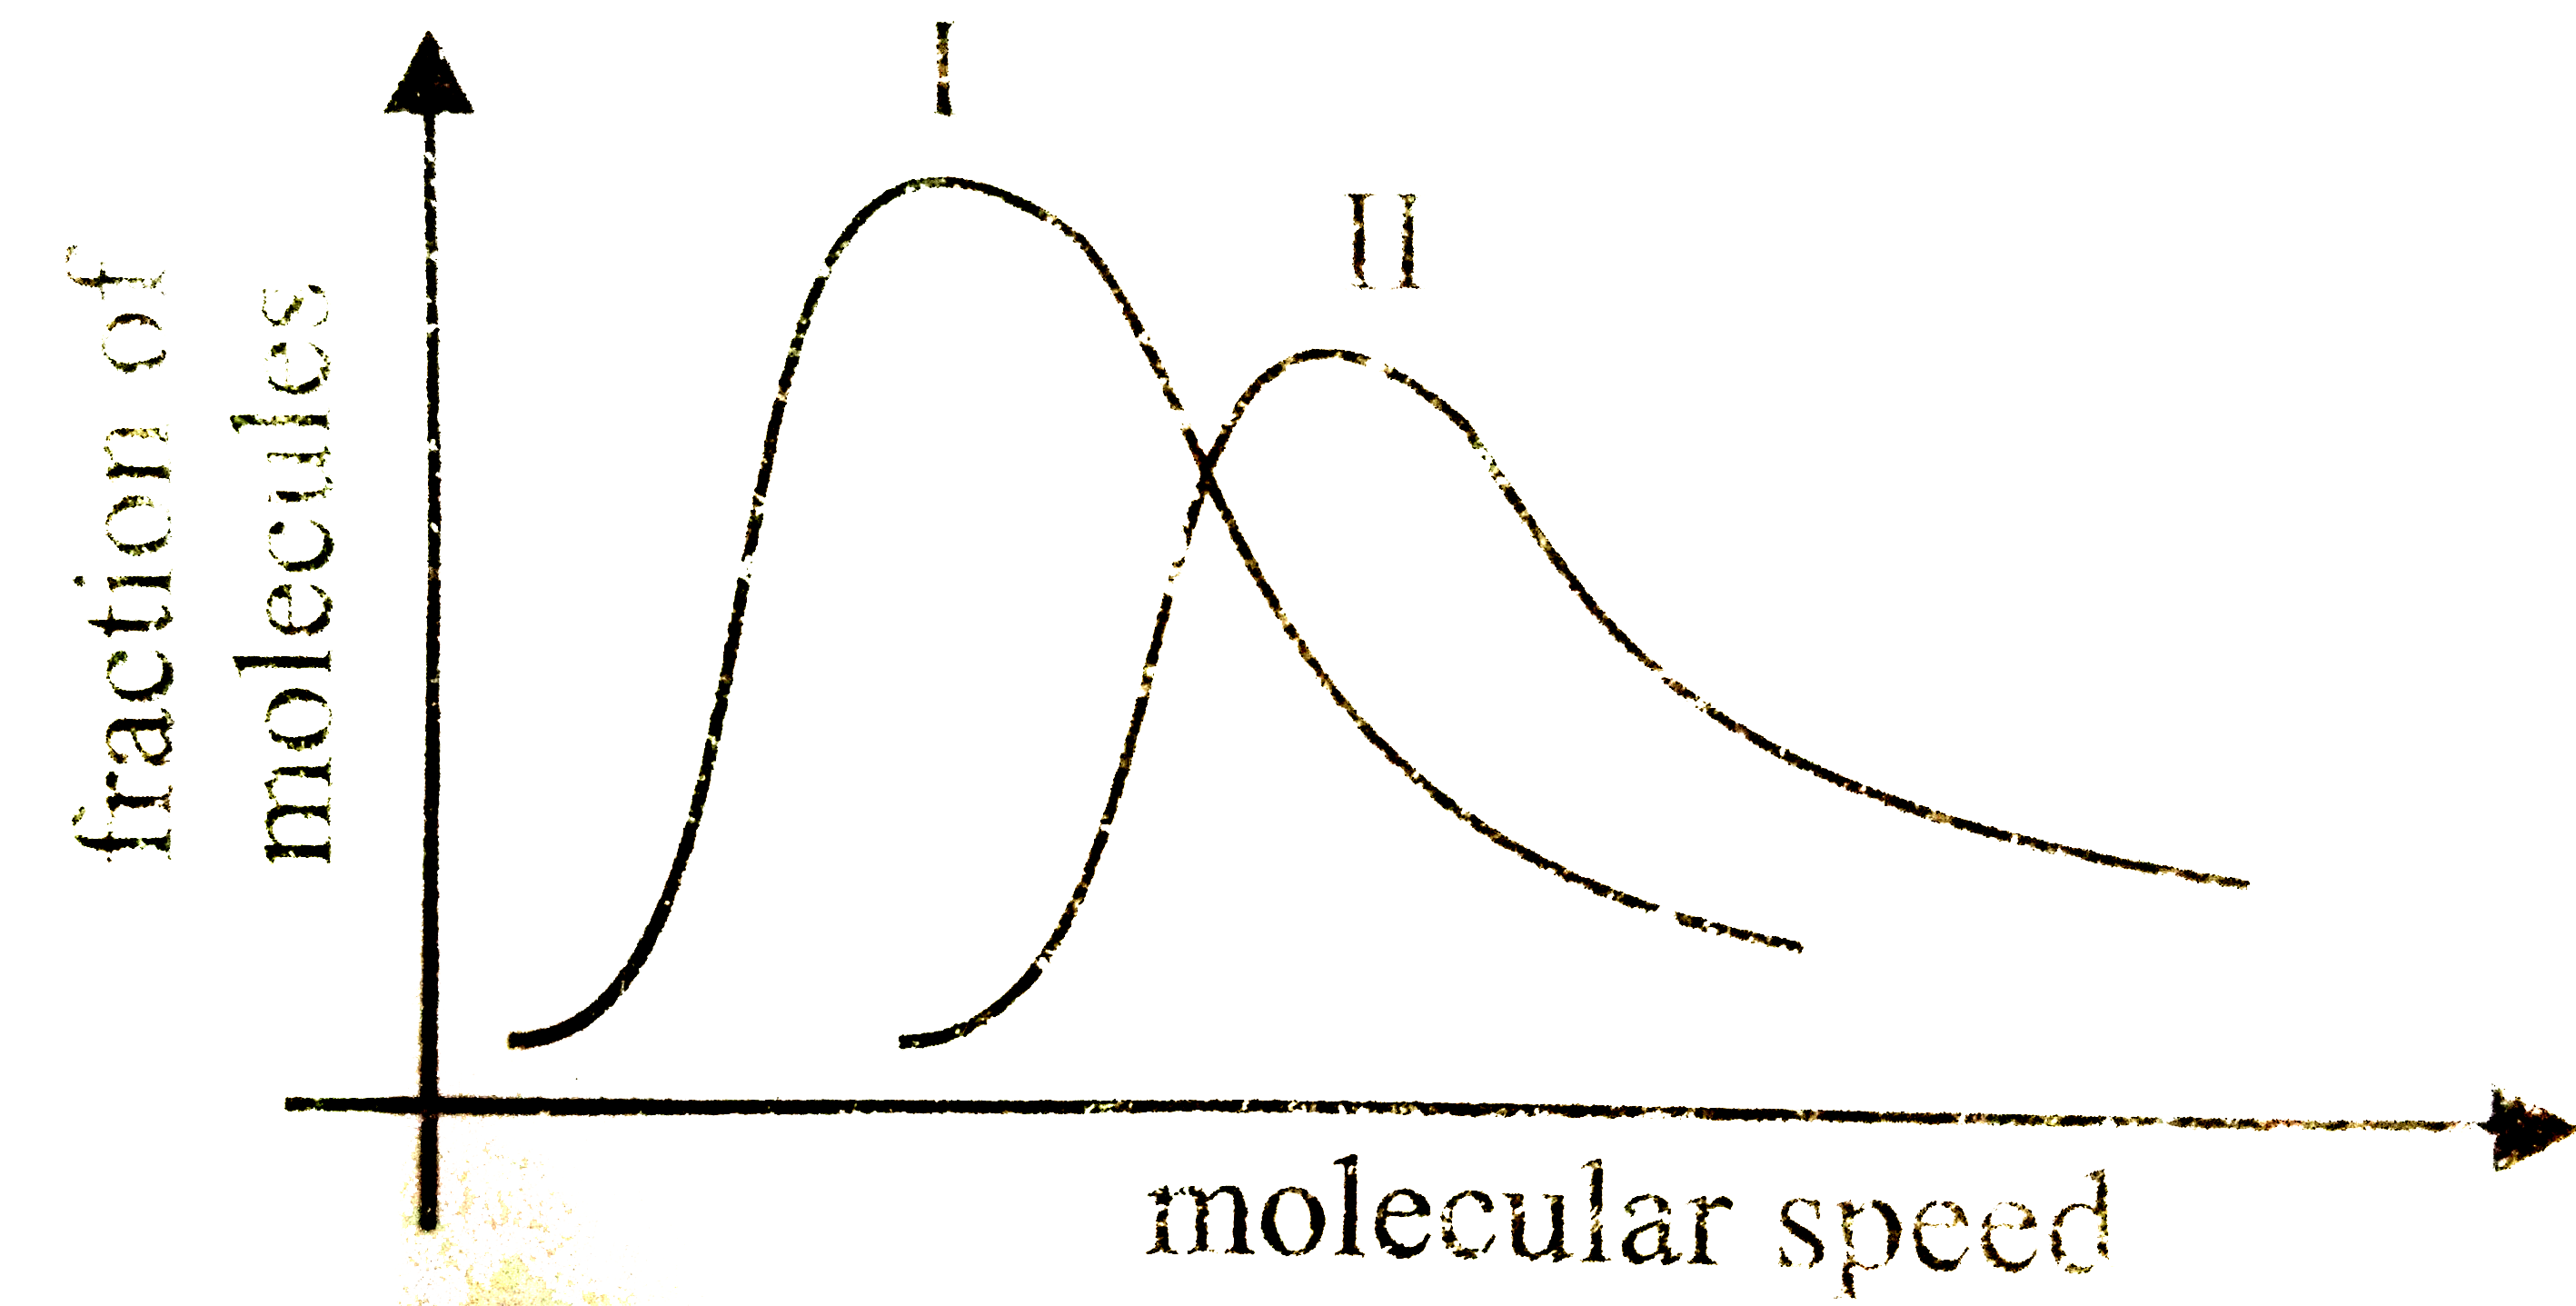
Select the correct option .
I graph is for
N
2
all II is for
C
I
2
II graph is for
N
2
and I is for
C
I
2
Either graph can be taken for
N
2
or
C
I
2
Information is not sufficient .
I graph is for N2 all II is for CI2
II graph is for N2 and I is for CI2
Either graph can be taken for N2 or CI2
Information is not sufficient .
The correct Answer is:B
Molecular weight of Cl2 is more than molecular weight of N2.
Topper's Solved these Questions
- STATES OF MATTER BOOK - NCERT FINGERTPS ENGLISHCHAPTER - STATES OF MATTER EXERCISE - Kinetic Molecular Theory Of Gases
4 Videos
- STATES OF MATTER BOOK - NCERT FINGERTPS ENGLISHCHAPTER - STATES OF MATTER EXERCISE - Behaviour Of Real Gases
15 Videos
- STATES OF MATTER BOOK - NCERT FINGERTPS ENGLISHCHAPTER - STATES OF MATTER EXERCISE - Ideal Gas Equation
33 Videos
- SOME BASIC CONCEPTS OF CHEMISTRY BOOK - NCERT FINGERTPS ENGLISHCHAPTER - SOME BASIC CONCEPTS OF CHEMISTRY EXERCISE - NCERT Exemplar
11 Videos
- STRUCTURE OF ATOM BOOK - NCERT FINGERTPS ENGLISHCHAPTER - STRUCTURE OF ATOM EXERCISE - Assertion And Reason
15 Videos
Similar Questions
If average molecular mass of air is 29, then assuming N2 and O2 gases are there, which option are correct regarding composition of are?
(i)75%by mass ofN2 (ii)75%by moles N2 (iii)72.41%by mass ofN2
View SolutionIf average molecular mass of air is 29, then assuming N2 and O2 gases are there, which option are correct regarding composition of are?
(i)75%by mass of N2(ii)75% "by moles of N2 (iii)72.41%bymassofN_(2)
View Solution
Knowledge Check
Which of the following represents the correct graph for SN2 reaction ?
A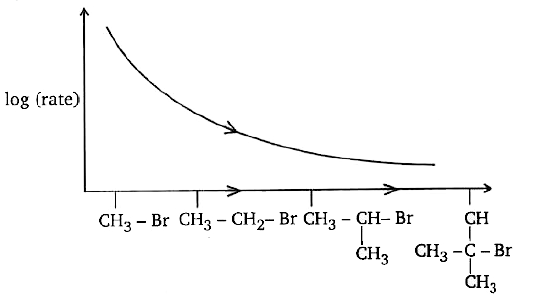 B
B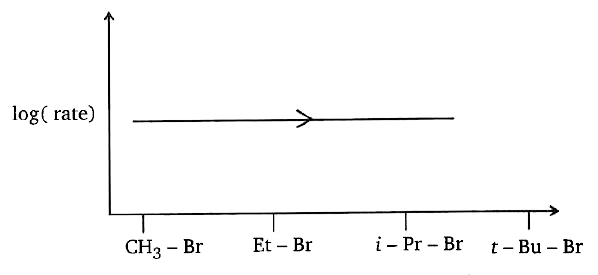 C
C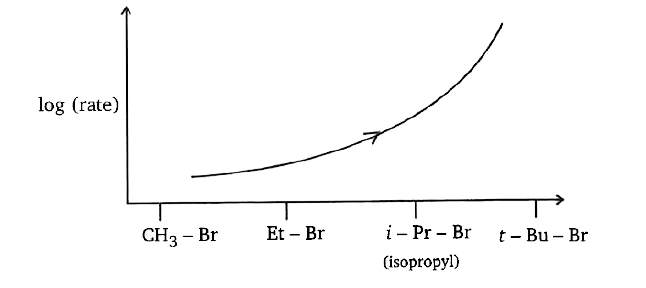 D
D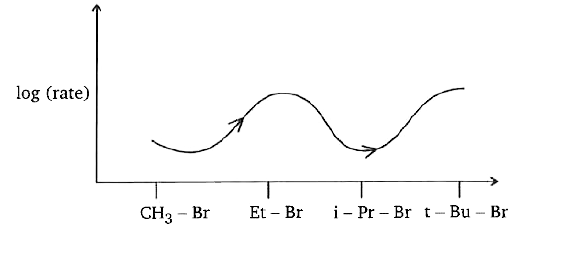
Given graph represents the response of organisms to various abiotic factors. On this basis, select the correct option for (i), (ii) and(iii)
 A(i)(ii)(iii).ConformersRegulatorsPartial regulatorsB(i)(ii)(iii).RegulatorsPartial regulatorsConformersC(i)(ii)(iii).Partial regulatorsRegulatorsConformersD(i)(ii)(iii).RegulatorsConformersPartial regulators
If 2n=4, then identify the figures A,B and C, as per the following codes and select the correct option
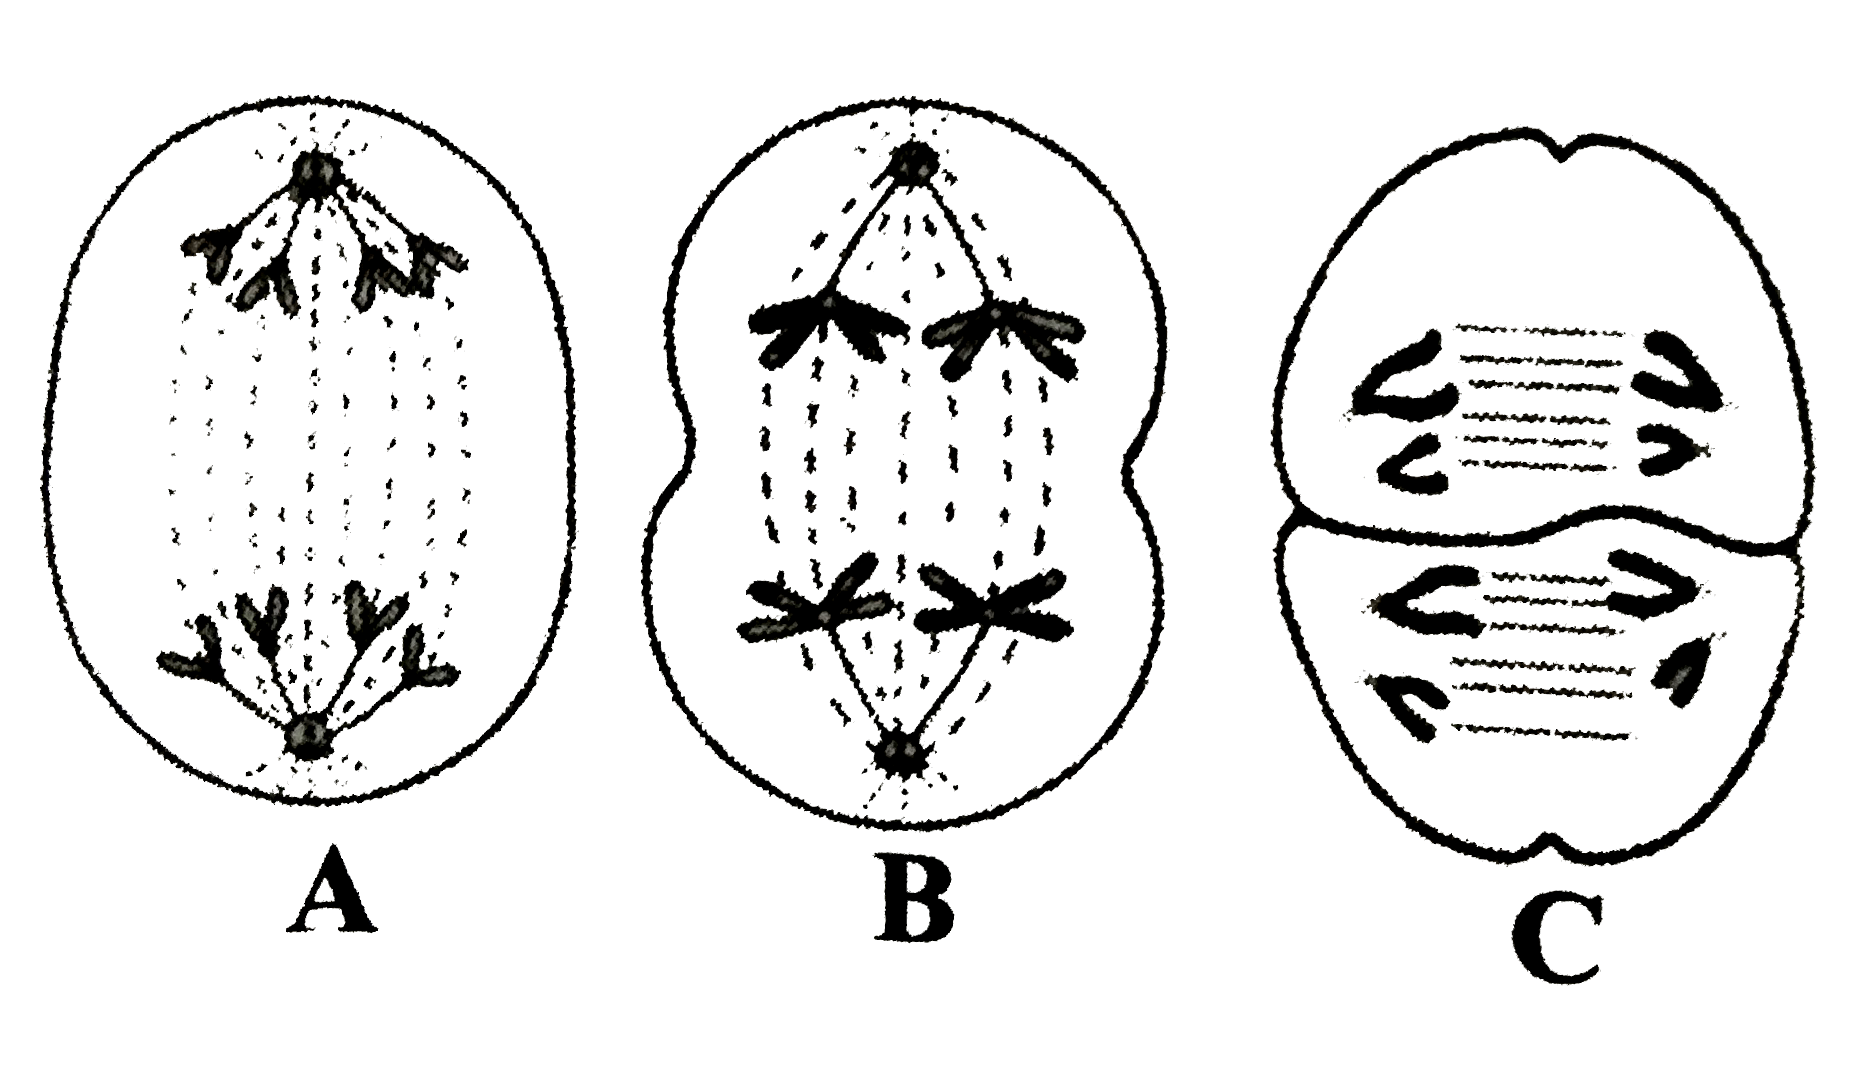
Anaphase of meiosis I=(i)
Anaphase of mitosis =(ii)
Anaphase meiosis II =(iii)Aii,i,iiiBiii,ii,iv,iCi,ii,iiiDiii,i,ii
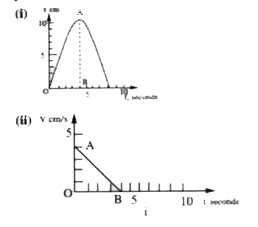
The graphs in (i) and (ii) show the S-t graph and V -t graph of a body. Are the motions shown in the graphs represented by OAB the same ?
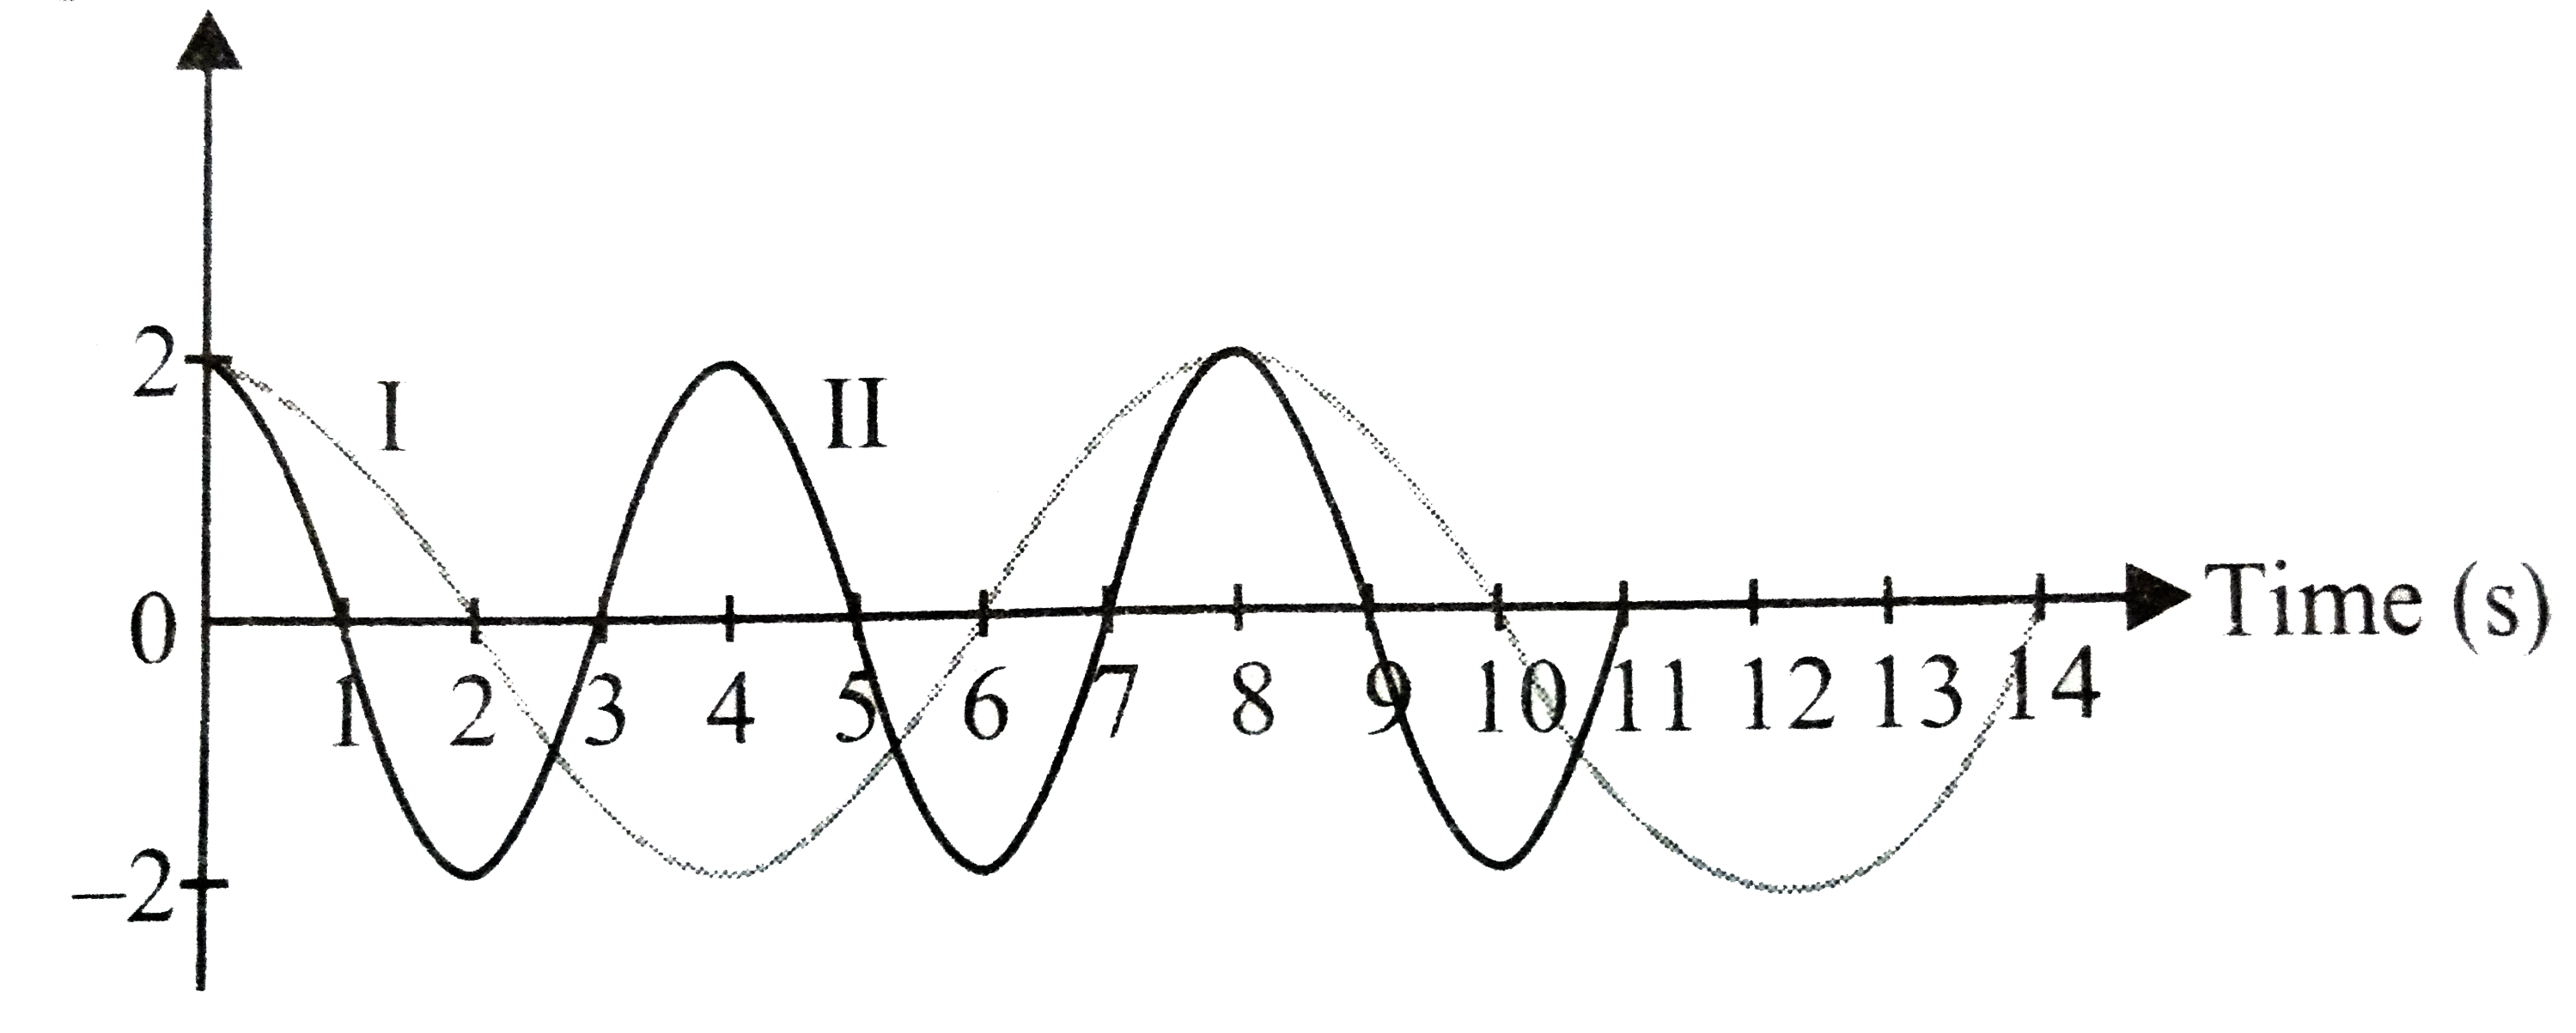
View SolutionFigure shows the displacement-time graphs of two simple harmonic motions I and II. From the graph it follows that
View SolutionConsider the following equilibrium
N2O4(g)⇔2NO2(g)
Then the select the correct graph , which shows the variation in concentrations of N2O4 against concentrations of NO2:
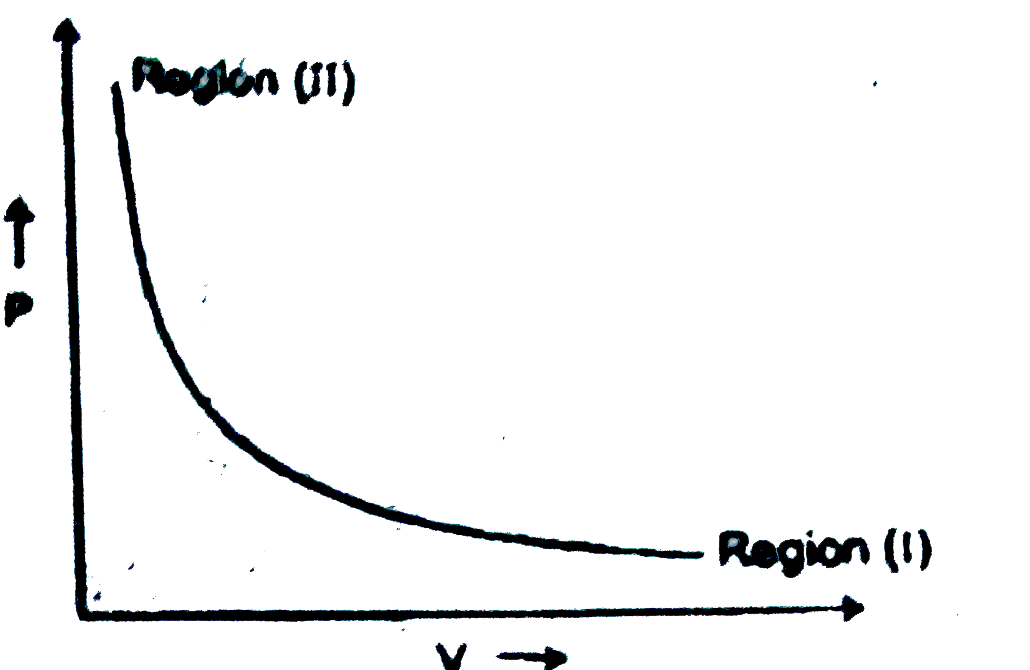
View SolutionFollowing graph represents a pressure (P) volume (V) relationship at a fixed temperature (T) for n moles of a real gas. The graph has two regions marked (I) and (II). Which of the following options is true.
View SolutionFollowing graph represents a pressure (P) volume (V) relationship at a fixed temperature (T) for n moles of a real gas. The graph has two regions marked (I) and (II). Which of the following options is true.
View Solution
