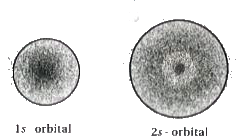
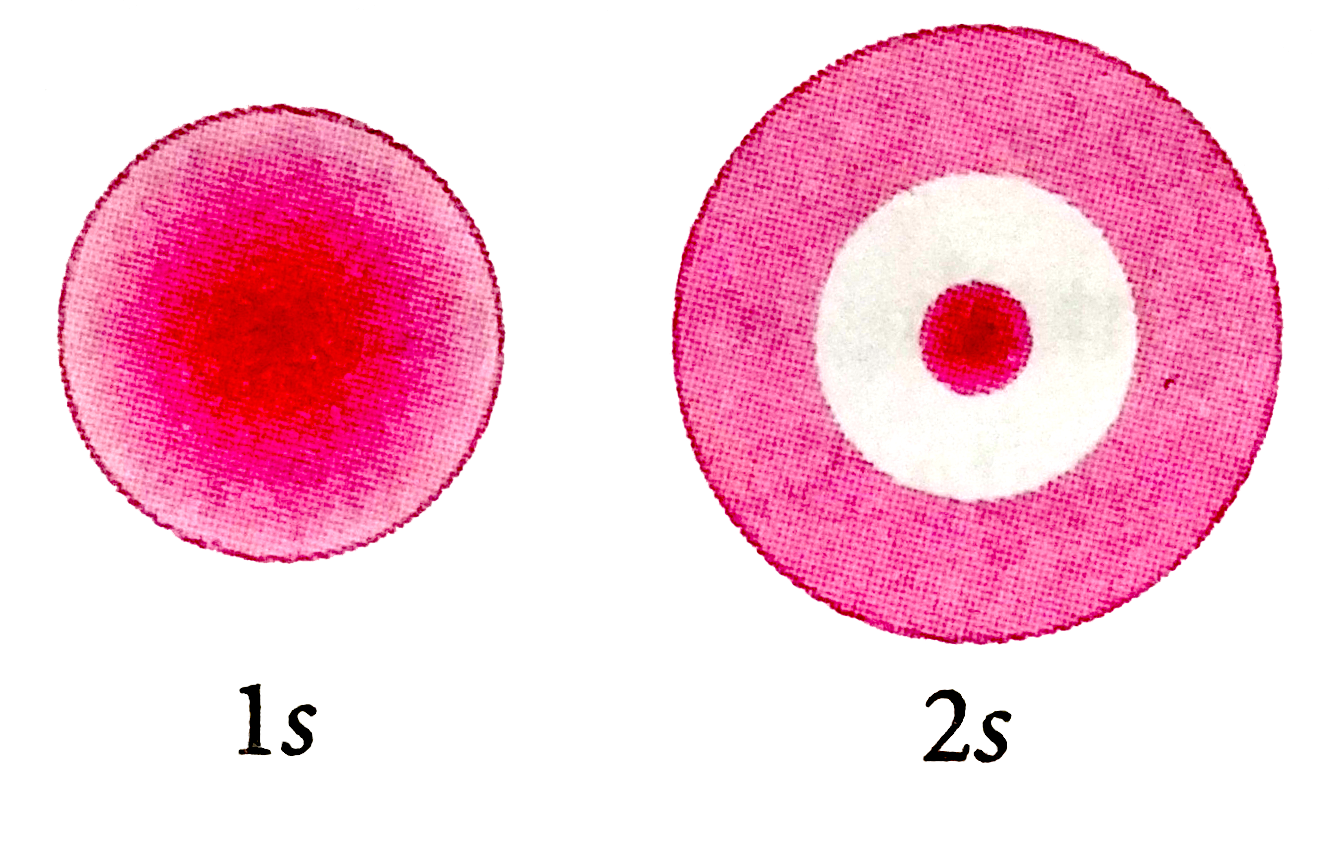
The probability density plots of Is and 2s orbitals are given in

The density of dots in a region represents the probability density of finding electrons in the region. On the basis of above diagram which of the following statements is incorrect Solution in Gujrati
Is and 2s orbitals are spherical in shape.
Is and 2s orbitals are spherical in shape.
The probability of finding the electron at a given distance is equal in all directions
The probability density of electrons for 2s orbital decreases uniformly as distance from the nucleus increases.
The probability density of electrons in 2s orbital first increases then decreases and after start to increases again as distance increases from nucleus.
Topper's Solved these Questions
- STRUCTURE OF ATOMBOOK - KUMAR PRAKASHANCHAPTER - STRUCTURE OF ATOMEXERCISE - QUESTINS PAPER FROM MODULE (SECTION -A)
6 Videos
- STRUCTURE OF ATOMBOOK - KUMAR PRAKASHANCHAPTER - STRUCTURE OF ATOMEXERCISE - QUESTINS PAPER FROM MODULE (SECTION -B)
3 Videos
- STRUCTURE OF ATOMBOOK - KUMAR PRAKASHANCHAPTER - STRUCTURE OF ATOMEXERCISE - Section -C(MCQ asked in Board Exam )
53 Videos
- STATES OF MATTER BOOK - KUMAR PRAKASHANCHAPTER - STATES OF MATTER EXERCISE - QUESTION PAPER FROM MODULE (SECTION - A)
4 Videos
- THE P-BLOCK ELEMENTSBOOK - KUMAR PRAKASHANCHAPTER - THE P-BLOCK ELEMENTSEXERCISE - SECTION-D NCERT EXEMPLAR SOLUTION (MCQs) LONG ANSWER
25 Videos
Similar Questions
One bivalent ion has electron configuration 2, 8, 8, 6, its atomic mass is 56. Calculate the number of neutron in it.
View SolutionCalculate the mass of photon having 3.6A wavelength. (h = 6.626 x 10~34 Is, V = 3 x 10⁸ ms"1)
View SolutionThe hydrogen electron de-exites from its 3rd excited state. W hich are tru e and false statem ents for it. Assign T for true and F for the false. (i) It emits the radiation giving the lines in the Lyman Balmer and Paschen series. (ii) It emits radiation of only UV and visible regions and not infrared region. (iii) It em its the ra d ia tio n of sm allest wavelength giving the line in Lyman series. (iv) It will emit the radiation of the highest frequency giving line in Pfund series
View SolutionGiven Dalton.s Law of partial Pressure, its mathematical formula and explain aqueous tension.
View SolutionDescribe the general trends in the following properties of the elements in Groups-13
Atomic size
View SolutionEnergy density in the region between 1s and 2s orbital is …………
View SolutionStatement -I : Probability density of electron is zero at nucleus for all p & d orbitals.
Statement -II : Probability density of electron at the nucleus depends upon azimuthal quantum number
only.
View SolutionThe probability density plots of 1 s and 2s orbitals are given in figure. The density of dots in a region represetns the probability density of finding electrons in the region. On the basis of above diagram which of the following statements is incorrect?
View SolutionAssertion. The plots of probability density and radial probability function versus distance r from the nucleus for any particular orbital are not identical Reason. Probability density is Psi^(2) whereas radial probability function represents probability of finding the electron in a shell of thickness dr .
View Solutionकिसी कक्षक के लिए सीमा सतह आरेखों में वह क्षेत्र पृष्ठांकित किया जाता है जहां प्रायिकता घनत्व उच्च (>90∘) होता है जबकि ऐसे क्षेत्र निरूपित नहीं किये जाते जहां इलेक्ट्रॉन के पाये जाने की प्राथमिकता 100% हो, क्यों ?
View SolutionThe region where probability density function reduces to zero is called
View Solutionelectrophiles are the species which attack the regions of............ electron density
View SolutionThe probability density plots of 1 s and 2s orbitals are given in figure.

The density of dots in a region represetns the probability density of finding electrons in the region. On the basis of above diagram which of the following statements is incorrect?
View SolutionThe region where probability density function reduces to zero is called
View SolutionThe probability density plots of 1s and 2s atomic orbitals are given in figures.

The density of dots in a region represents the probability density of finding electrons in the region. On the basis of the above diagram, which of the following statements is incorect?
View Solution
