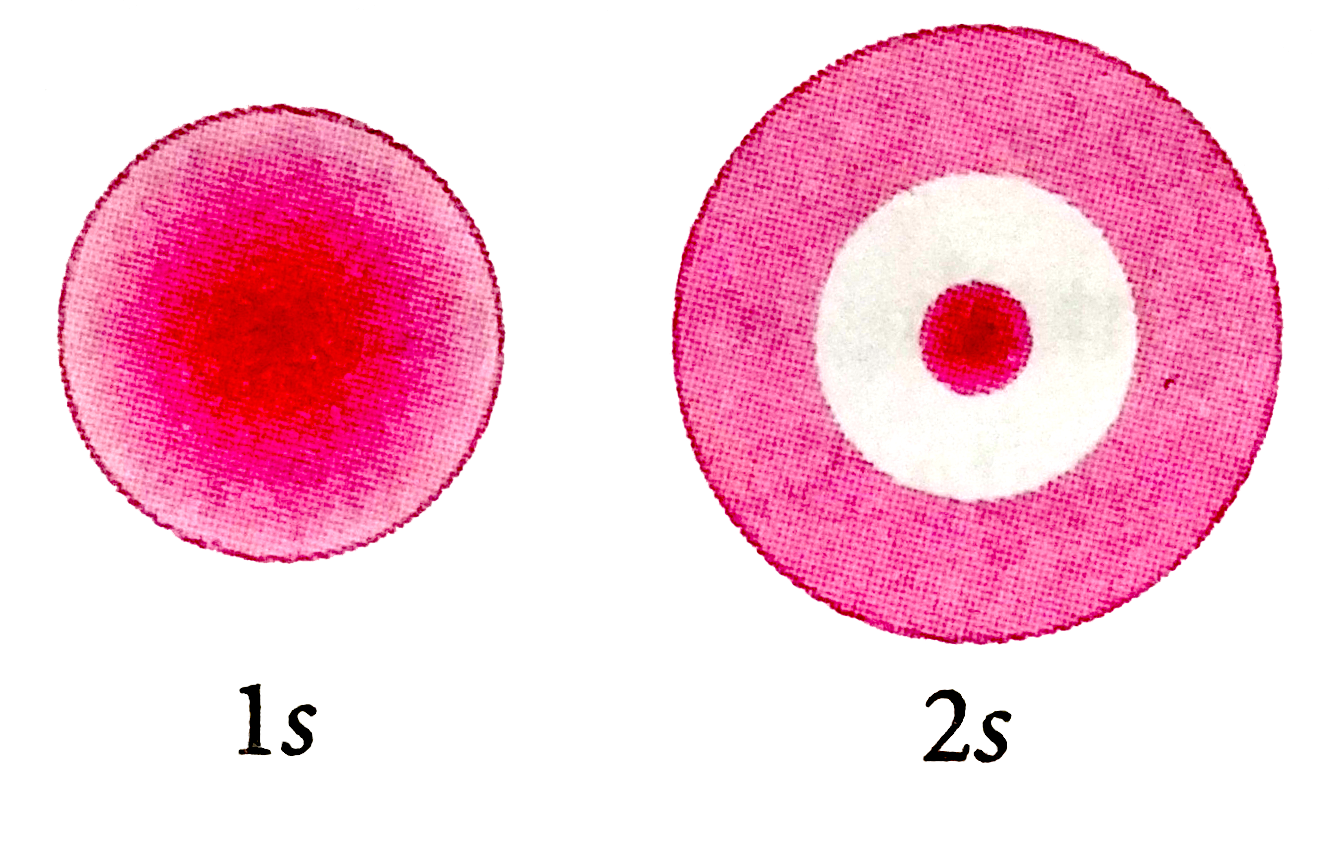
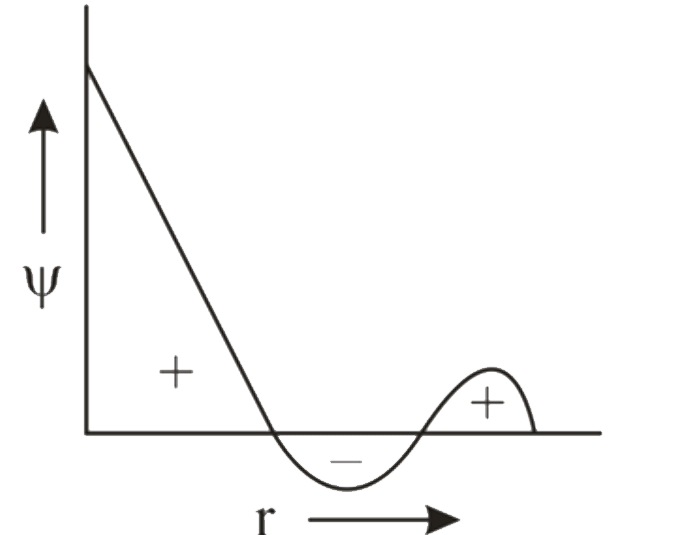
Represent graphically, the variation of probability density (ψ2_(r)) as a function of distance (r ) of the electron from the nucleus for 1s and 2s orbitals. Solution in Malayalam
Step by step video & image solution for Represent graphically, the variation of probability density (psi^2 _(r)) as a function of distance (r ) of the electron from the nucleus for 1s and 2s orbitals. by Chemistry experts to help you in doubts & scoring excellent marks in Class 11 exams.
Updated on:21/07/2023Similar Questions
[" Which among the following "],[" statements is/are correct? "],[qquad [" For all orbitals,the radial "],[" wave function "(Psi)],[" approaches to zero as "r],[" approaches infinity "],[" The radial probability "],[" density "(psi^(2))_(" for "'1s'" orbital is ")],[" maximum at nucleus "],[" The radial distribution "],[" function "(4 pi r^(2)psi^(2))_(" for "'1s'" is ")],[" minimum at nucleus "],[" In plot of radial wave "],[" function "(psi)_(" changes its ")],[" sign at nodes "]]
View SolutionThe variation of radial probability density R^2 (r) as a function of distance r of the electron from the nucleus for 3p orbital: (A)(a) (b) (b) (c) (d)
View SolutionWave function of an orbital is plotted against the distance from nucleus. The graphical representation is of :
View SolutionThe probability density plots of 1s and 2s atomic orbitals are given in figures.

The density of dots in a region represents the probability density of finding electrons in the region. On the basis of the above diagram, which of the following statements is incorect?
View SolutionThe first orbital of H is represented by psi=2(1/a_0)^(3/2) e^-(r/a_0) where a_0 is Bohr's radius the probability of finding the electron at a distance r from the nucleus in the region dV is
View SolutionWave function of an orbital is plotted against the distance from nucleus

The graphical representation is of
View SolutionThe variation of radial probability density R^2 (r) as a function of distance r of the electron from the nucleus for 3p orbital:
View Solution
