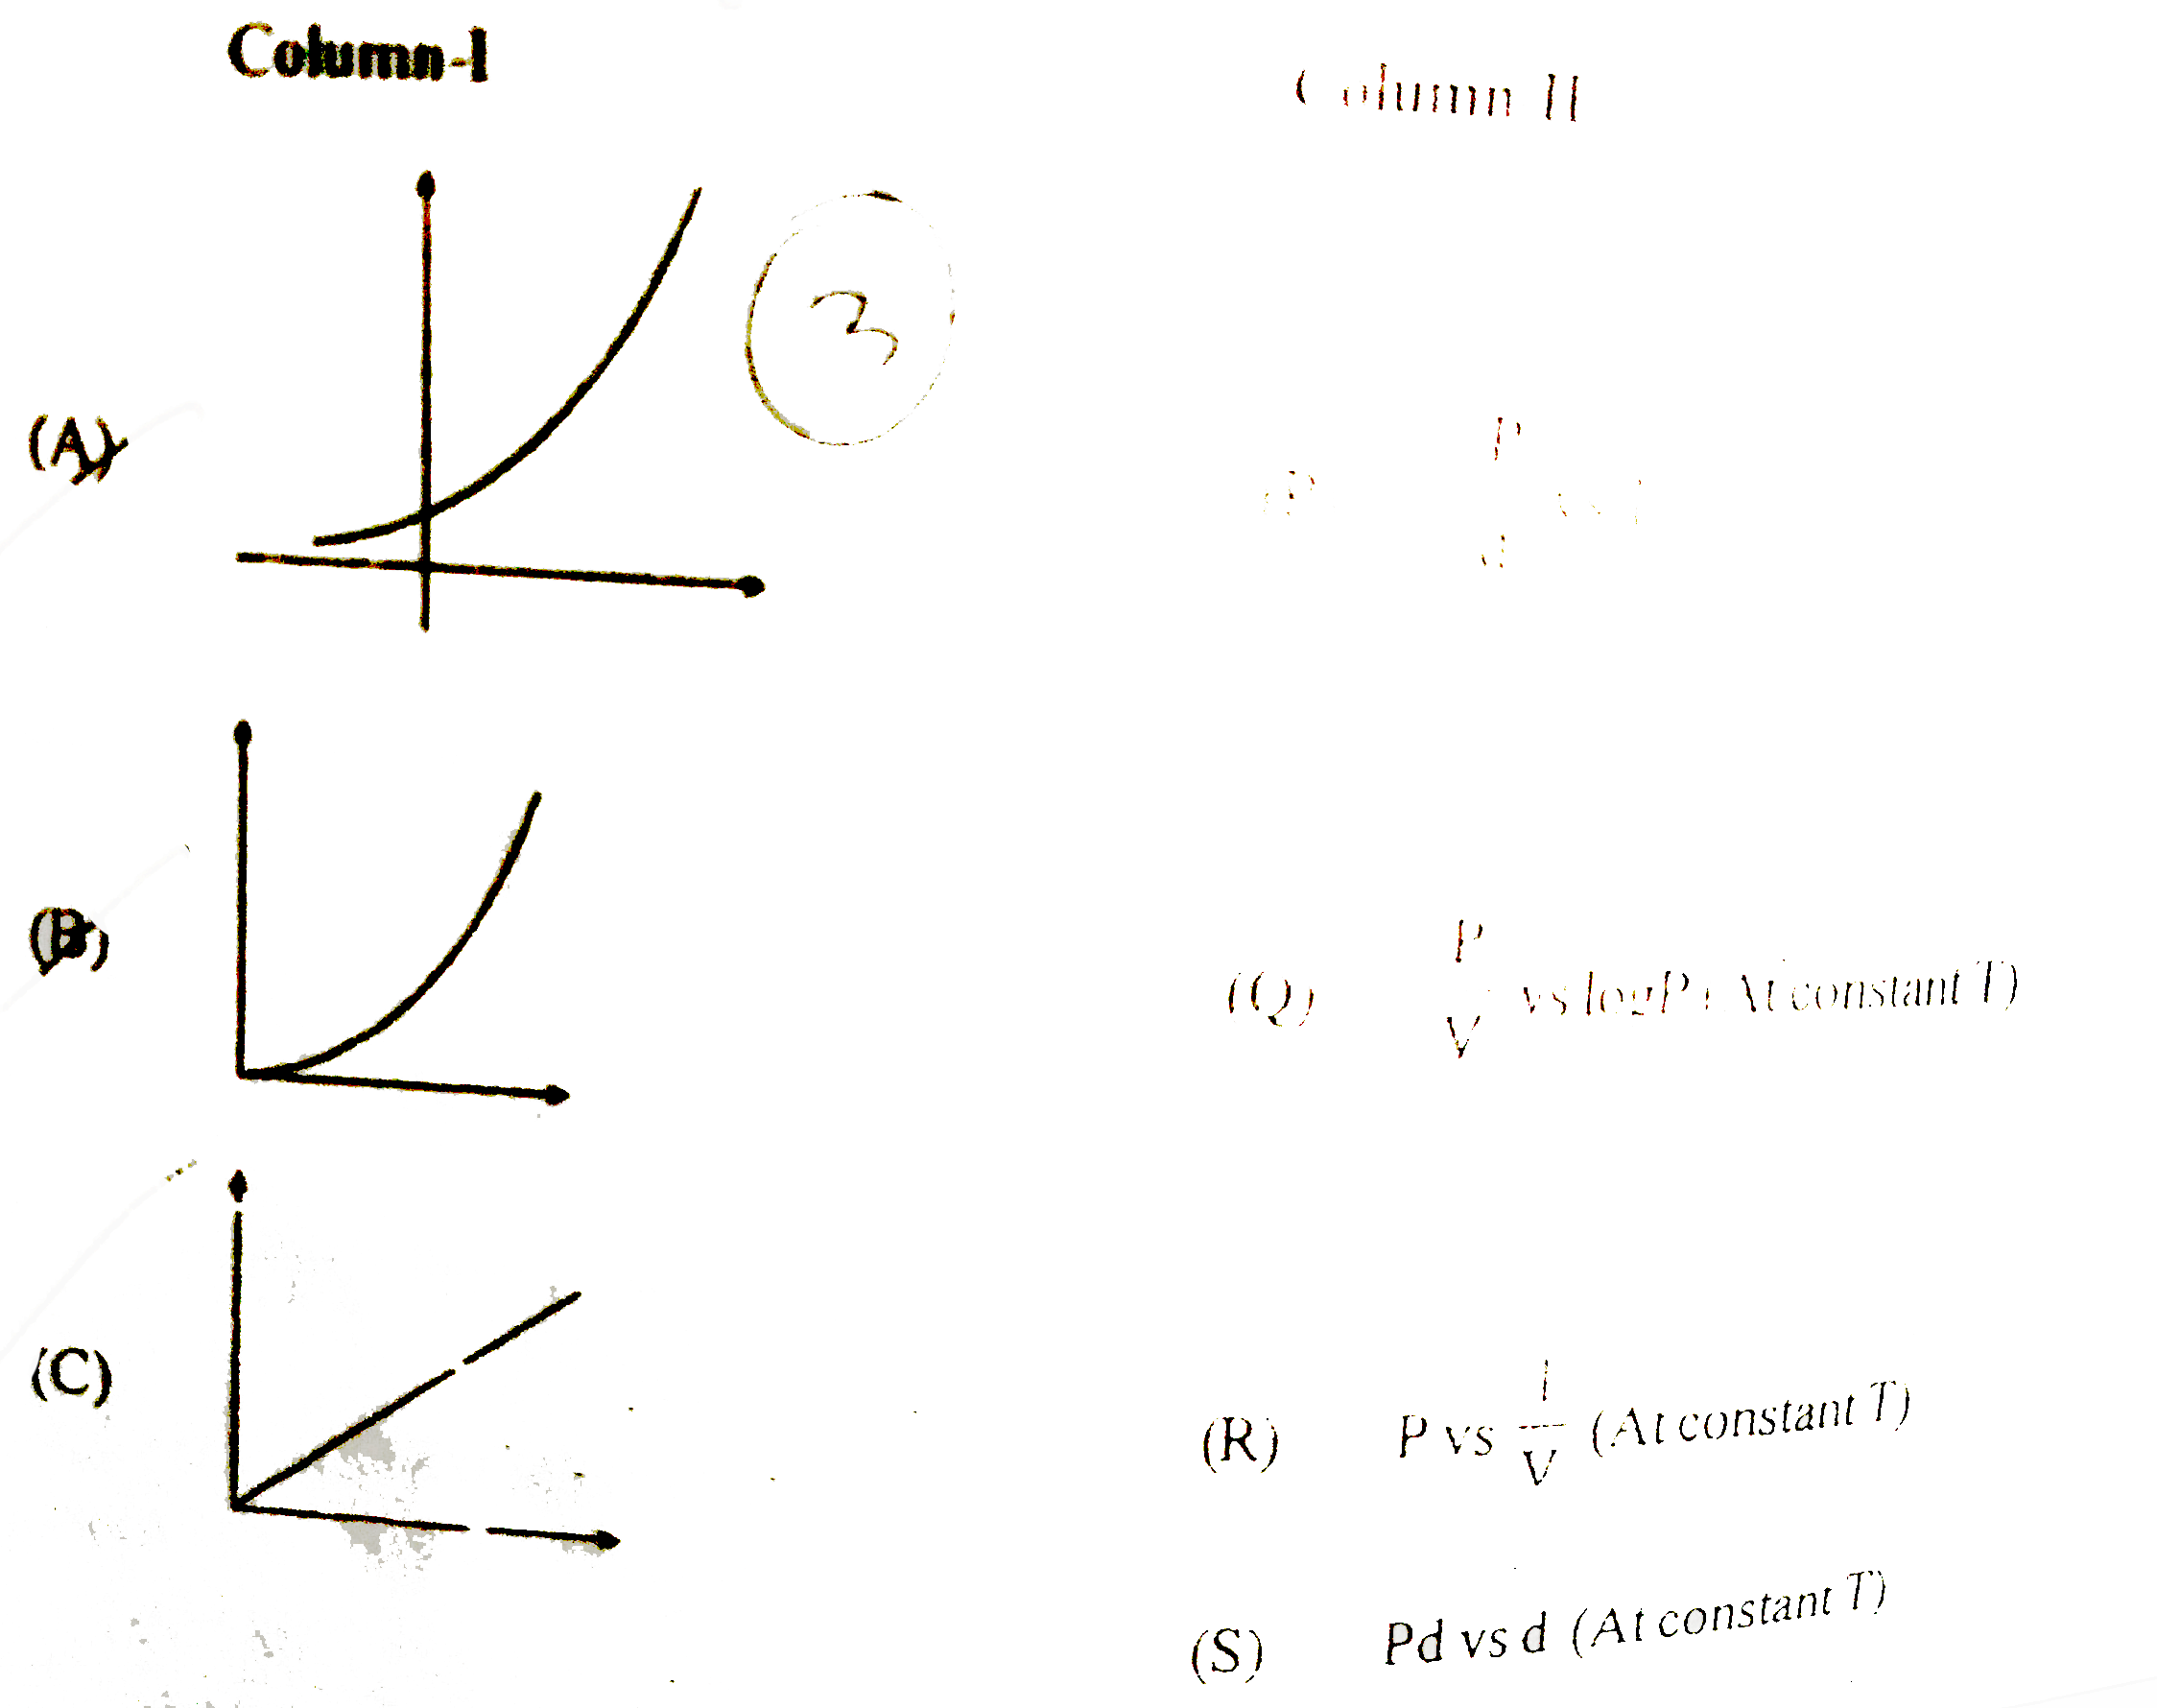
Which of the following diagram correctly describes the behaviour of a fixed mass of an ideal gas ? ( T is measured in K ) . Solution in Kannada
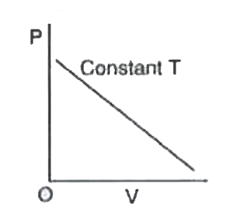
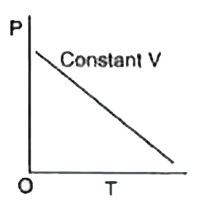
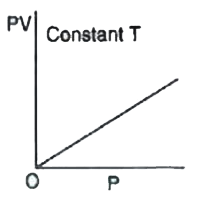
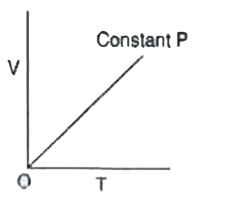
The correct Answer is:D
Step by step video, text & image solution for Which of the following diagram correctly describes the behaviour of a fixed mass of an ideal gas ? ( T is measured in K ) . by Chemistry experts to help you in doubts & scoring excellent marks in Class 12 exams.
Topper's Solved these Questions
- BOOK - MODERN PUBLICATIONCHAPTER - STATES OF MATTEREXERCISE - MULTIPLE CHOICE QUESTIONS (LEVEL-III)7videos
STATES OF MATTER
- BOOK - MODERN PUBLICATIONCHAPTER - STATES OF MATTEREXERCISE - RECENT EXAMINATION QUESTIONS12videos
STATES OF MATTER
- BOOK - MODERN PUBLICATIONCHAPTER - STATES OF MATTEREXERCISE - RECENT EXAMINATION QUESTIONS12videos
STATES OF MATTER
- BOOK - MODERN PUBLICATIONCHAPTER - SOME BASIC CONCEPTS OF CHEMISTRY EXERCISE - RECENT EXAMINATION QUESTION15videos
SOME BASIC CONCEPTS OF CHEMISTRY
- BOOK - MODERN PUBLICATIONCHAPTER - STRUCTURE OF ATOMEXERCISE - RECENT EXAMINATION QUESTIONS11videos
STRUCTURE OF ATOM
Similar Questions
a' and 'b' are van der Waals' constant for gases. Chlorine is more easily liquefied than ethane because
View SolutionThe pressure and temperature of 4dm3 of carbon dioxide gas are doubled. Then the volume of carbon dioxide gas would be
03:44View SolutionThe pressure and temperature of 4dm3 of carbon dioxide gas are doubled. Then the volume of carbon dioxide gas would be
01:33View Solution80 g of oxygen contains as many atoms as in
01:22View SolutionThe correct set of four quantum numbers for outermost electron of potassium (Z=19 ) is
01:17View SolutionWhich of the following graphs is consistent with ideal gas behaviour?
View SolutionWhich of the following diagrams, Fig. depicts ideal gas behaviour ?
03:58View SolutionWhich of the following diagrams correctly decribes the behavior of a fixed mass of an ideal gas ? ( T is measured in K )
04:15View SolutionWhich of the following diagrams (figure) depicts ideal gas behaviour?
04:23View SolutionWhich of the following measure the deviation from ideal behaviour of gas?
View SolutionFor fixed mass of an ideal gas.
 View Solution
Which of the following diagram correctly describes the behaviour of a fixed mass of an ideal gas ? (T is measured in K)
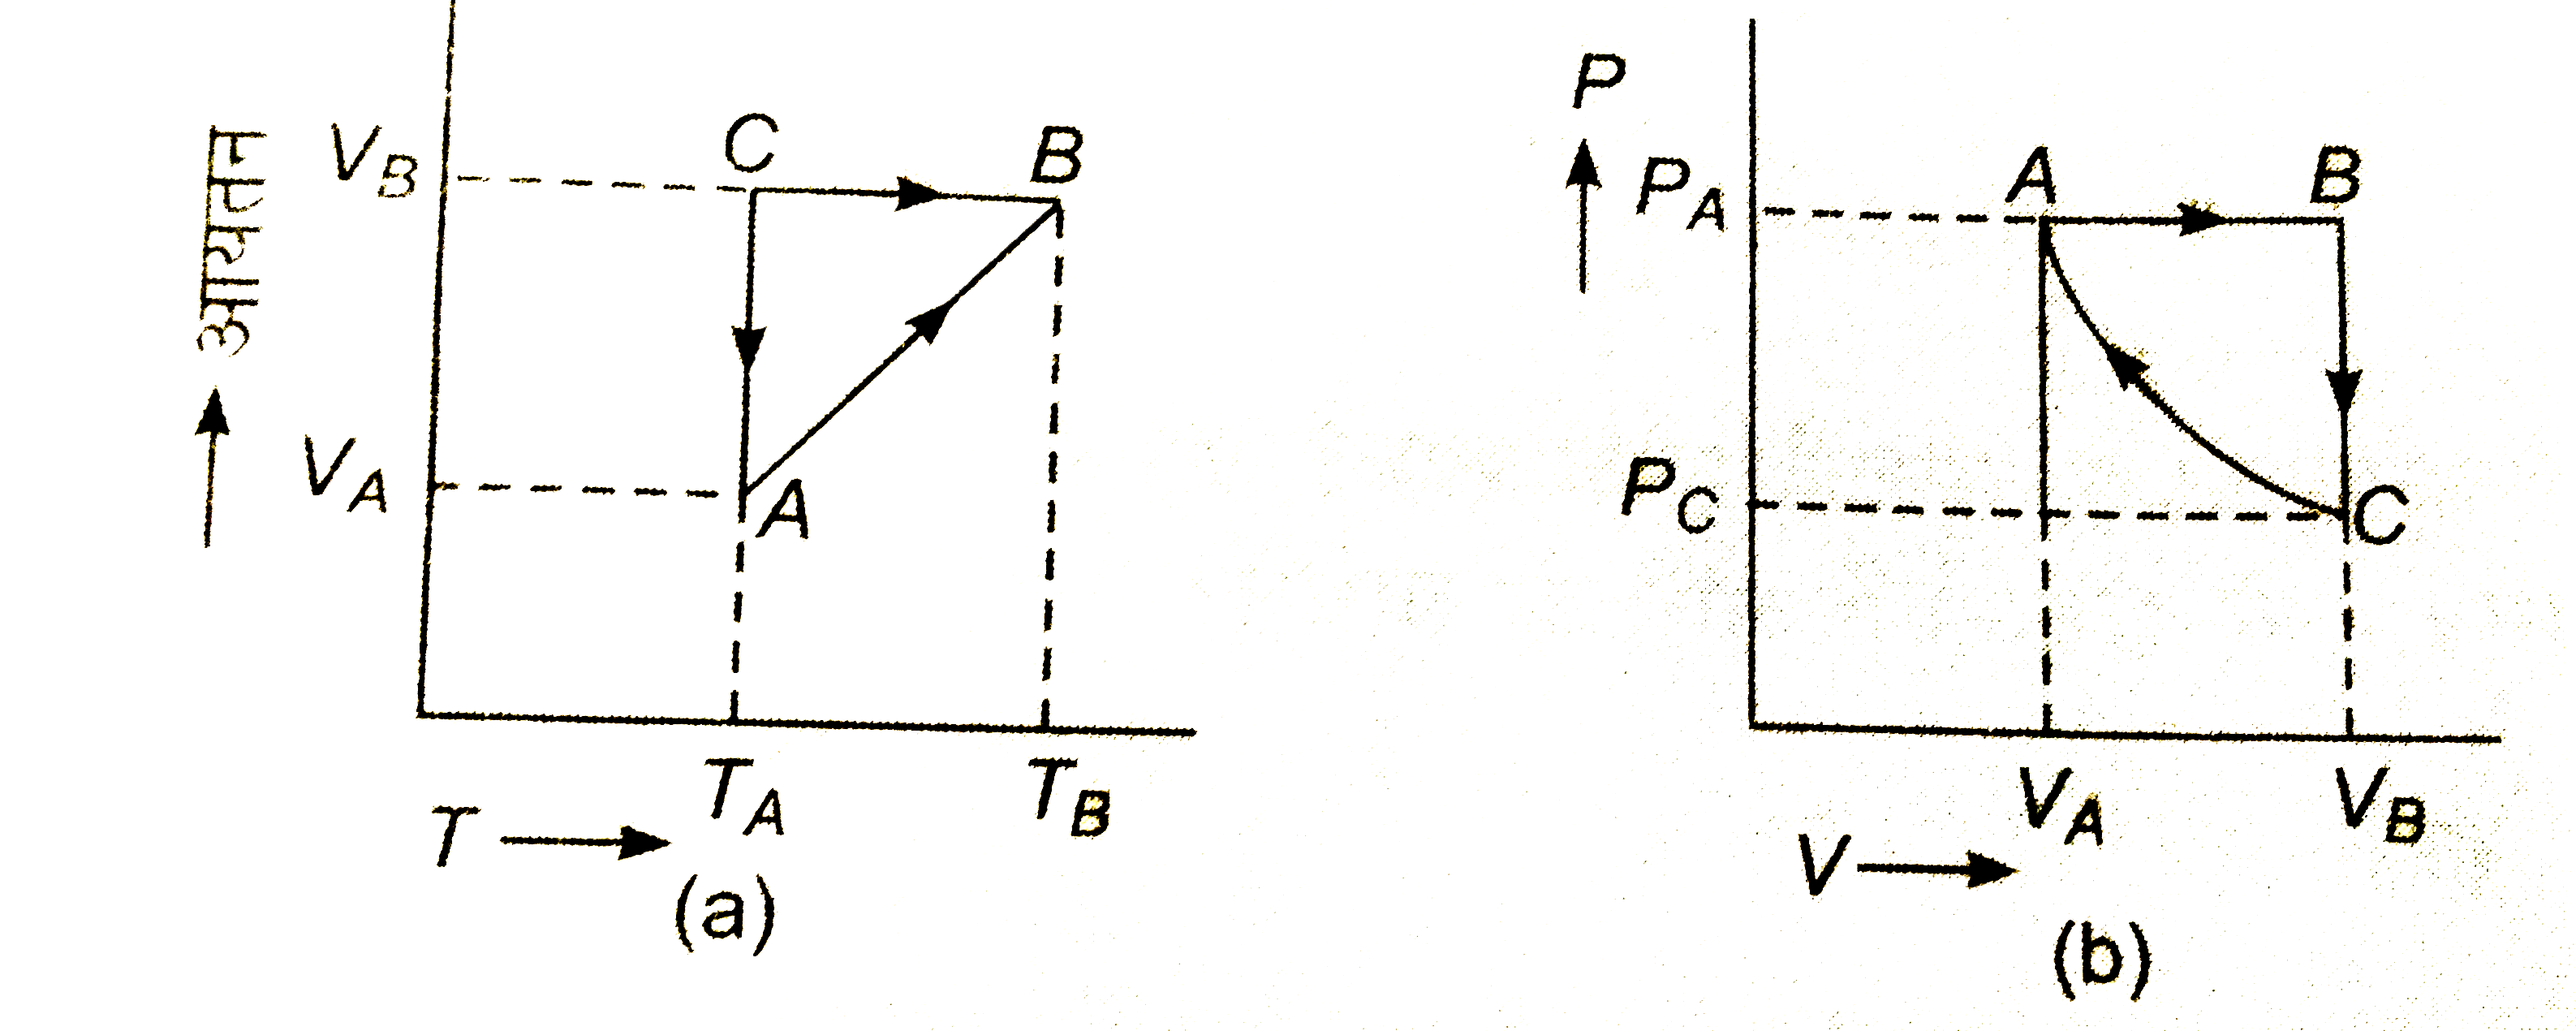
01:42View Solutionएक चक्रीय प्रक्रम ABCA चित्र में प्रदर्शित V−T आरेख के अुनसार नियत द्रव्यमान की आदर्श गैस में लिया गया है। इस प्रक्रिया को P−V आरेख पर प्रदर्शित कीजिए।
 01:42View Solution
Which one of the following graphs correctly gives the ideal gas behaviour ?
01:41View SolutionWhich of the following diagrams correctly describes behaviour of a fixed mass of an ideal gas? (T is measured in K)
03:47View Solution

