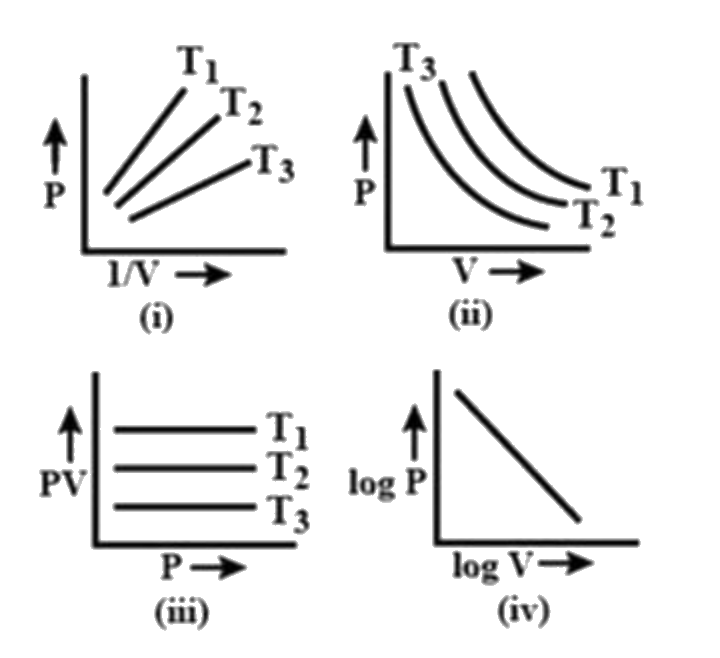
Which of the following graphs represents the correct Boyle's law ?
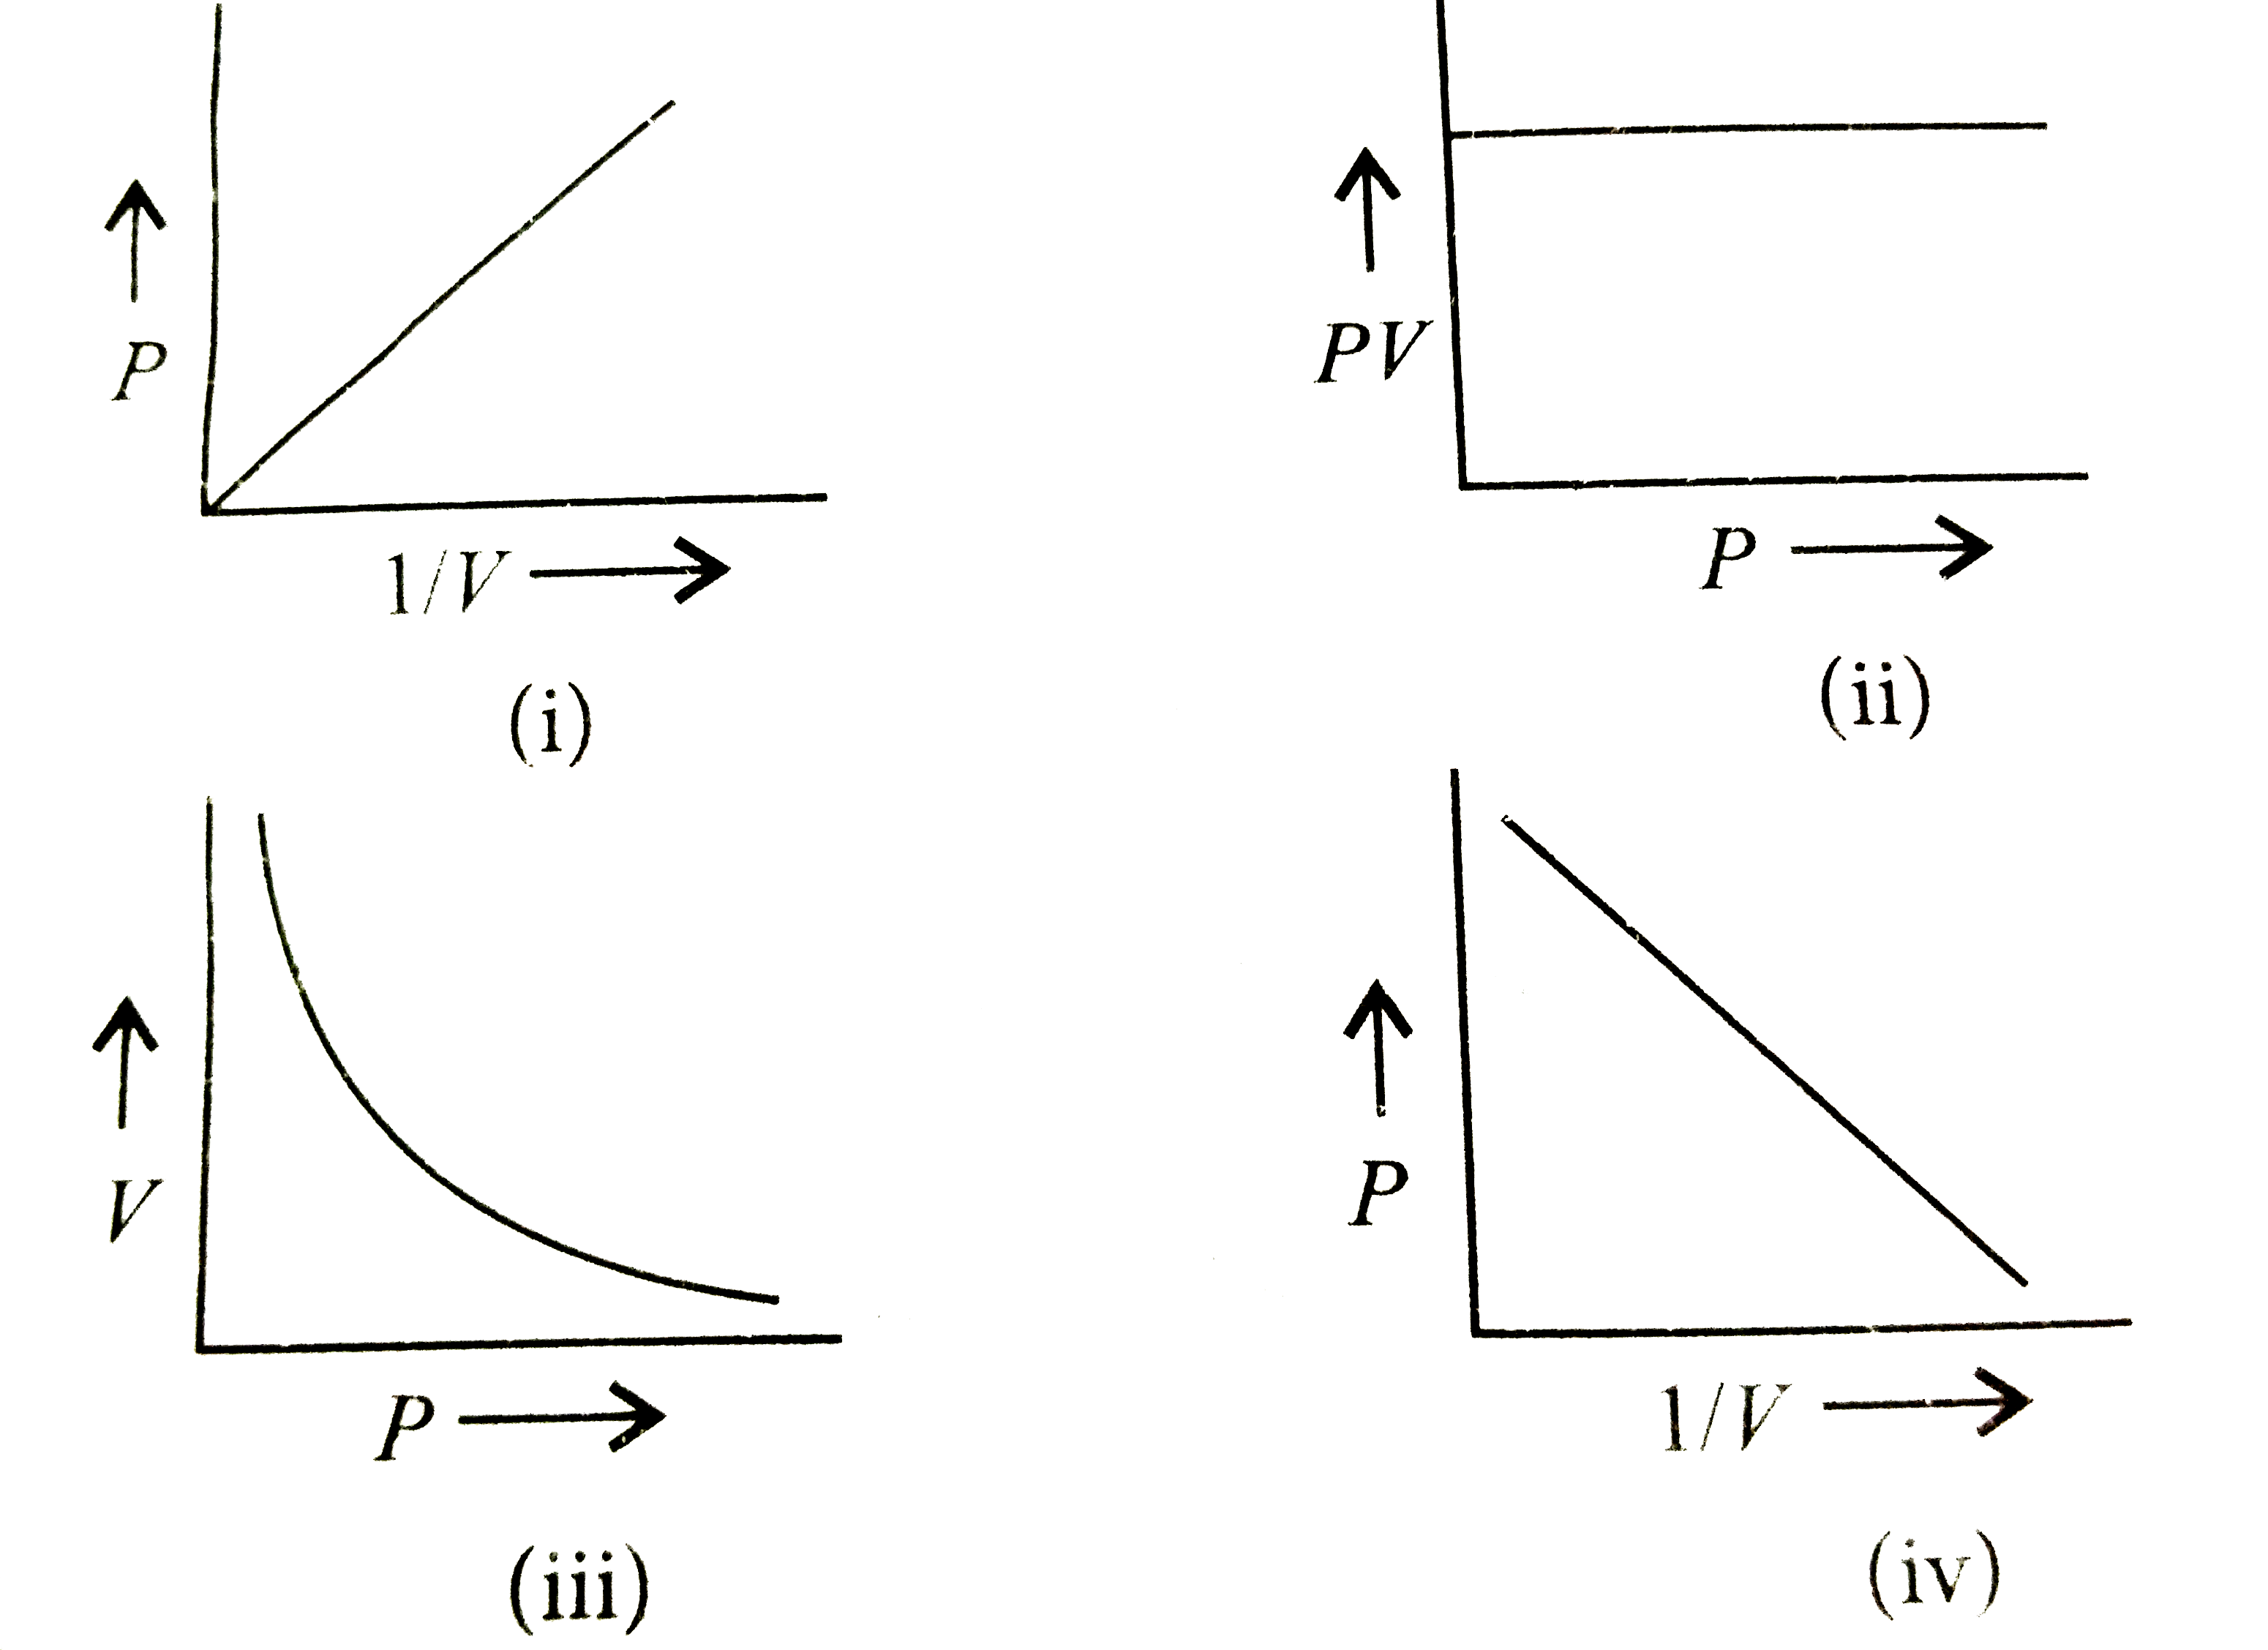
A
(i) , (ii) and (iii)
B
(i) and (iv)
C
(ii) and (iii)
D
(i) , (ii) and (iv)
Video Solution
Text Solution
The correct Answer is:A
(i), (ii) and (iii) represent Boyle's law which is P∝1V or PV is constant at constant temperature.
|
Topper's Solved these Questions
- STATES OF MATTER BOOK - NCERT FINGERTIPSCHAPTER - STATES OF MATTER EXERCISE - Ideal Gas Equation
33 Videos
- STATES OF MATTER BOOK - NCERT FINGERTIPSCHAPTER - STATES OF MATTER EXERCISE - Kinetic Energy And Molecular Speeds
4 Videos
- STATES OF MATTER BOOK - NCERT FINGERTIPSCHAPTER - STATES OF MATTER EXERCISE - MCQs
3 Videos
- SOME BASIC CONCEPTS OF CHEMISTRY BOOK - NCERT FINGERTIPSCHAPTER - SOME BASIC CONCEPTS OF CHEMISTRY EXERCISE - Assertion And Reason
10 Videos
- STRUCTURE OF ATOM BOOK - NCERT FINGERTIPSCHAPTER - STRUCTURE OF ATOM EXERCISE - Assertion And Reason
15 Videos
Similar Questions
Knowledge Check
Which of the following graphs represents Boyle's law correctly?
(i)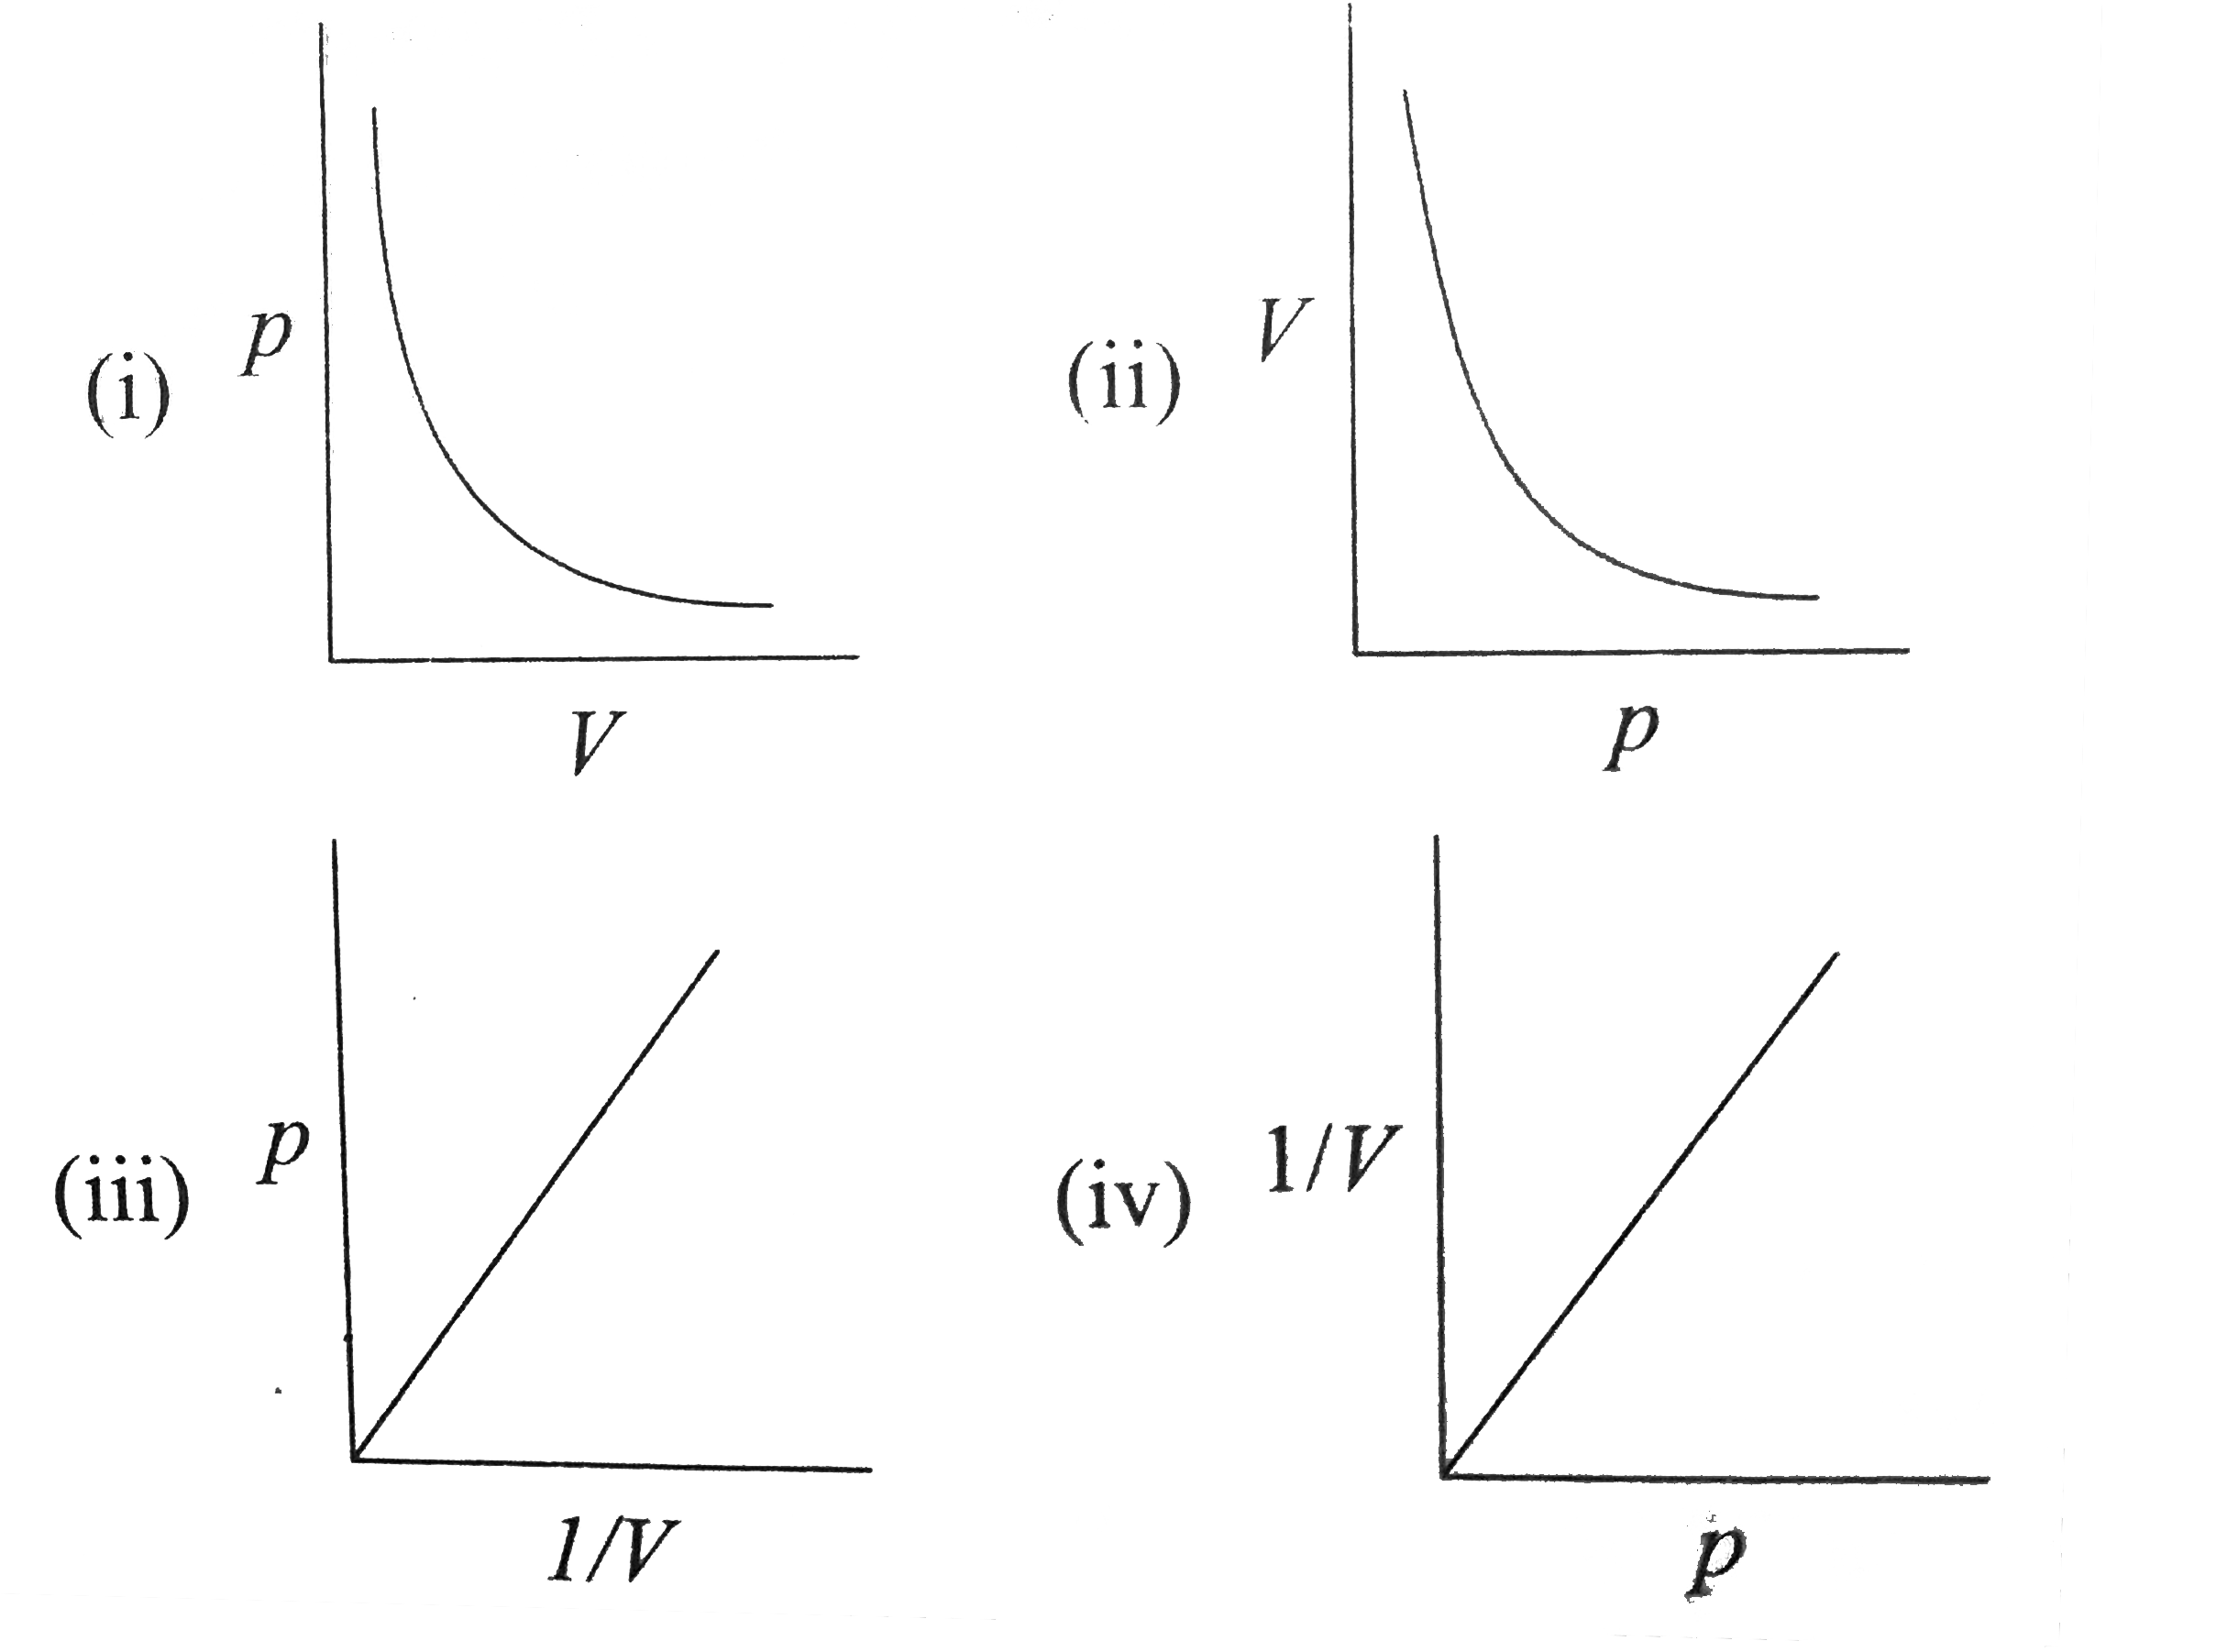 A(i),(ii),(iii),(iv)B(i),(iii)C(ii),(iv)D(ii),(iii)
which of the following graphs represents Charles' law correctly ?
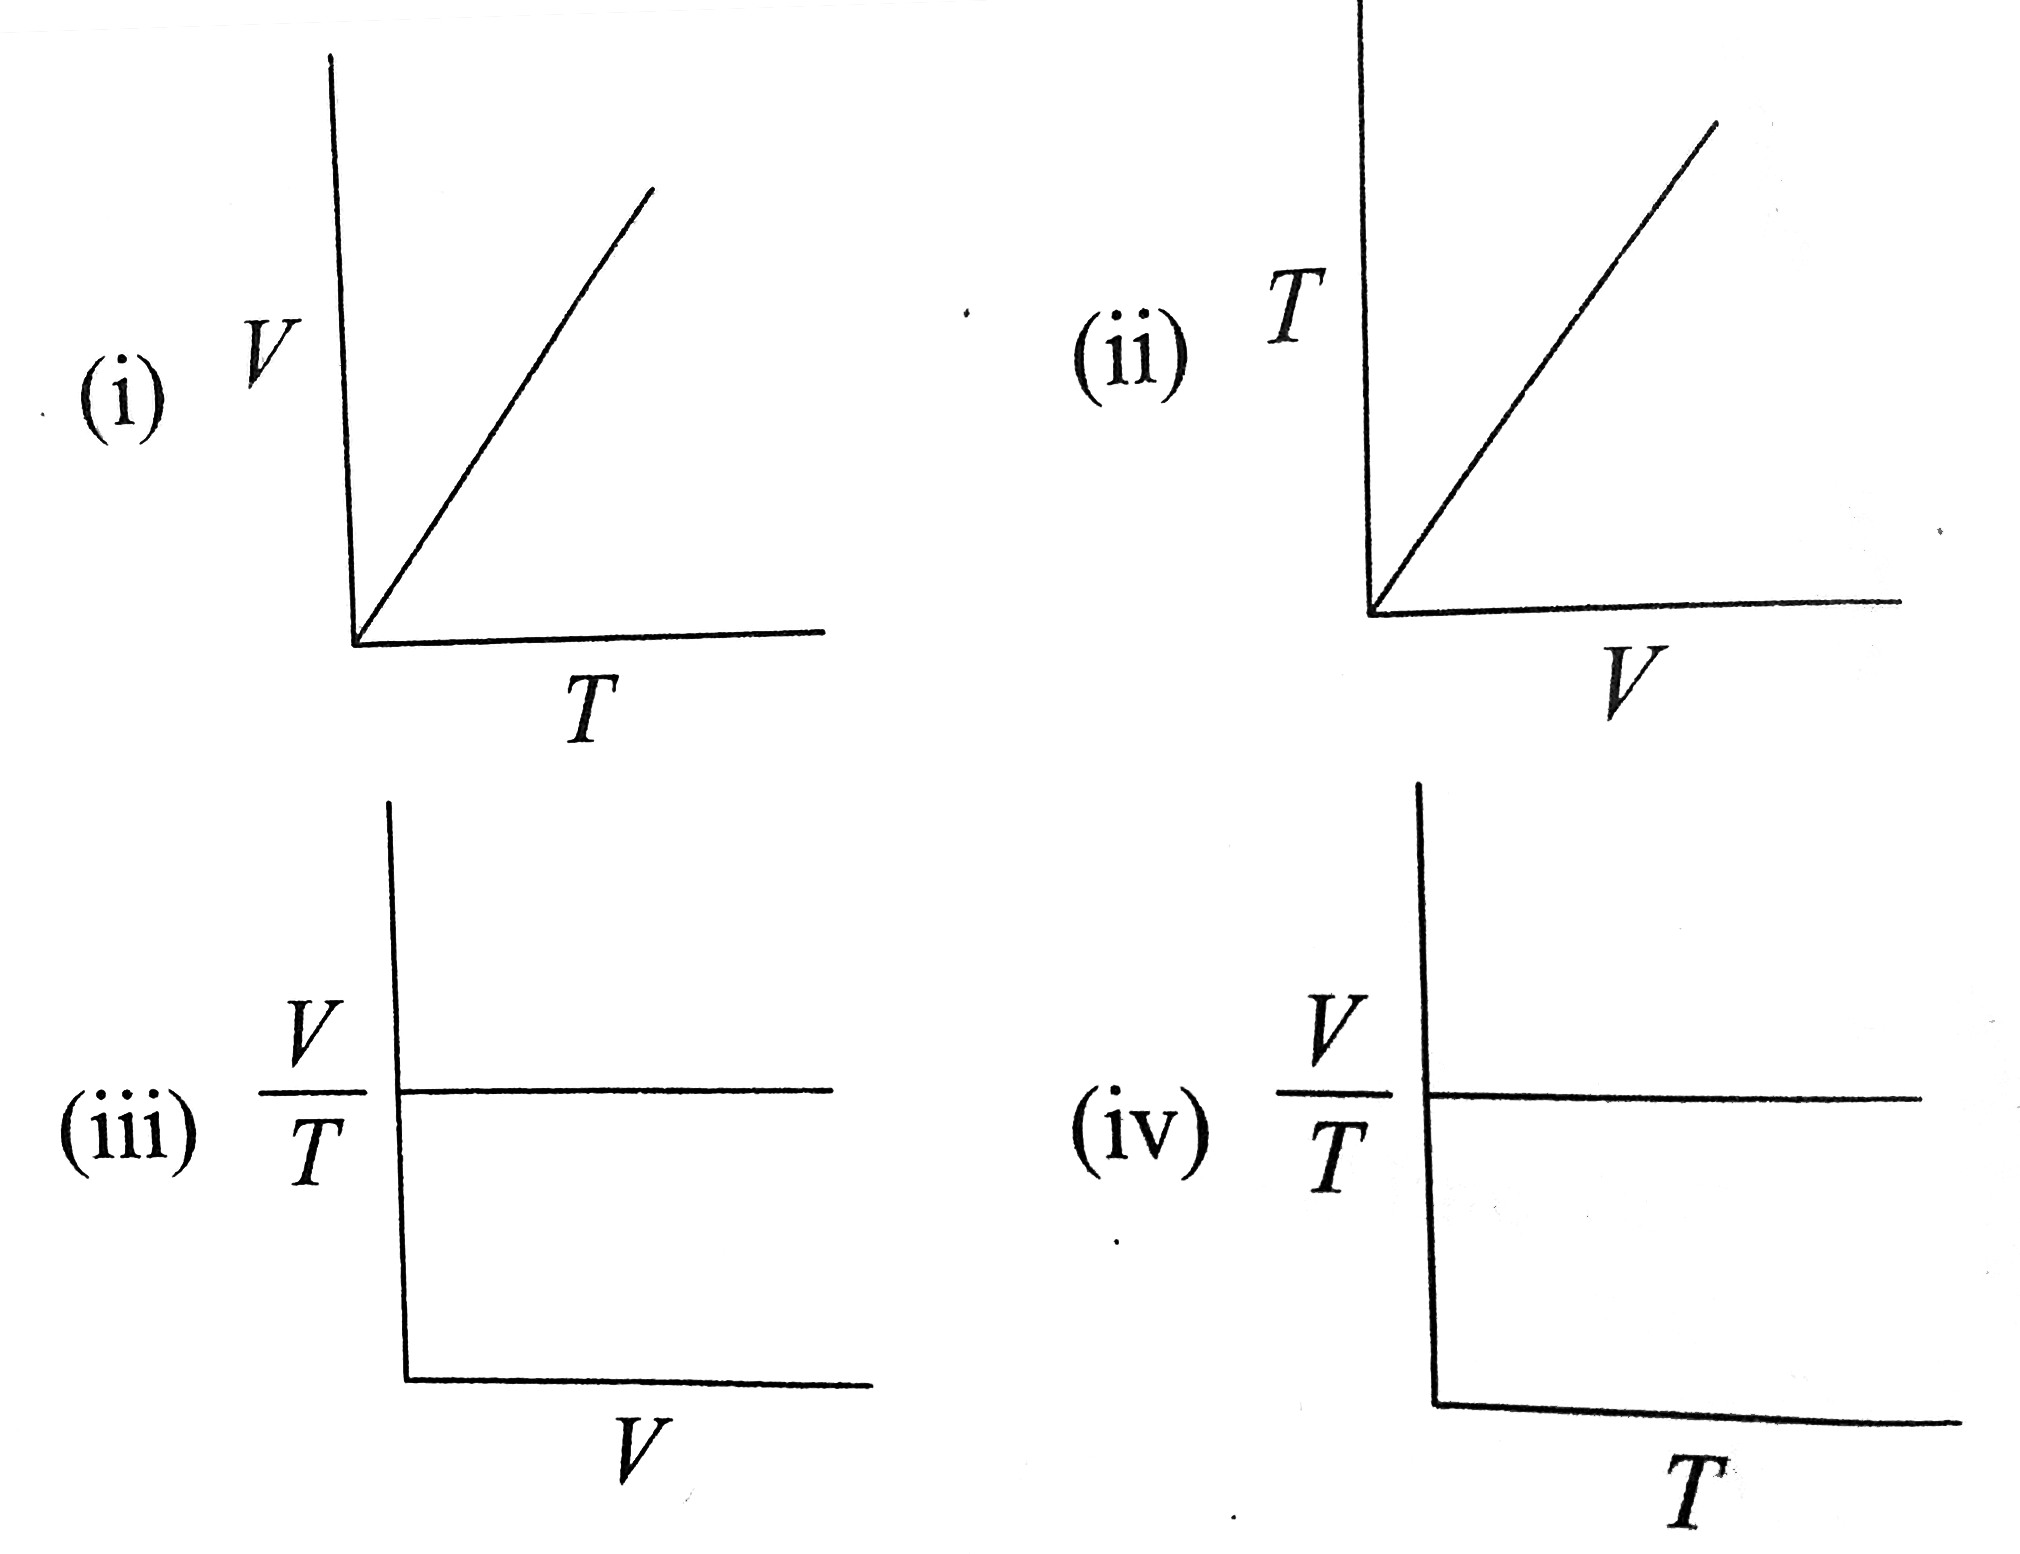 A(i),(iii)B(ii),(iv)C(i),(ii),(iii),(iv)D(iii),(iv)
Which of the following graph represents Boyle's law ?
A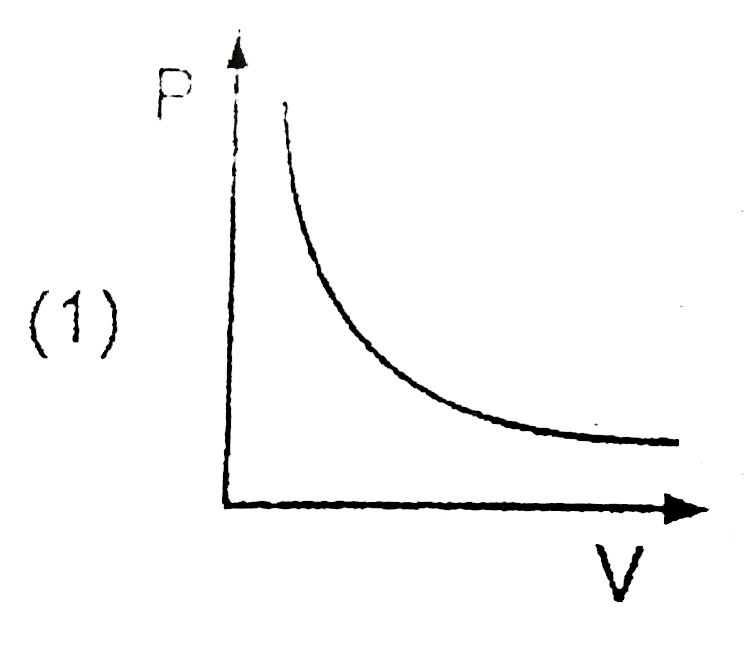 B
B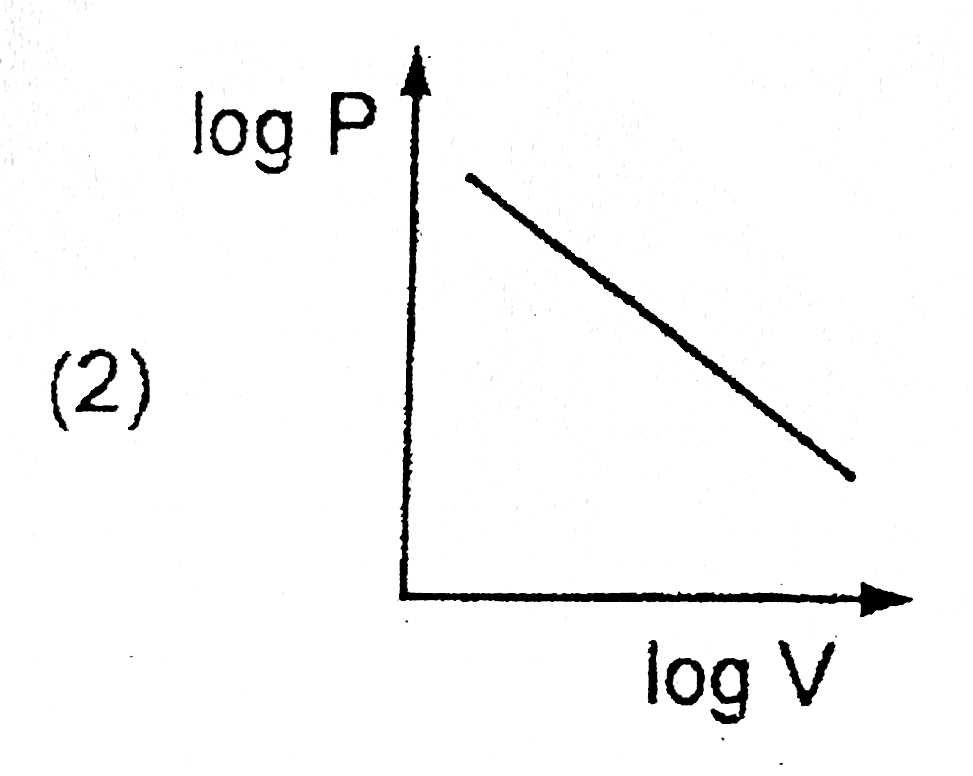 C
C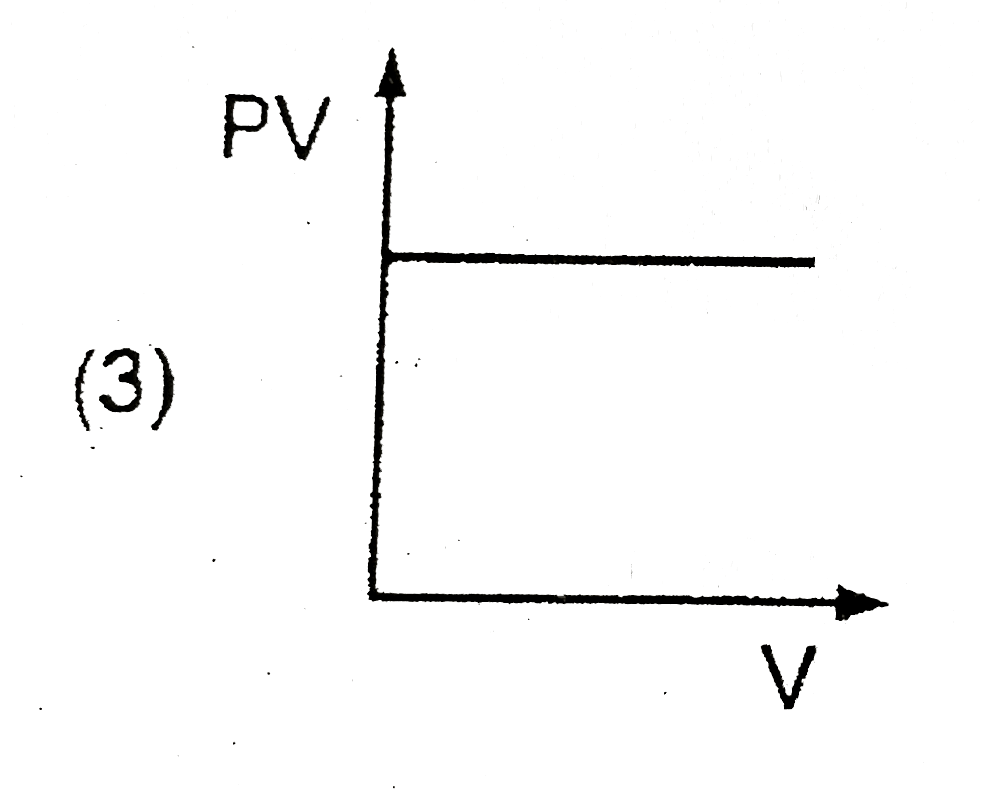 DAll of these
Graph between velocity and displacement is shown in the following figure:
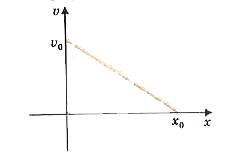
Which of the following graphes represents the correct variation of acceleration with displacement
View SolutionWhich of the following graph represent Boyle's law ?
View SolutionWhich of the following graph represents correct graph fopr SN1 reaction:
View SolutionWhich of the following curves represent(s) Boyle's law?
View SolutionWhich of the following curves does not represent Boyle's law ?
View Solution

