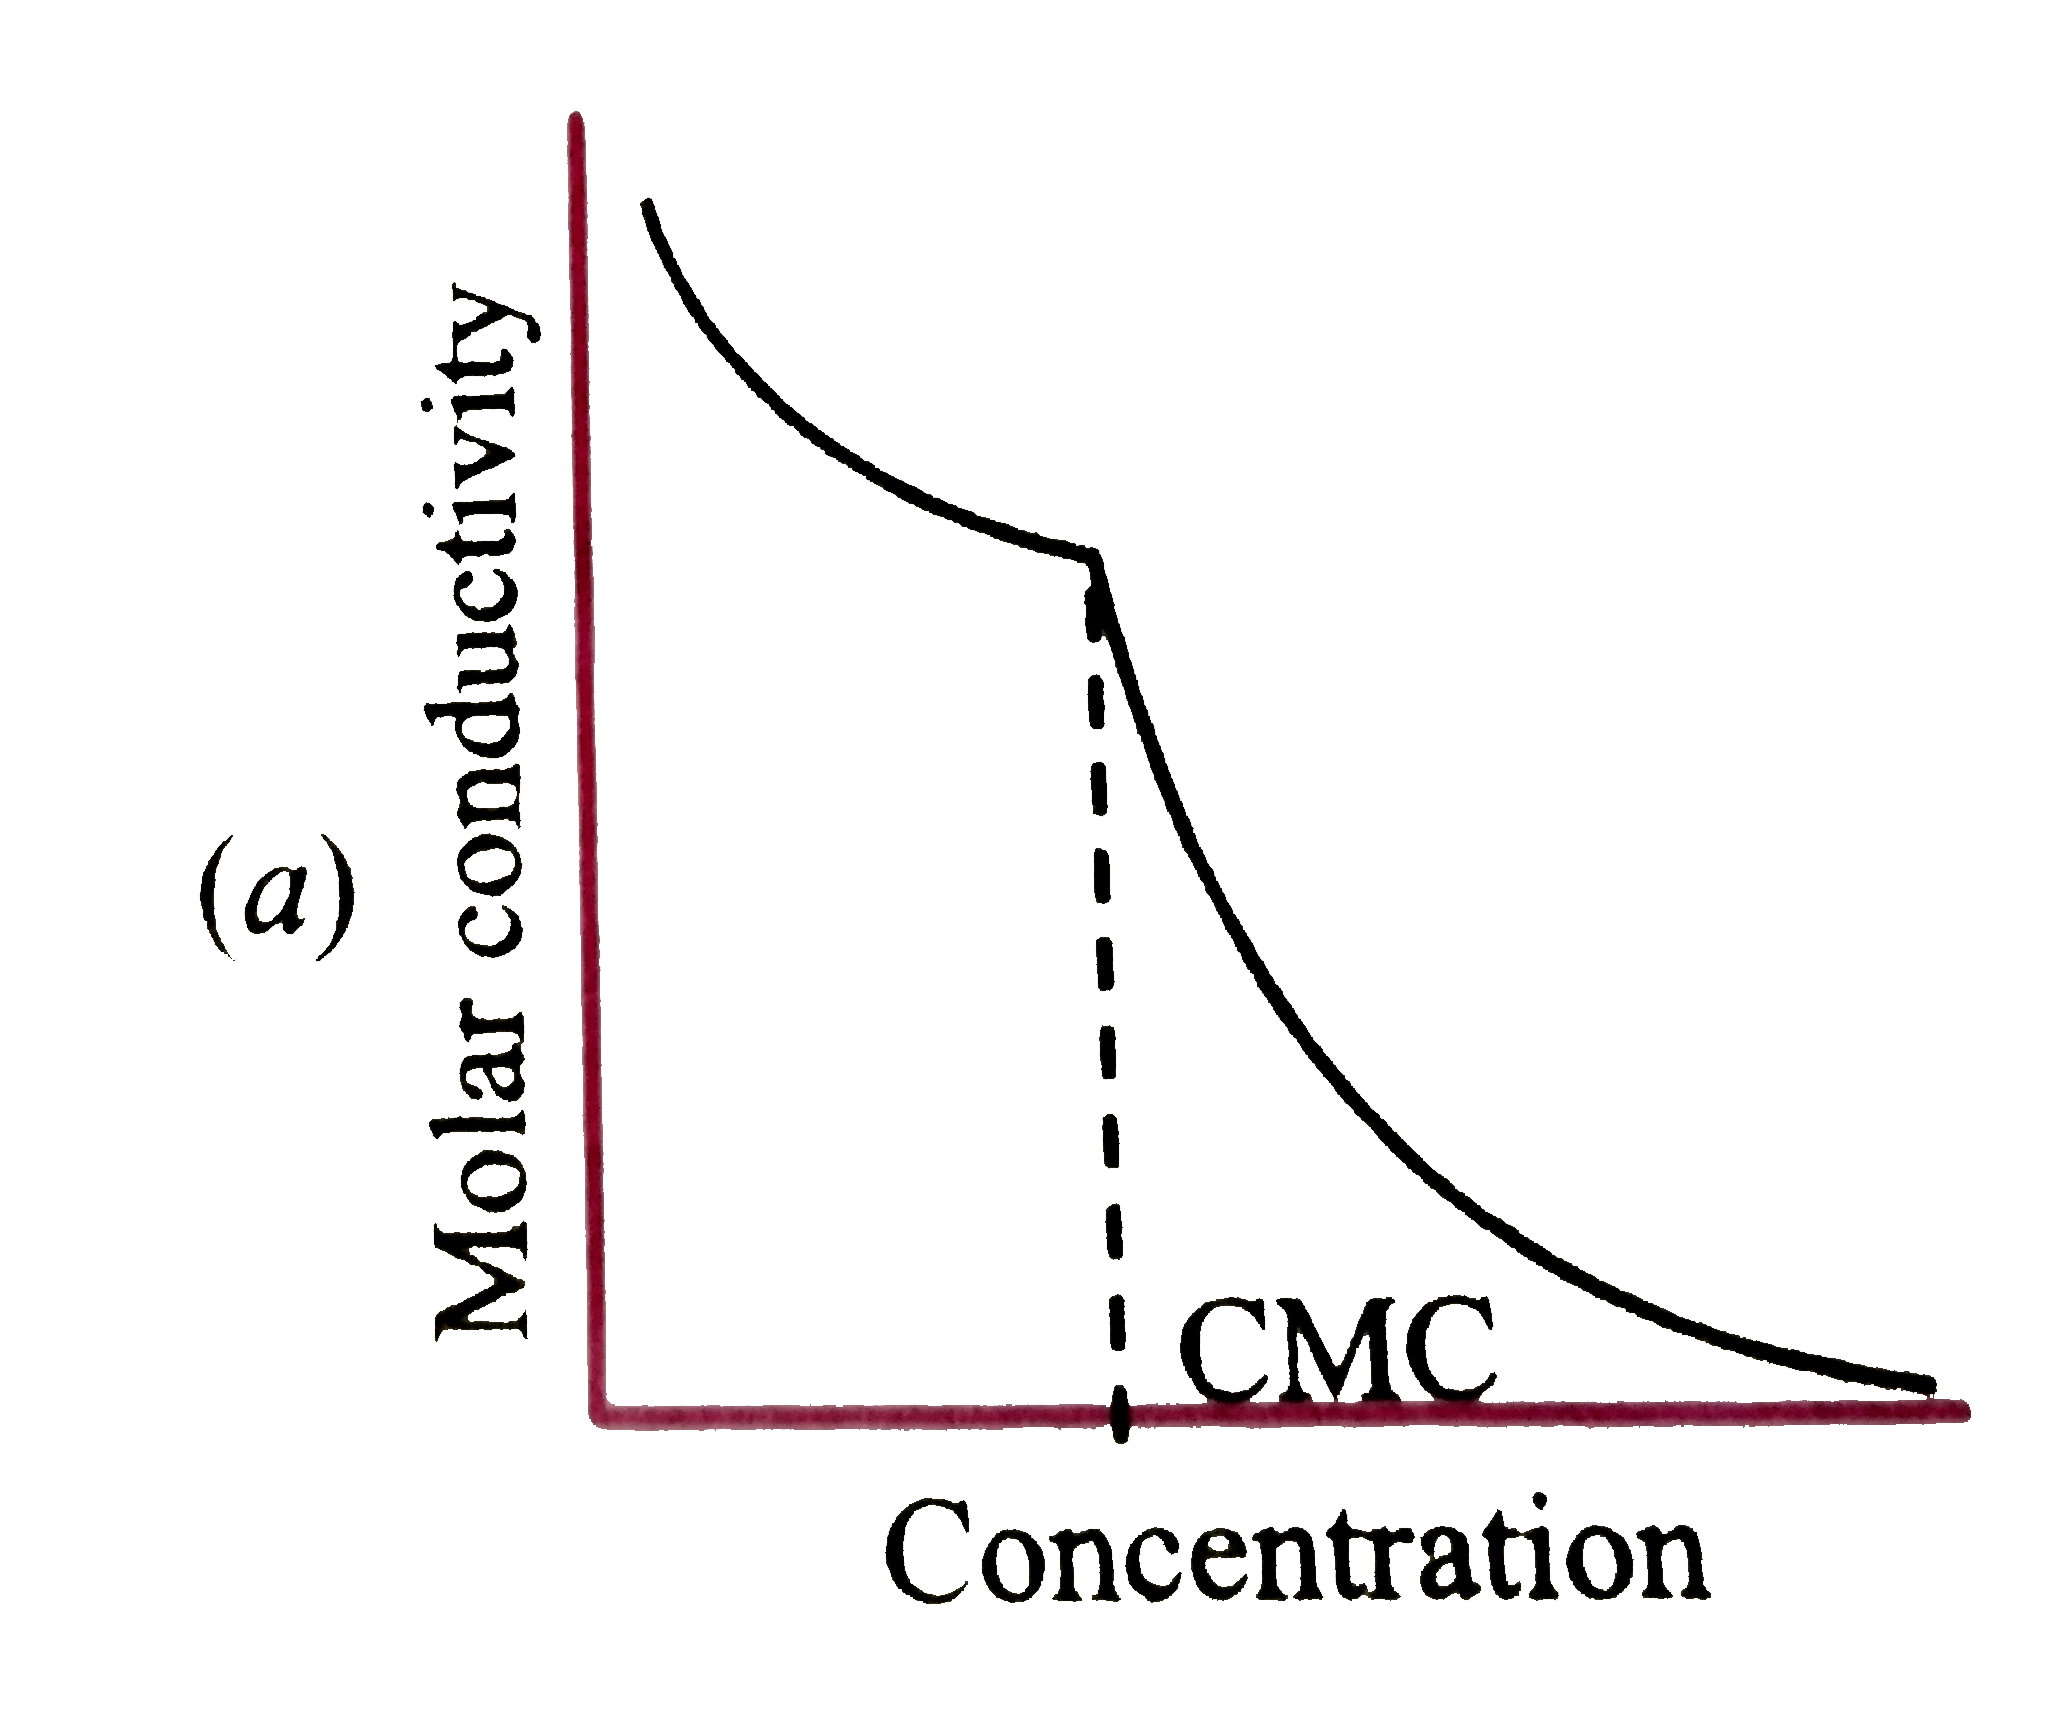
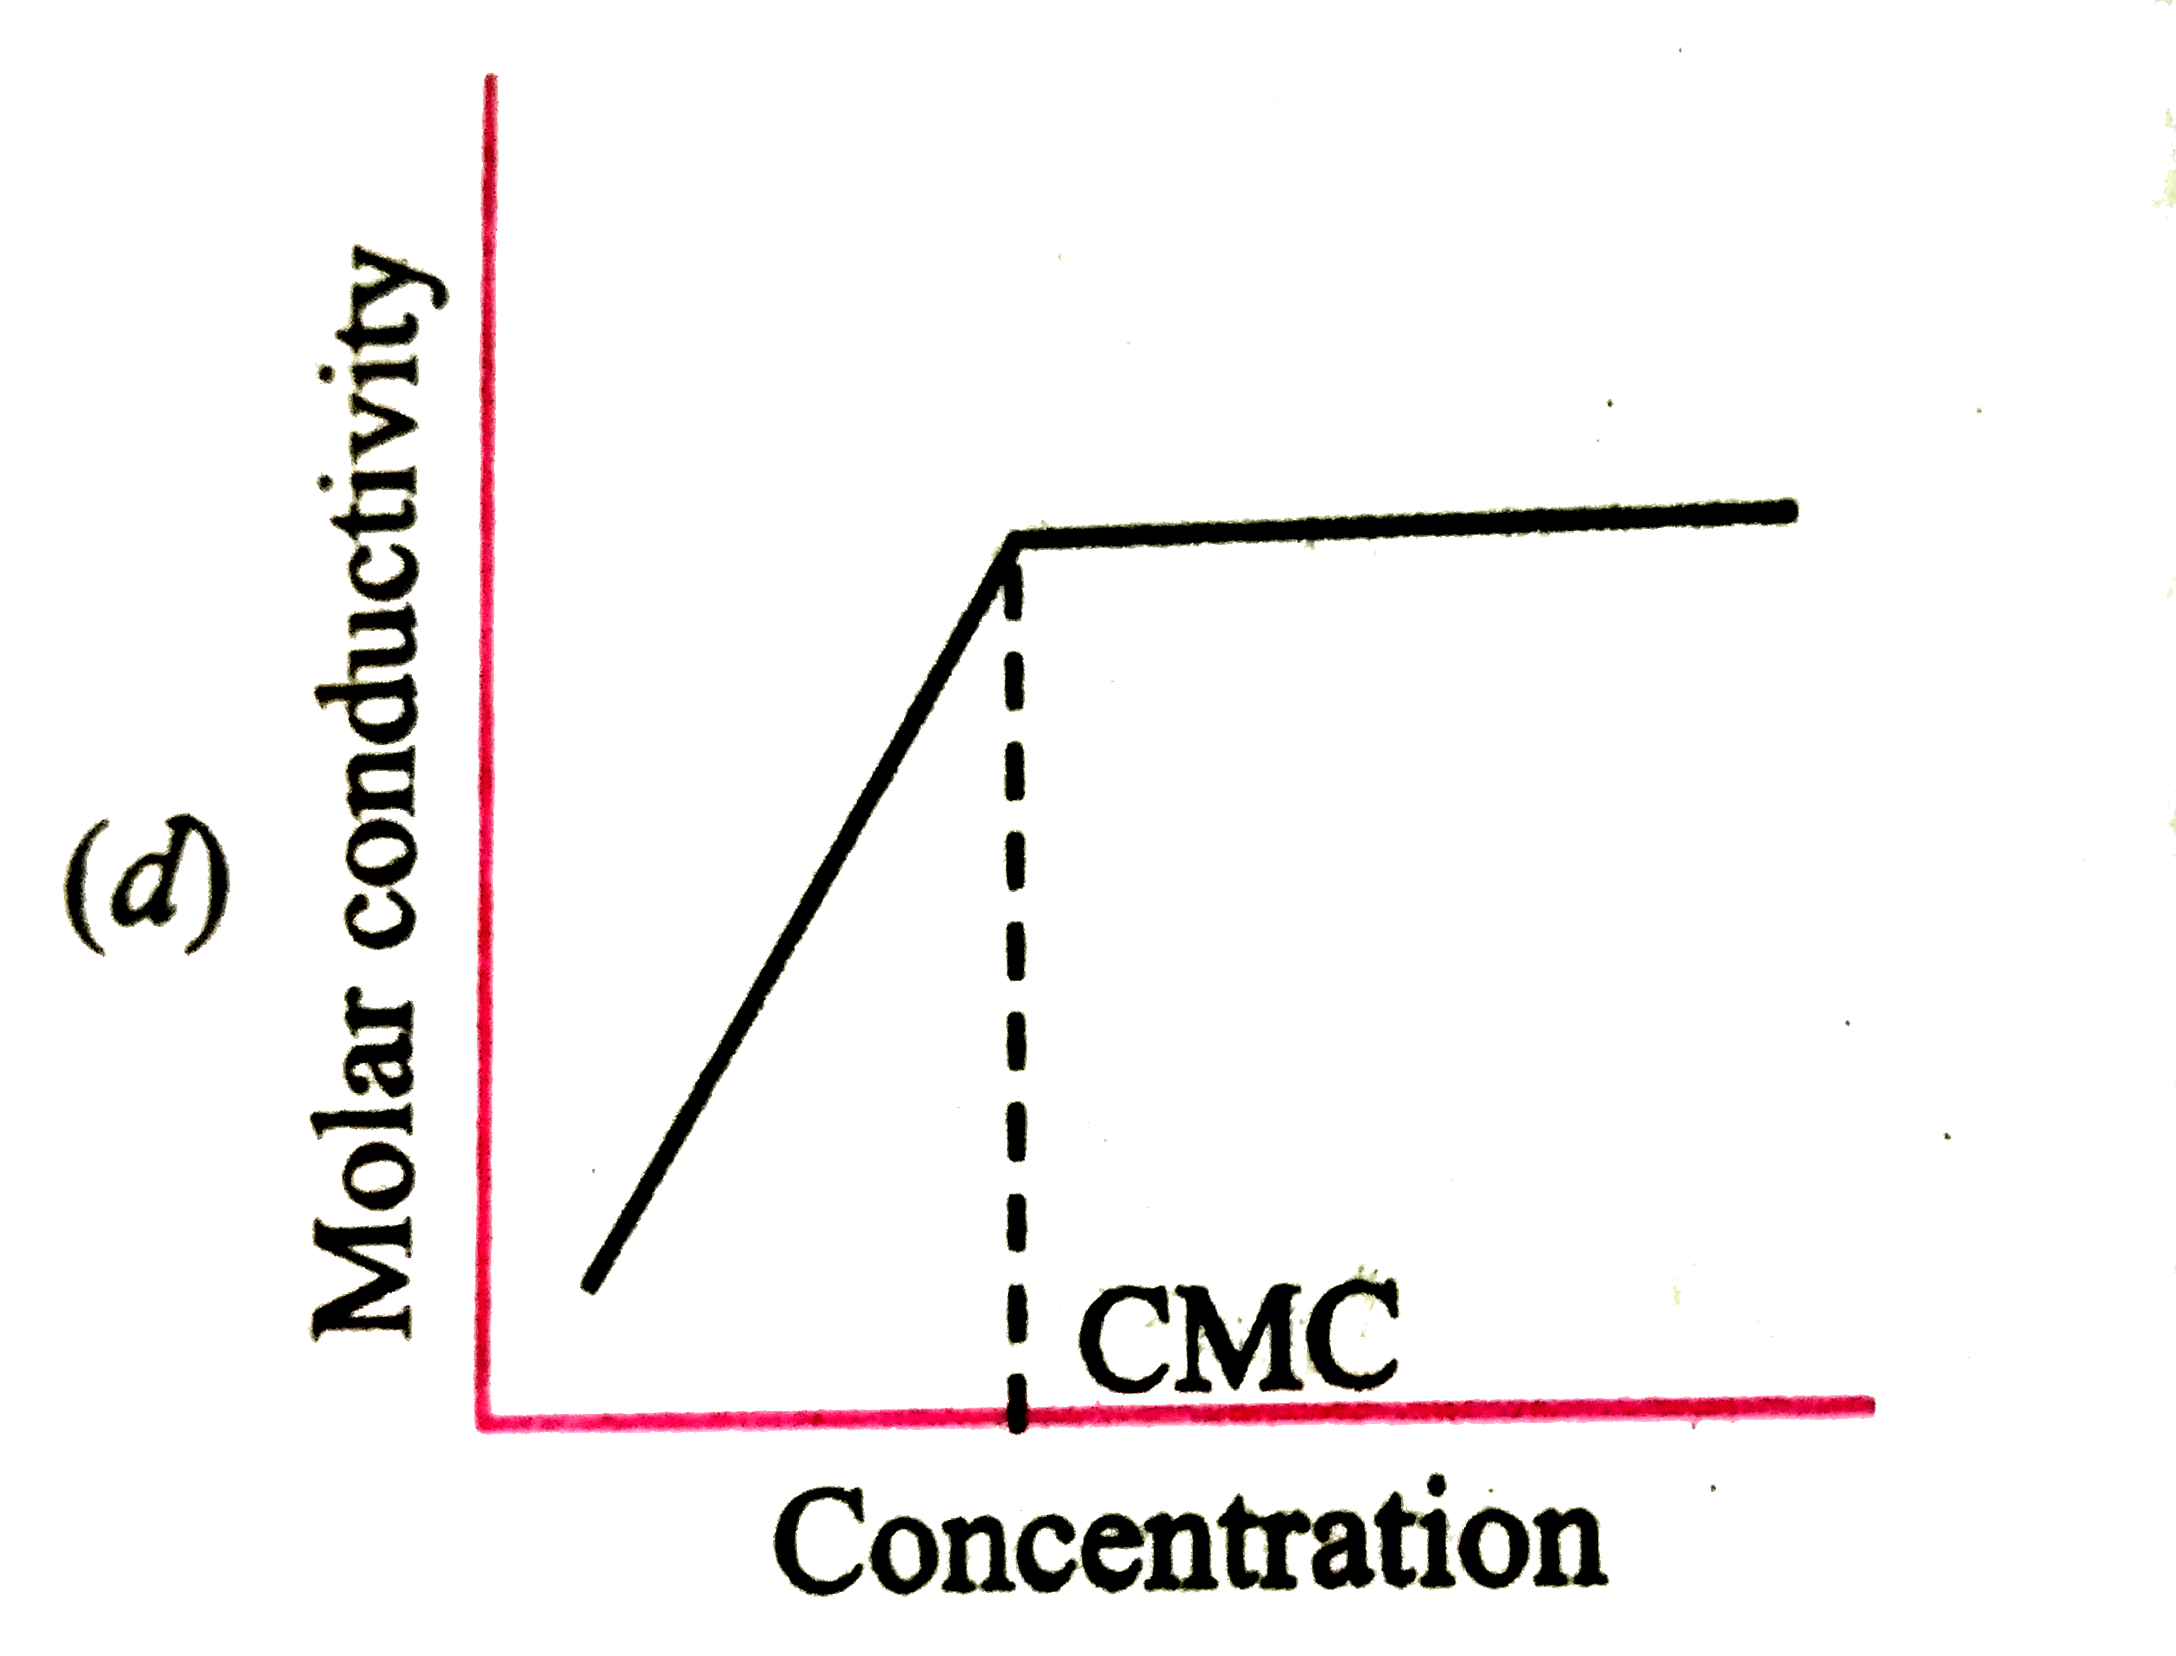
Which of the following plot correctly represents the variation of a concentration of a surfactant (e.g., sodium dodecyl sulphate) versus molar conductivity with regard to behavior art CMC
A
B

C

D
Text Solution
The correct Answer is:A
The molar conductivity veries as shown in plot (a). With increase in concentration below CMC, molar conductivity keeps on decreasing. After CMC, the decrease becomes steeper and a discontiunity is observed at CMC.
|
Topper's Solved these Questions
- SURFACE CHEMISTRY BOOK - PRADEEPCHAPTER - SURFACE CHEMISTRY EXERCISE - MULTIPLE CHOICE QUESTIONS
13 Videos
- SURFACE CHEMISTRY BOOK - PRADEEPCHAPTER - SURFACE CHEMISTRY EXERCISE - III. (MULTIPLE CHOICE QUESTIONS)
9 Videos
- SURFACE CHEMISTRY BOOK - PRADEEPCHAPTER - SURFACE CHEMISTRY EXERCISE - COMPETITION FOCUS (MULTIPLE CHOICE QUESTIONS) (II CATALYSIS)
7 Videos
- SOME BASIC CONCEPTS OF CHEMISTRYBOOK - PRADEEPCHAPTER - SOME BASIC CONCEPTS OF CHEMISTRYEXERCISE - Competition (FOCUS) JEE (Main and Advanced)/Medical Entrance SPECIAL (VIII. Assertion-Reason Type Questions)(Type II)
13 Videos
Similar Questions
Knowledge Check
Which of the following plots represents correctly the variation of conductivity with concentration?
A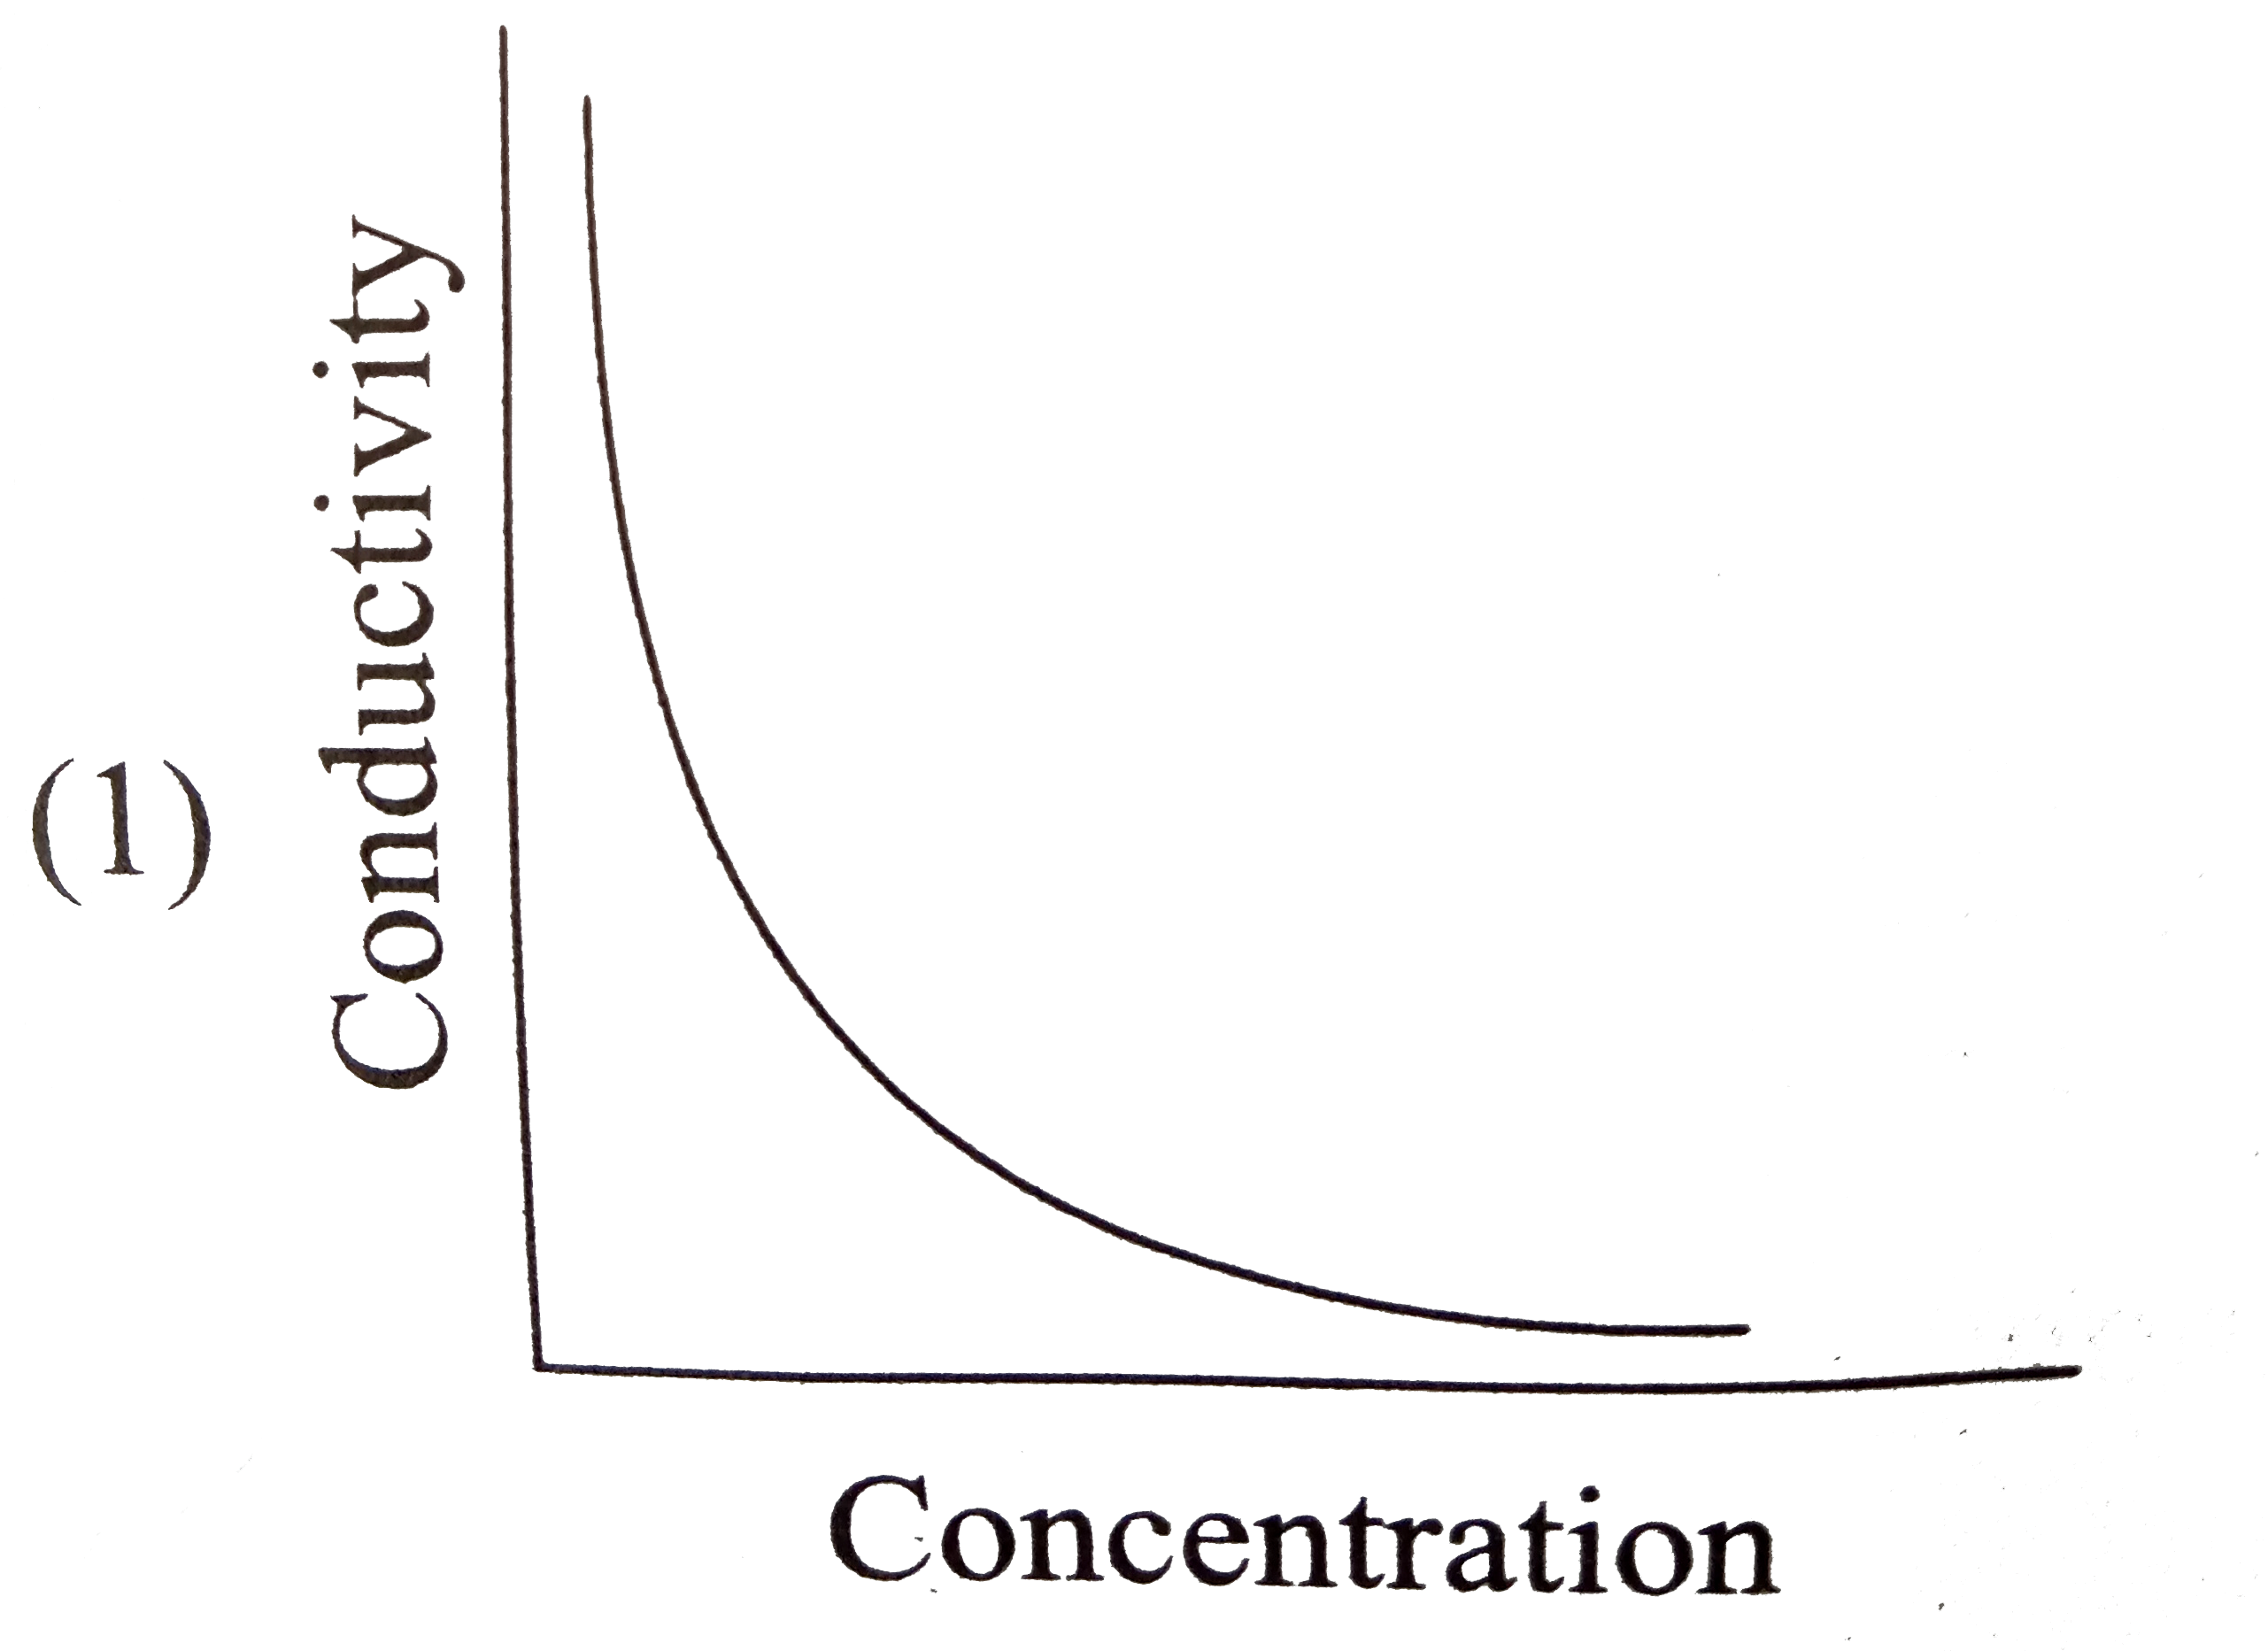 B
B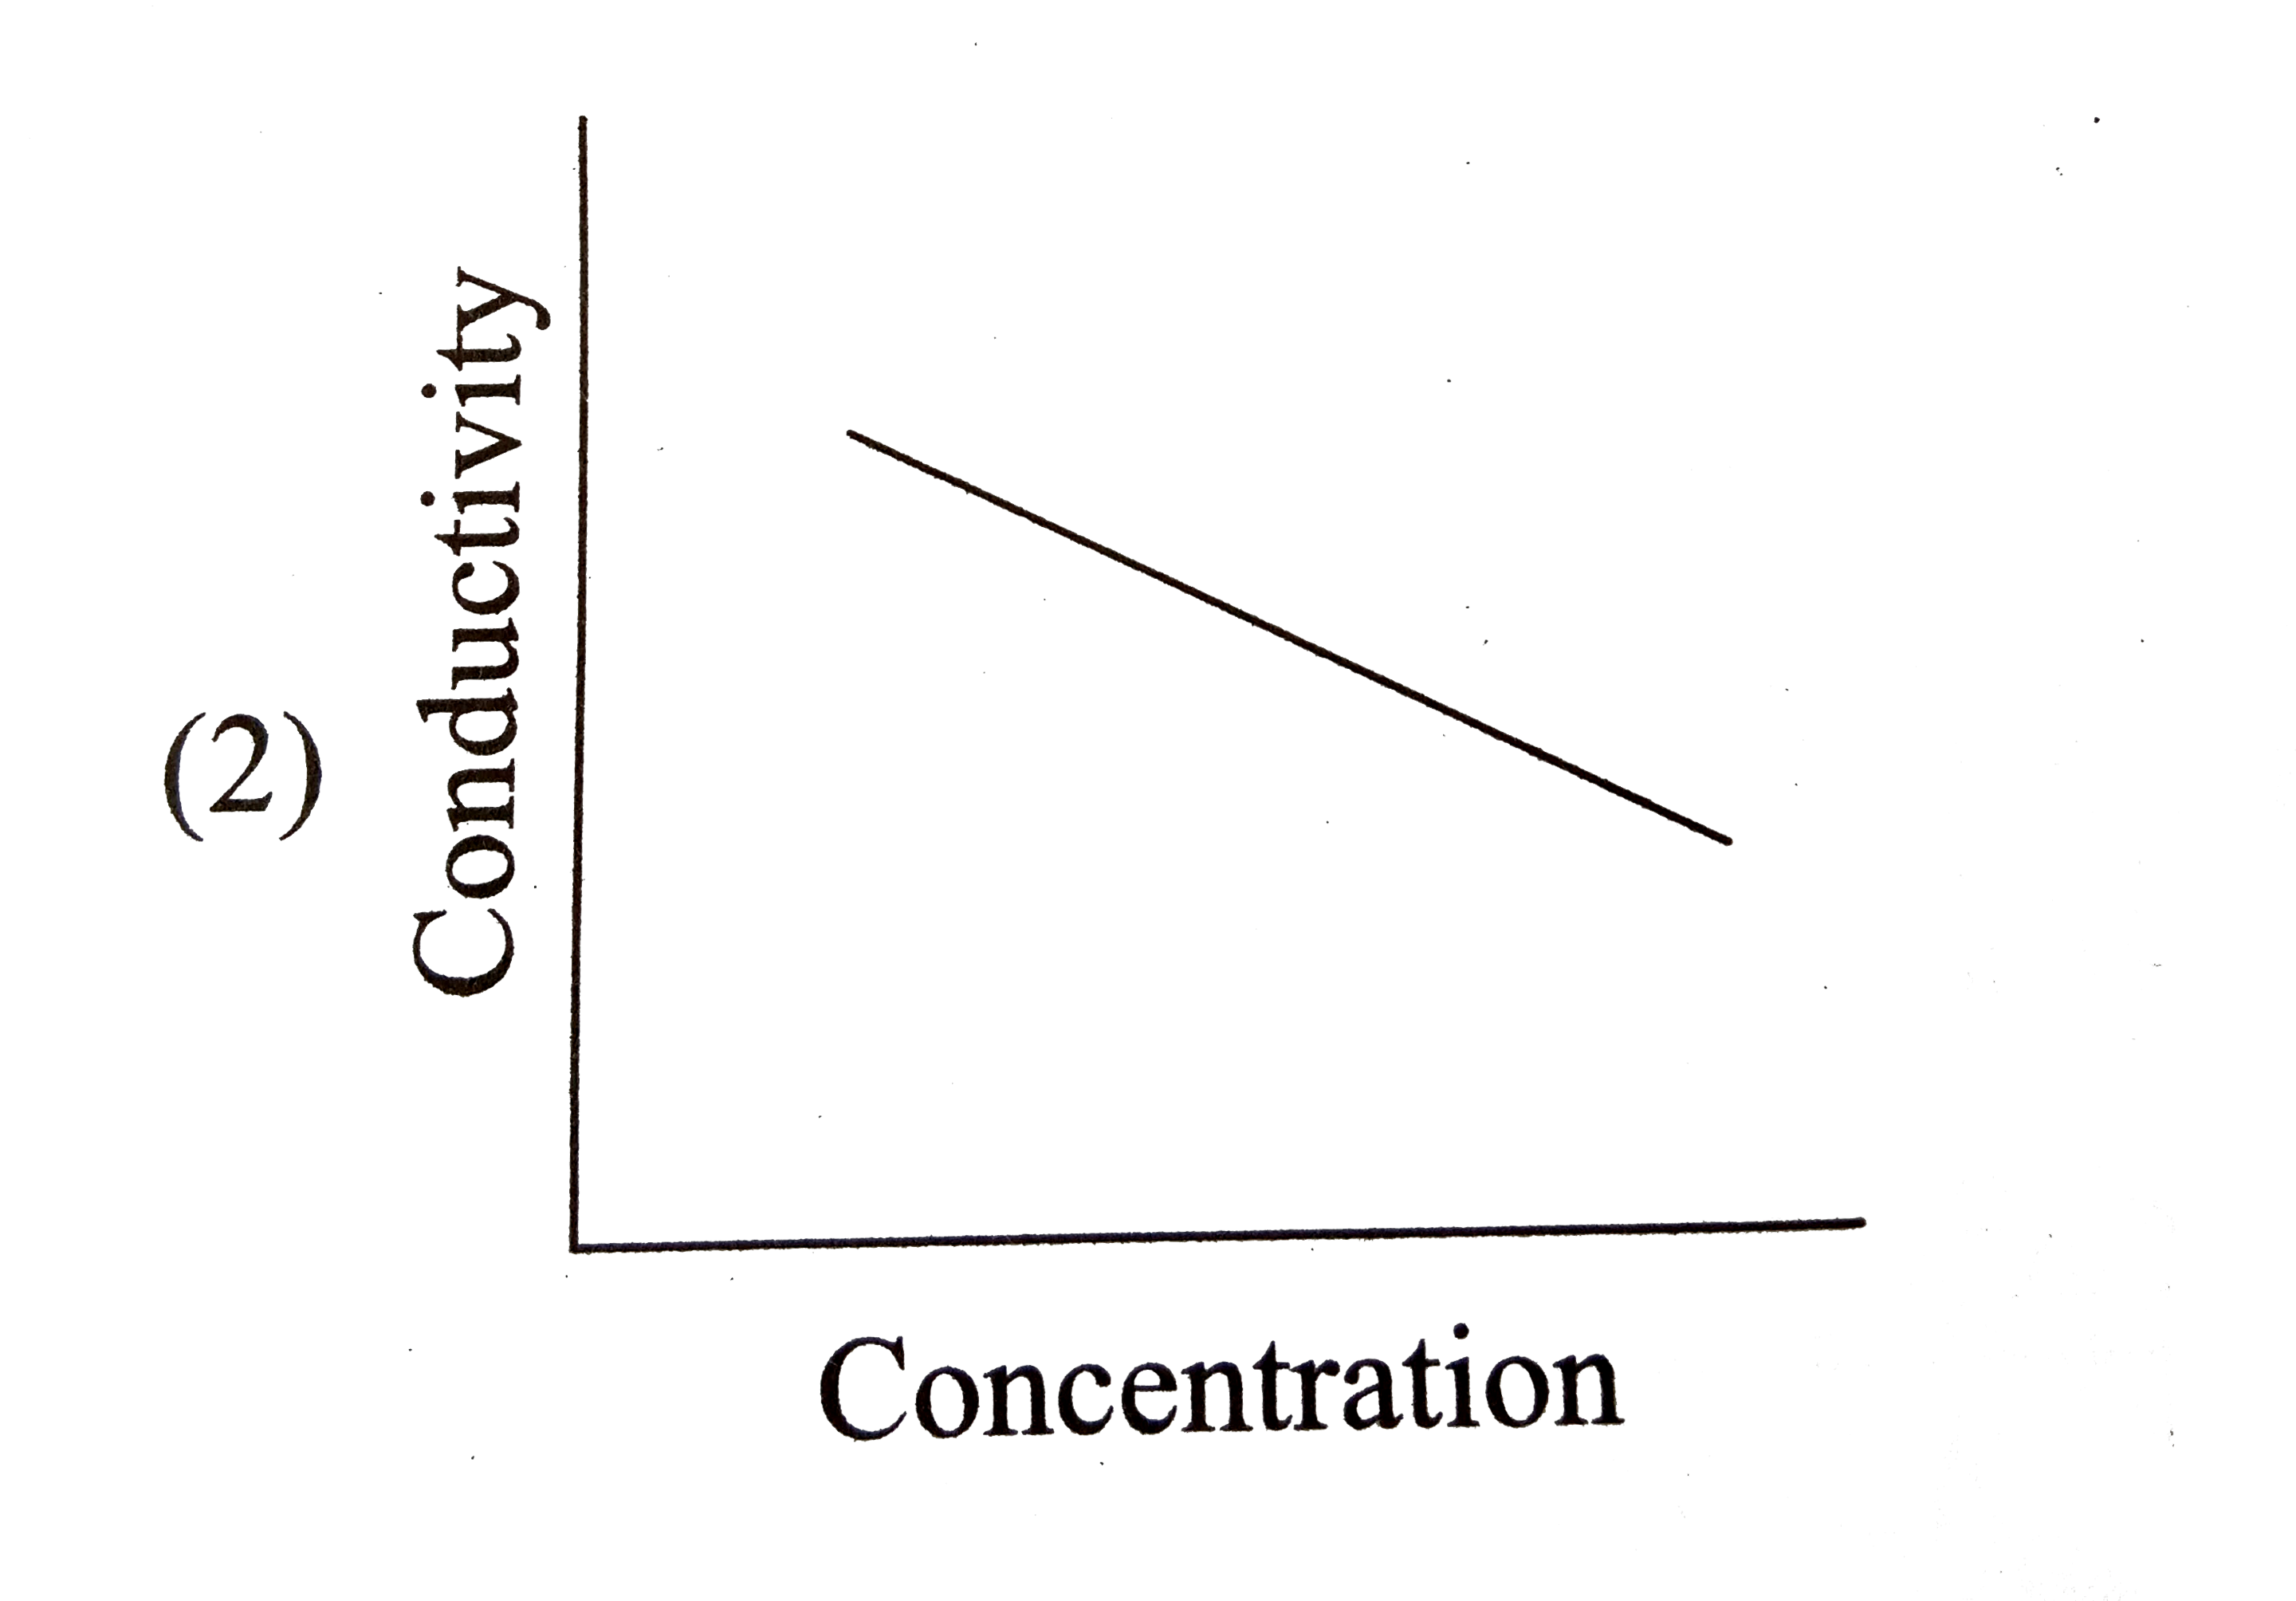 C
C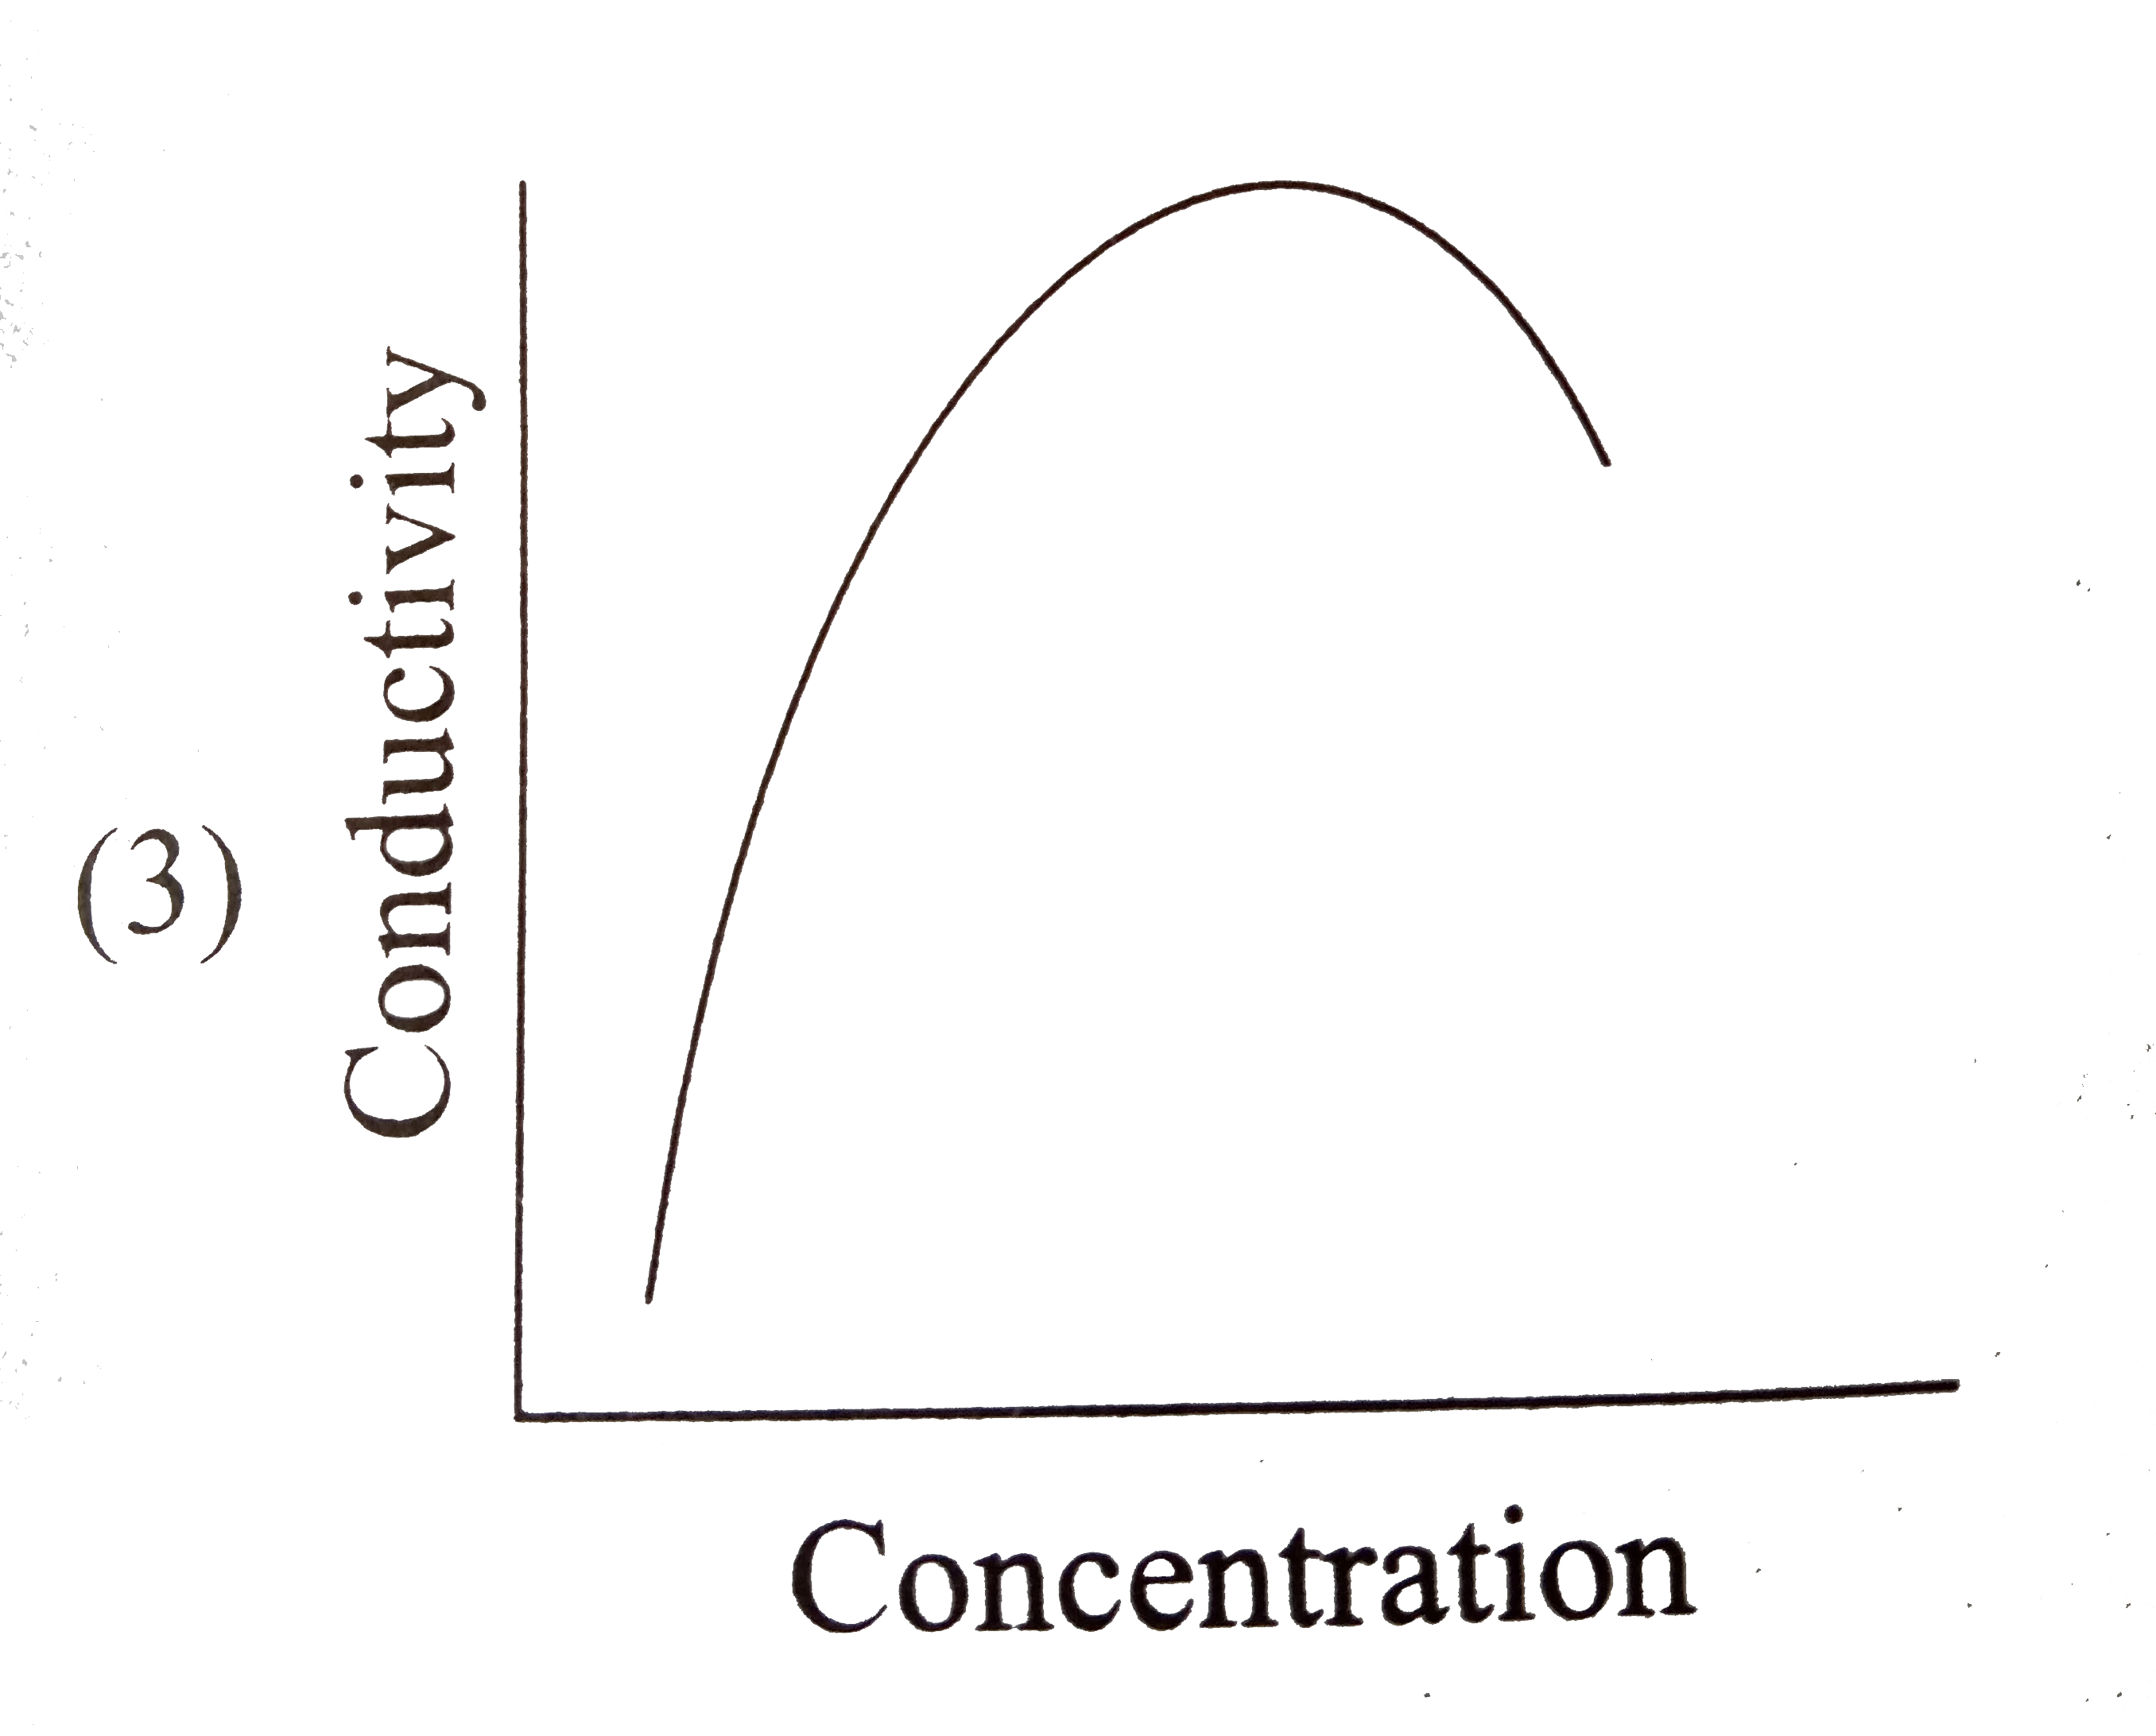 D
D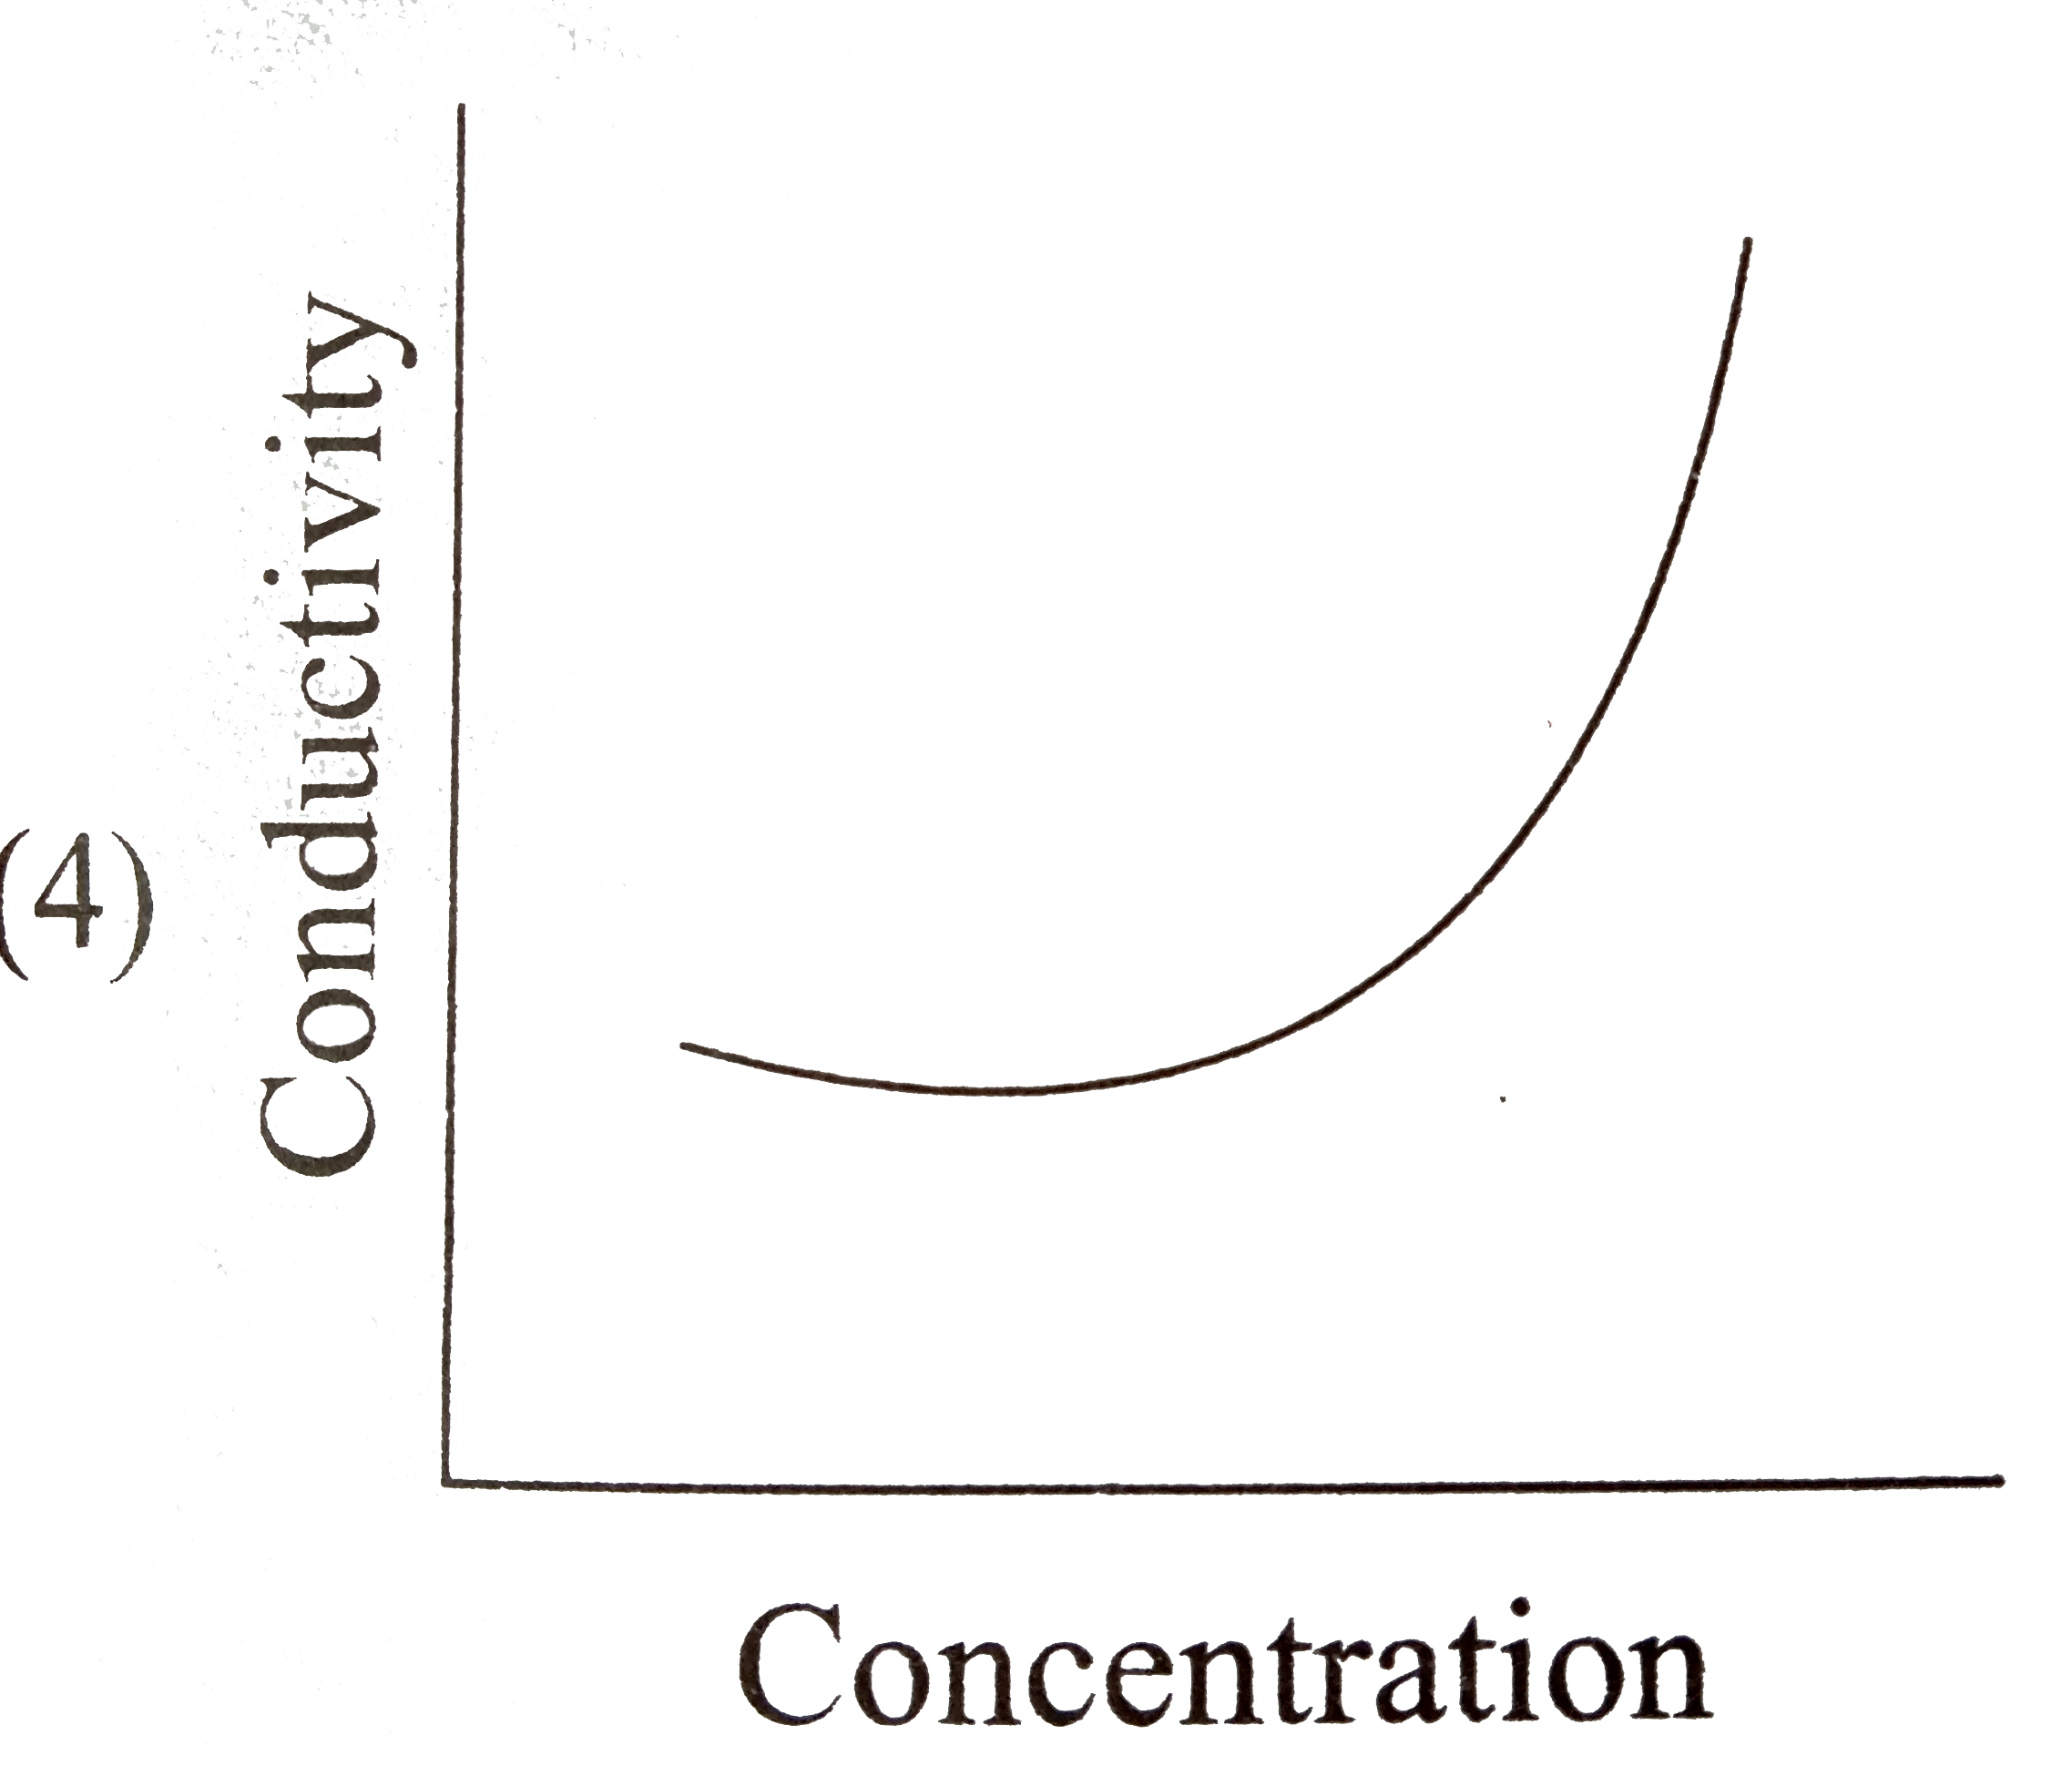
Which of the following graph correctly represents the variation of molar conductance (Δm) with dilution for a strong electrolyte ?
A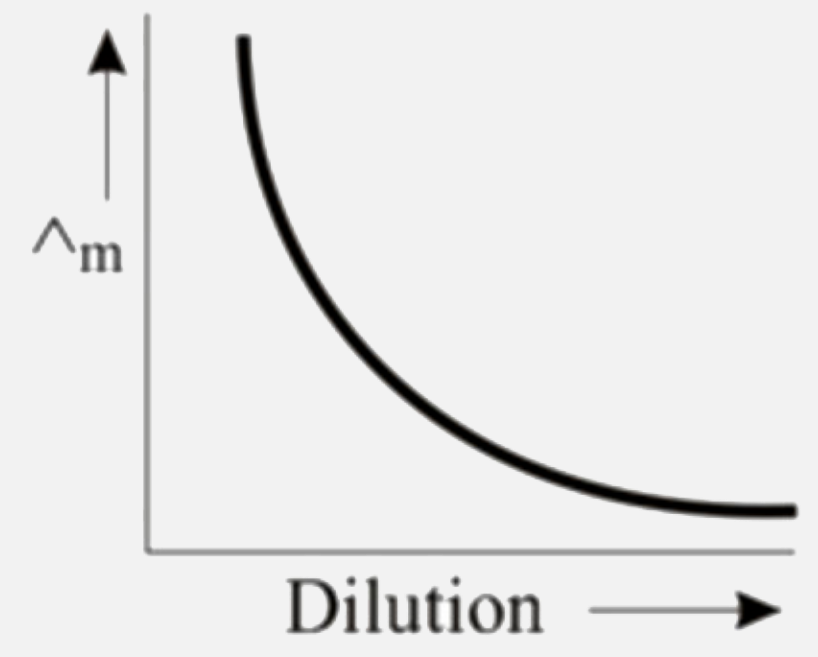 B
B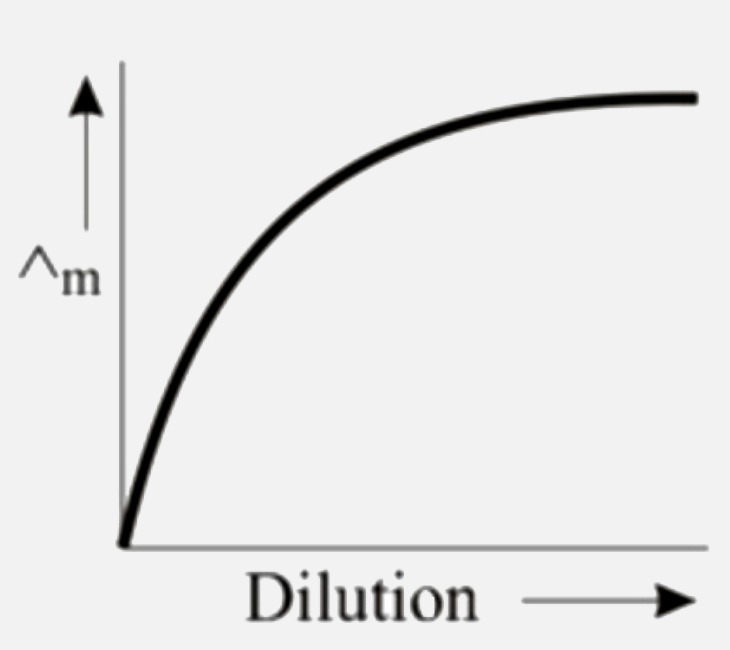 C
C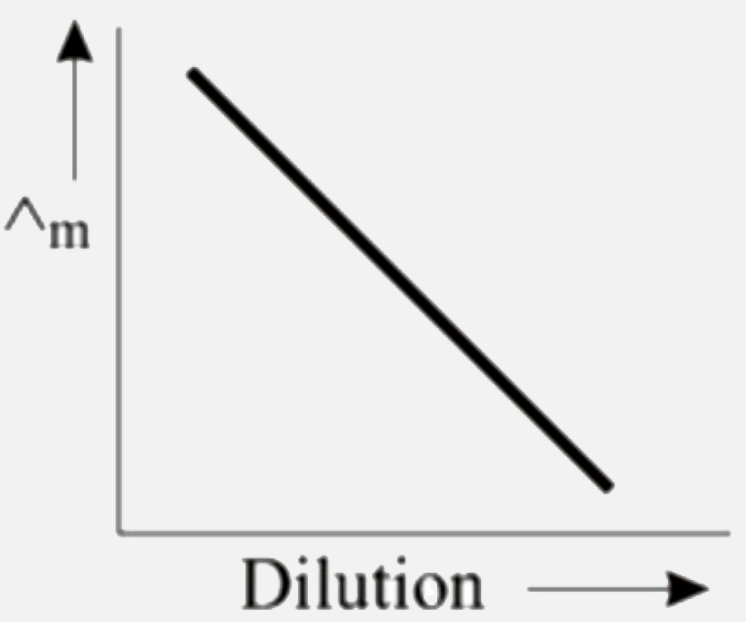 D
D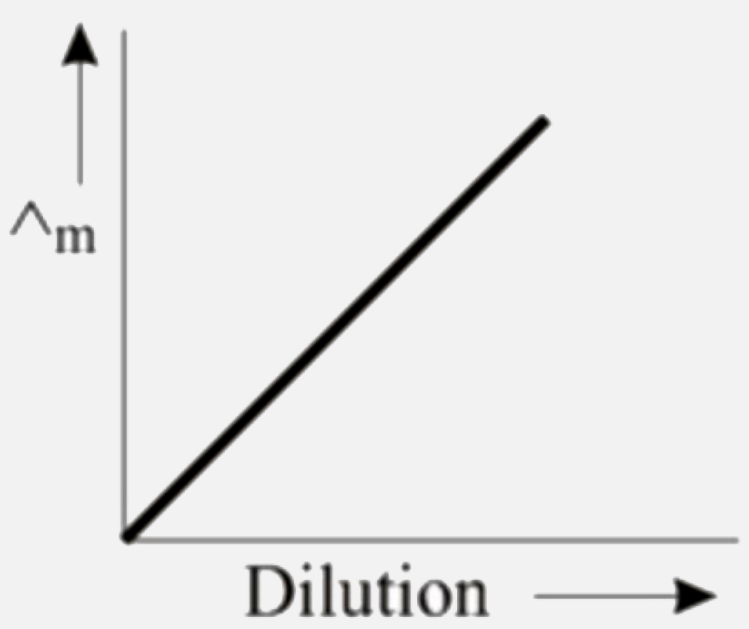
Which one of the following correctly represents the variation between linear momentum (P) and kinetic energy (E) ofa body?
A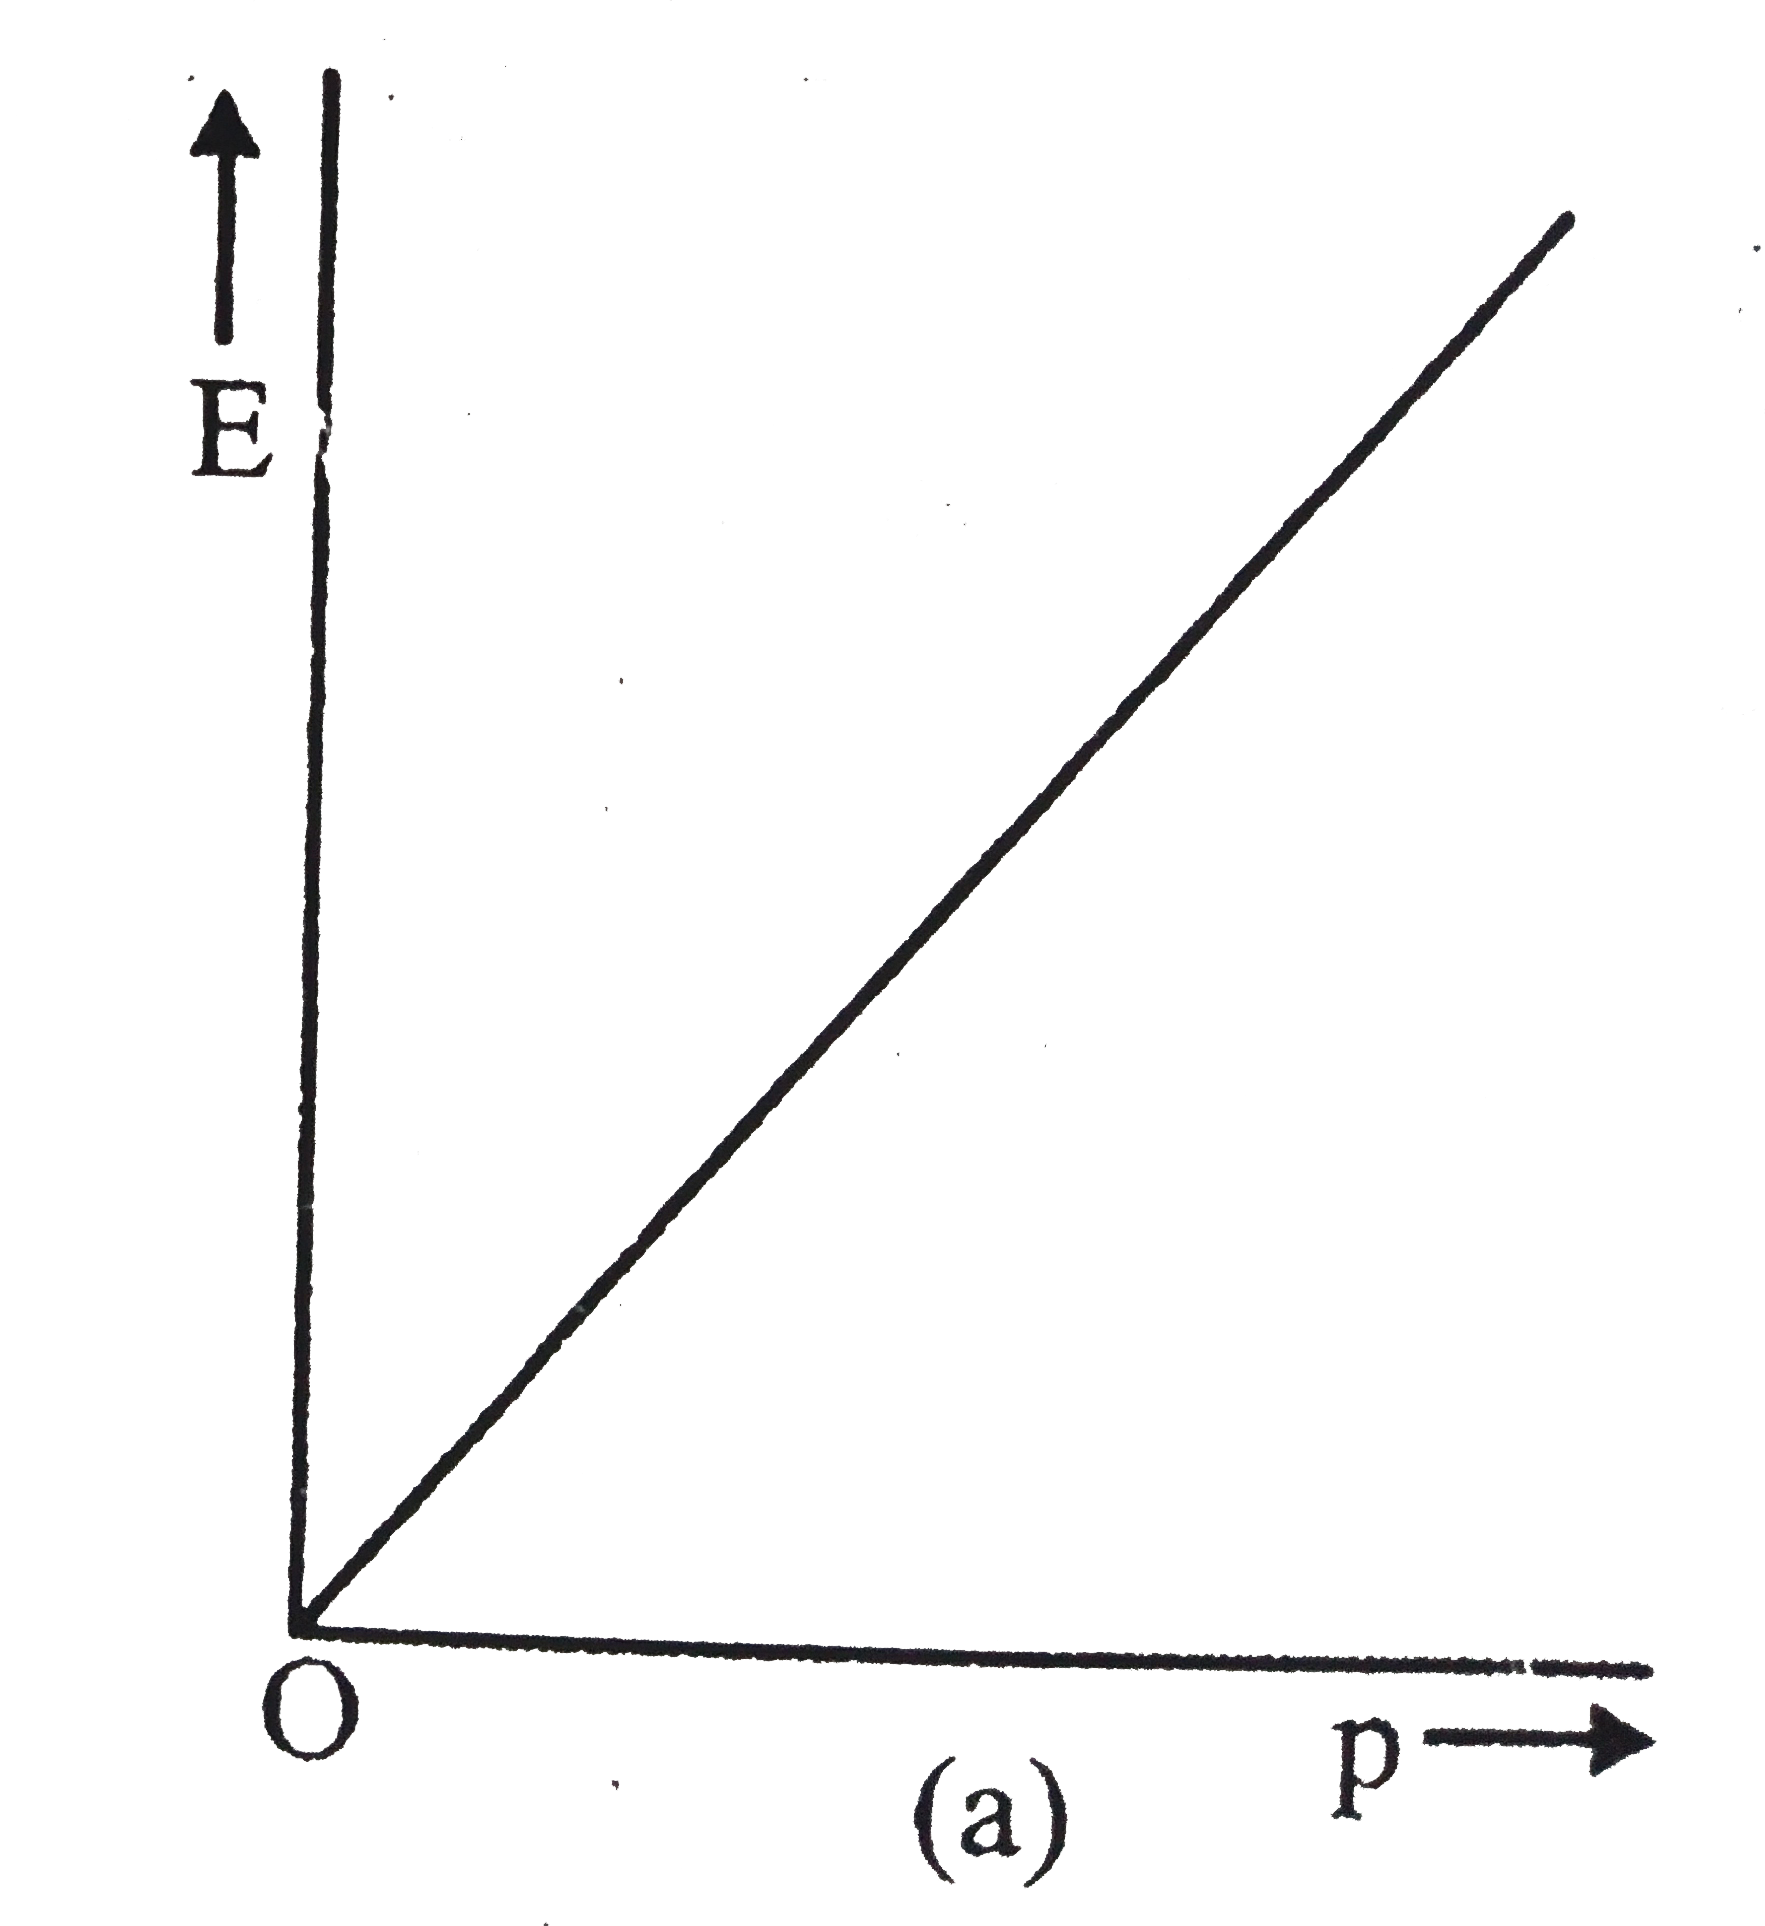 B
B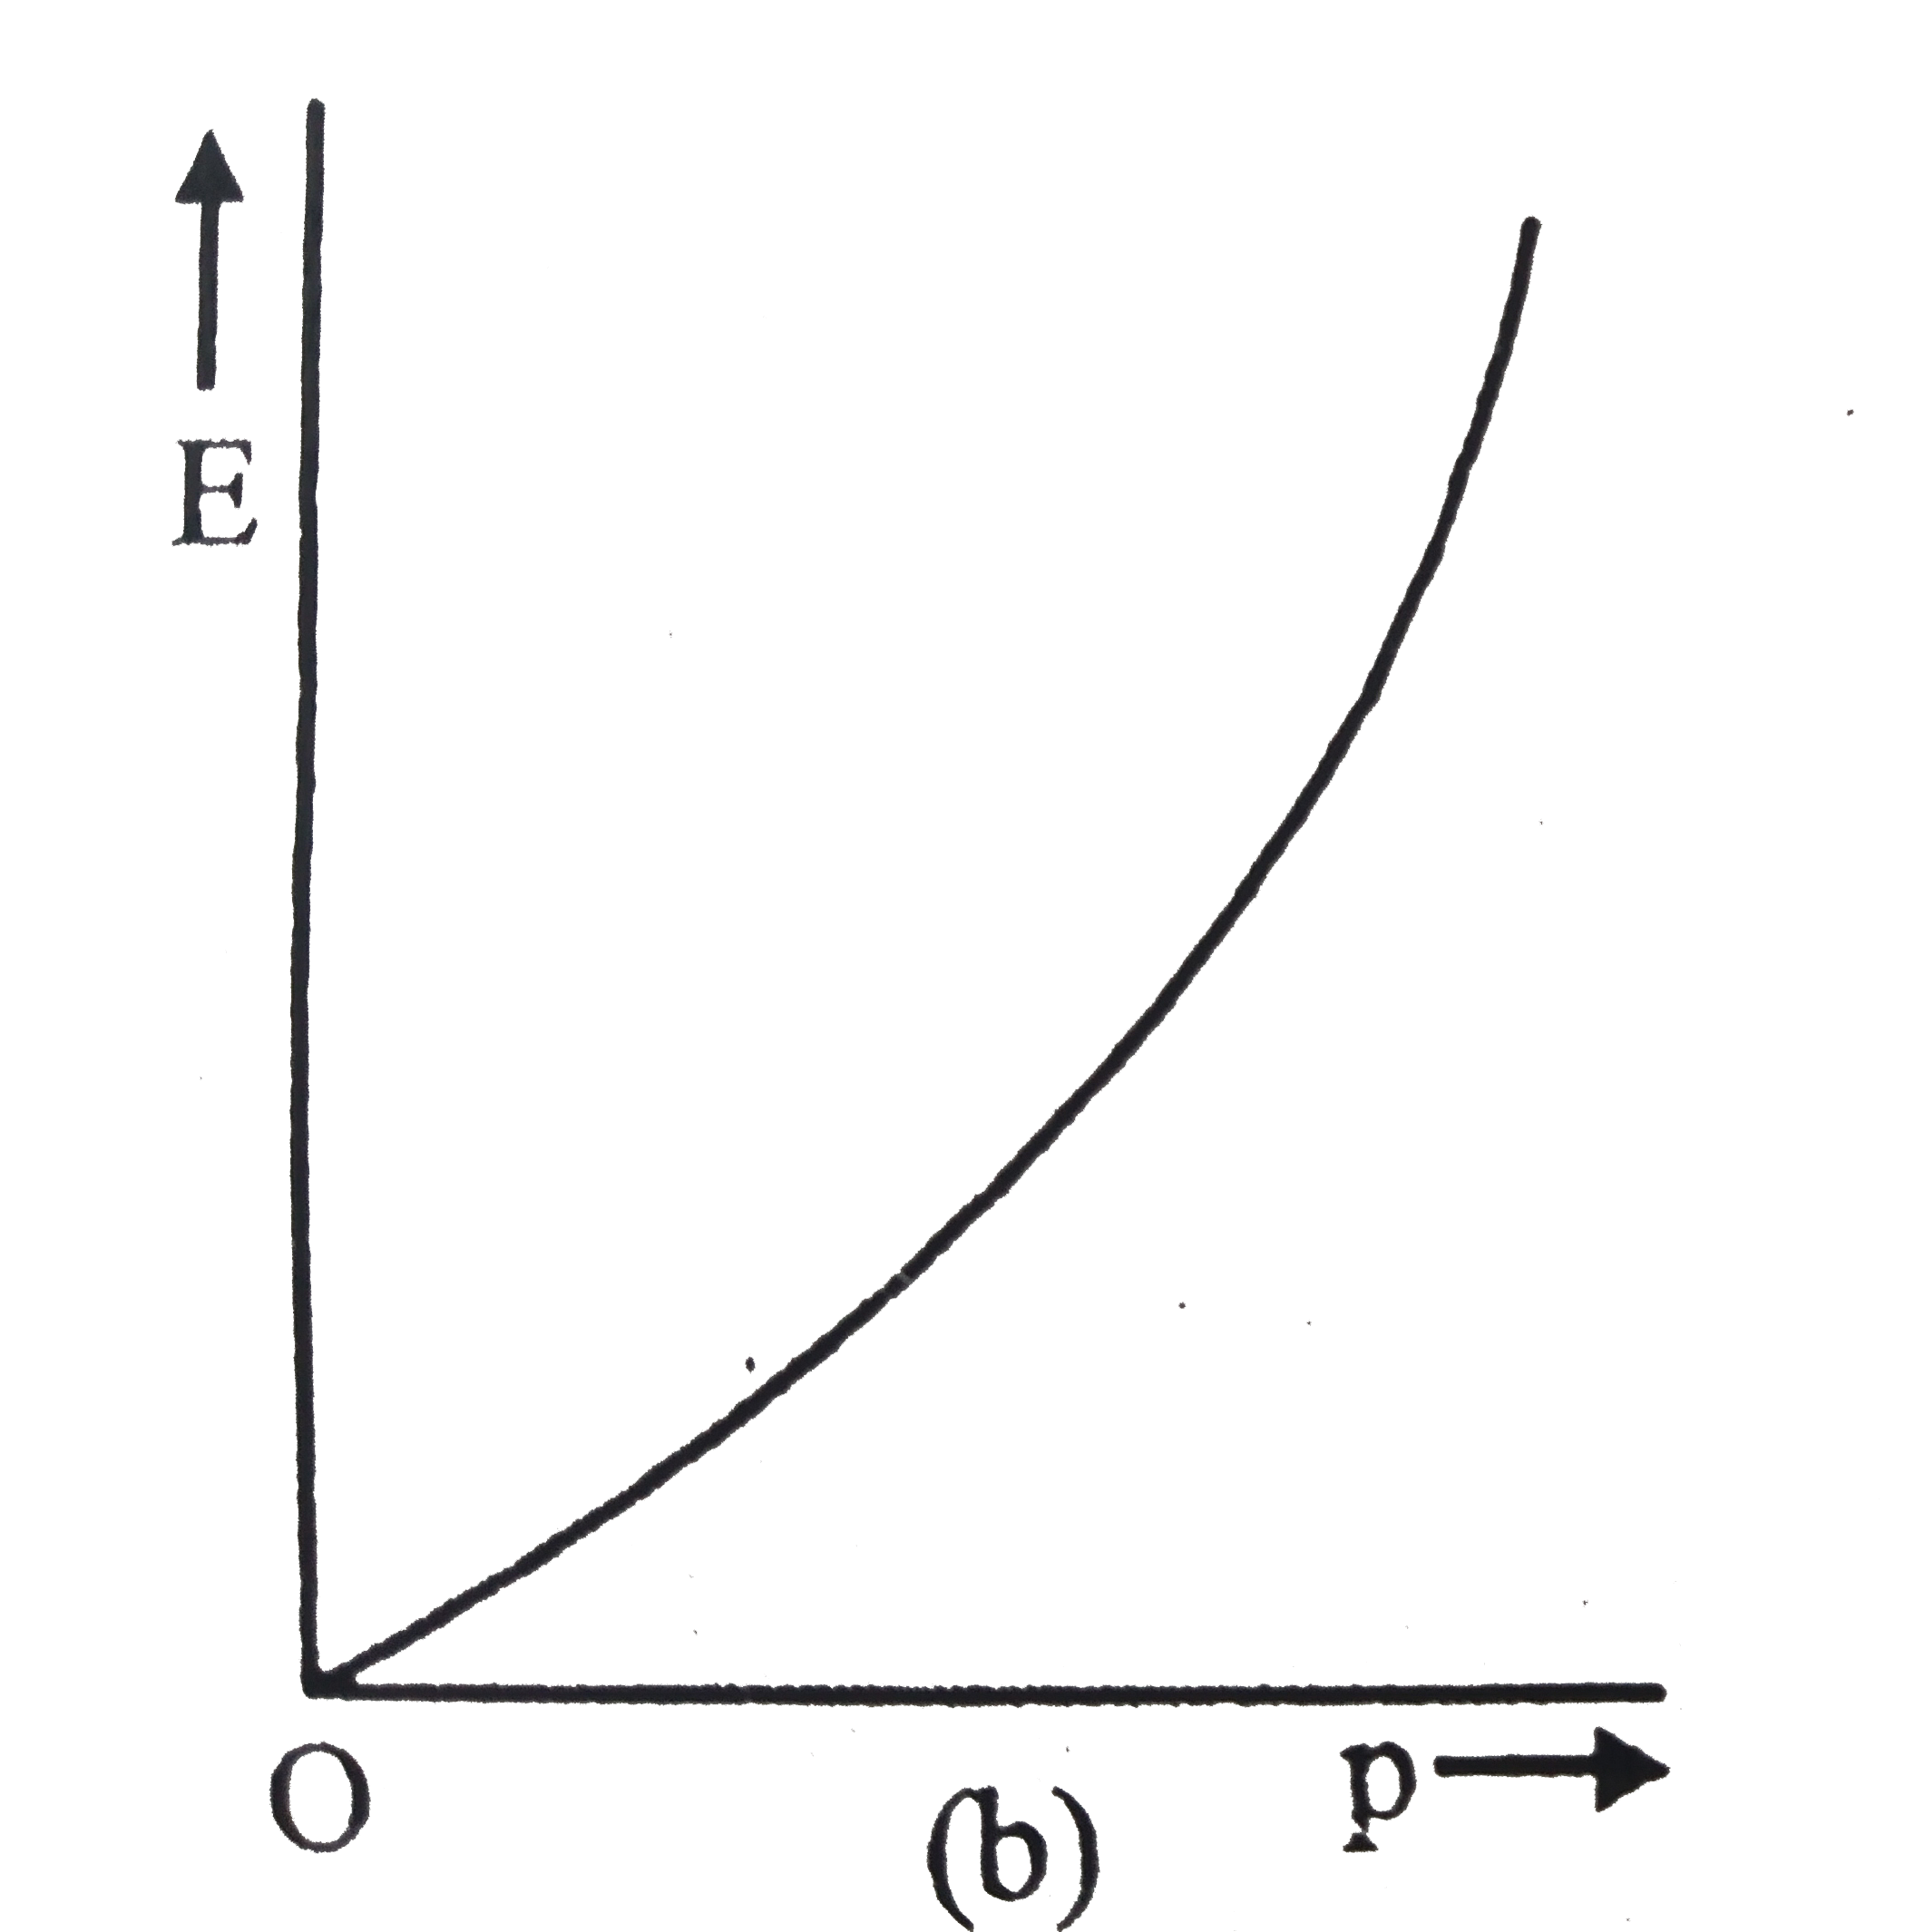 C
C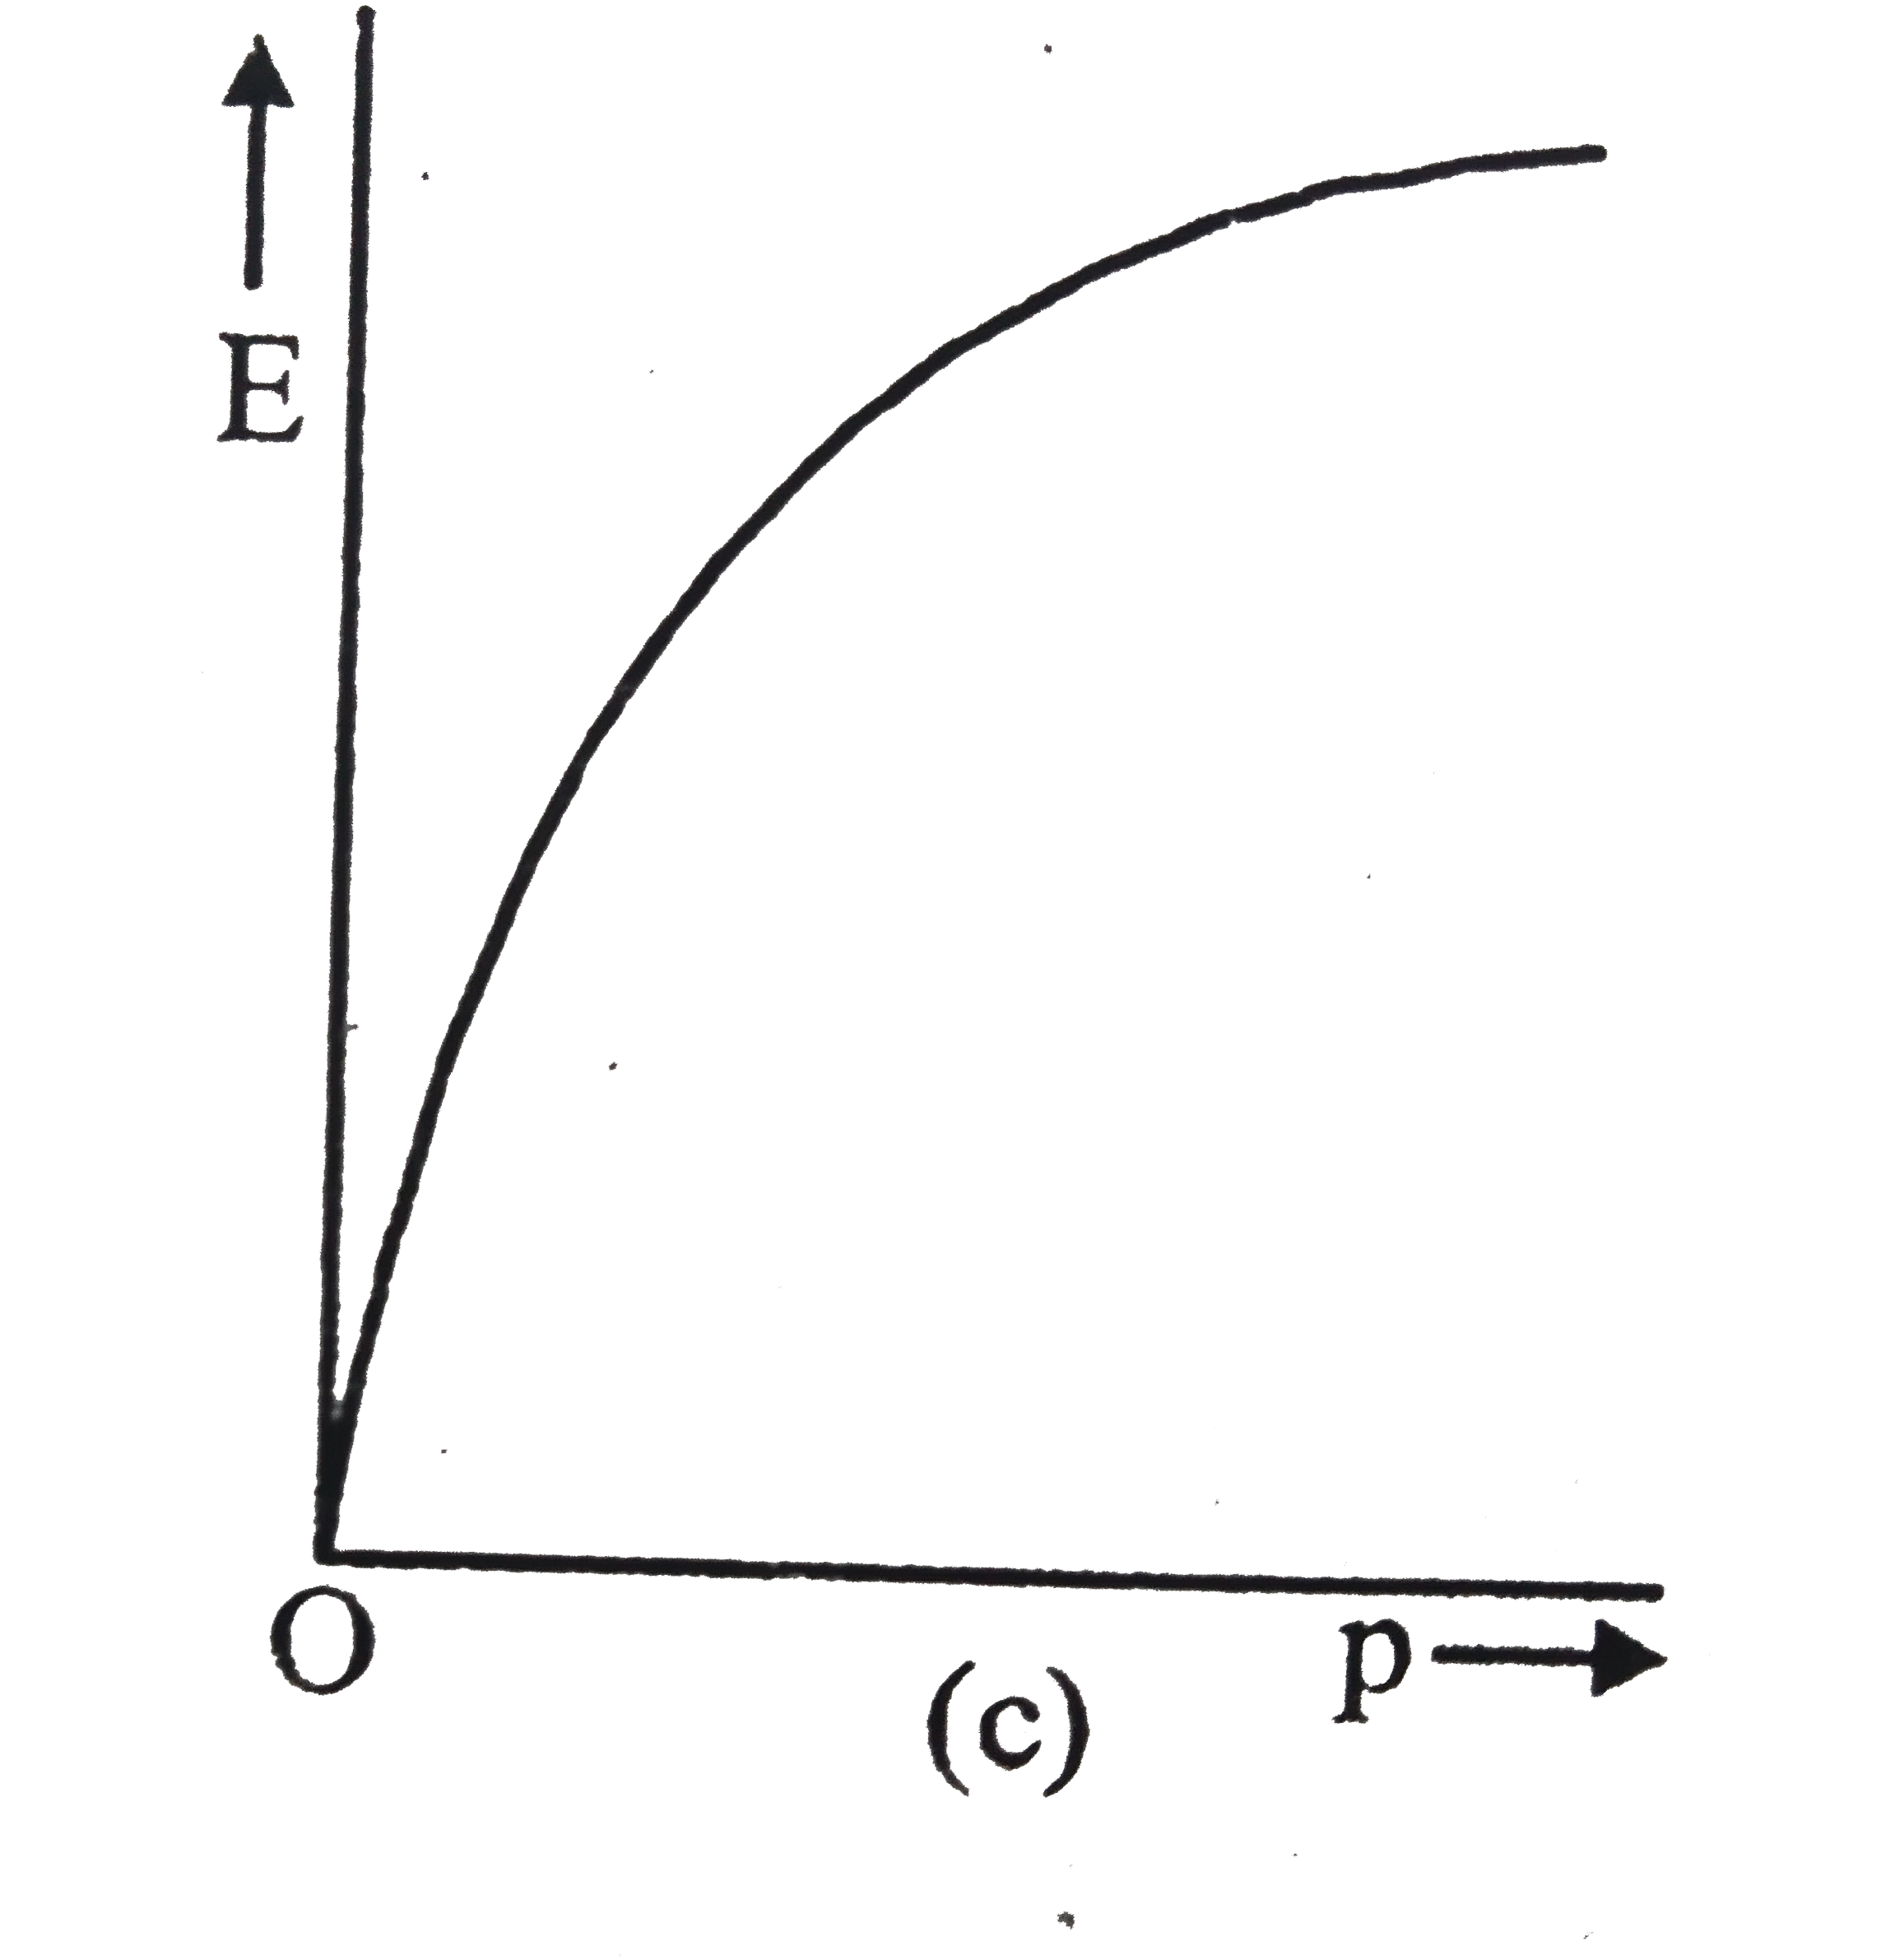 D
D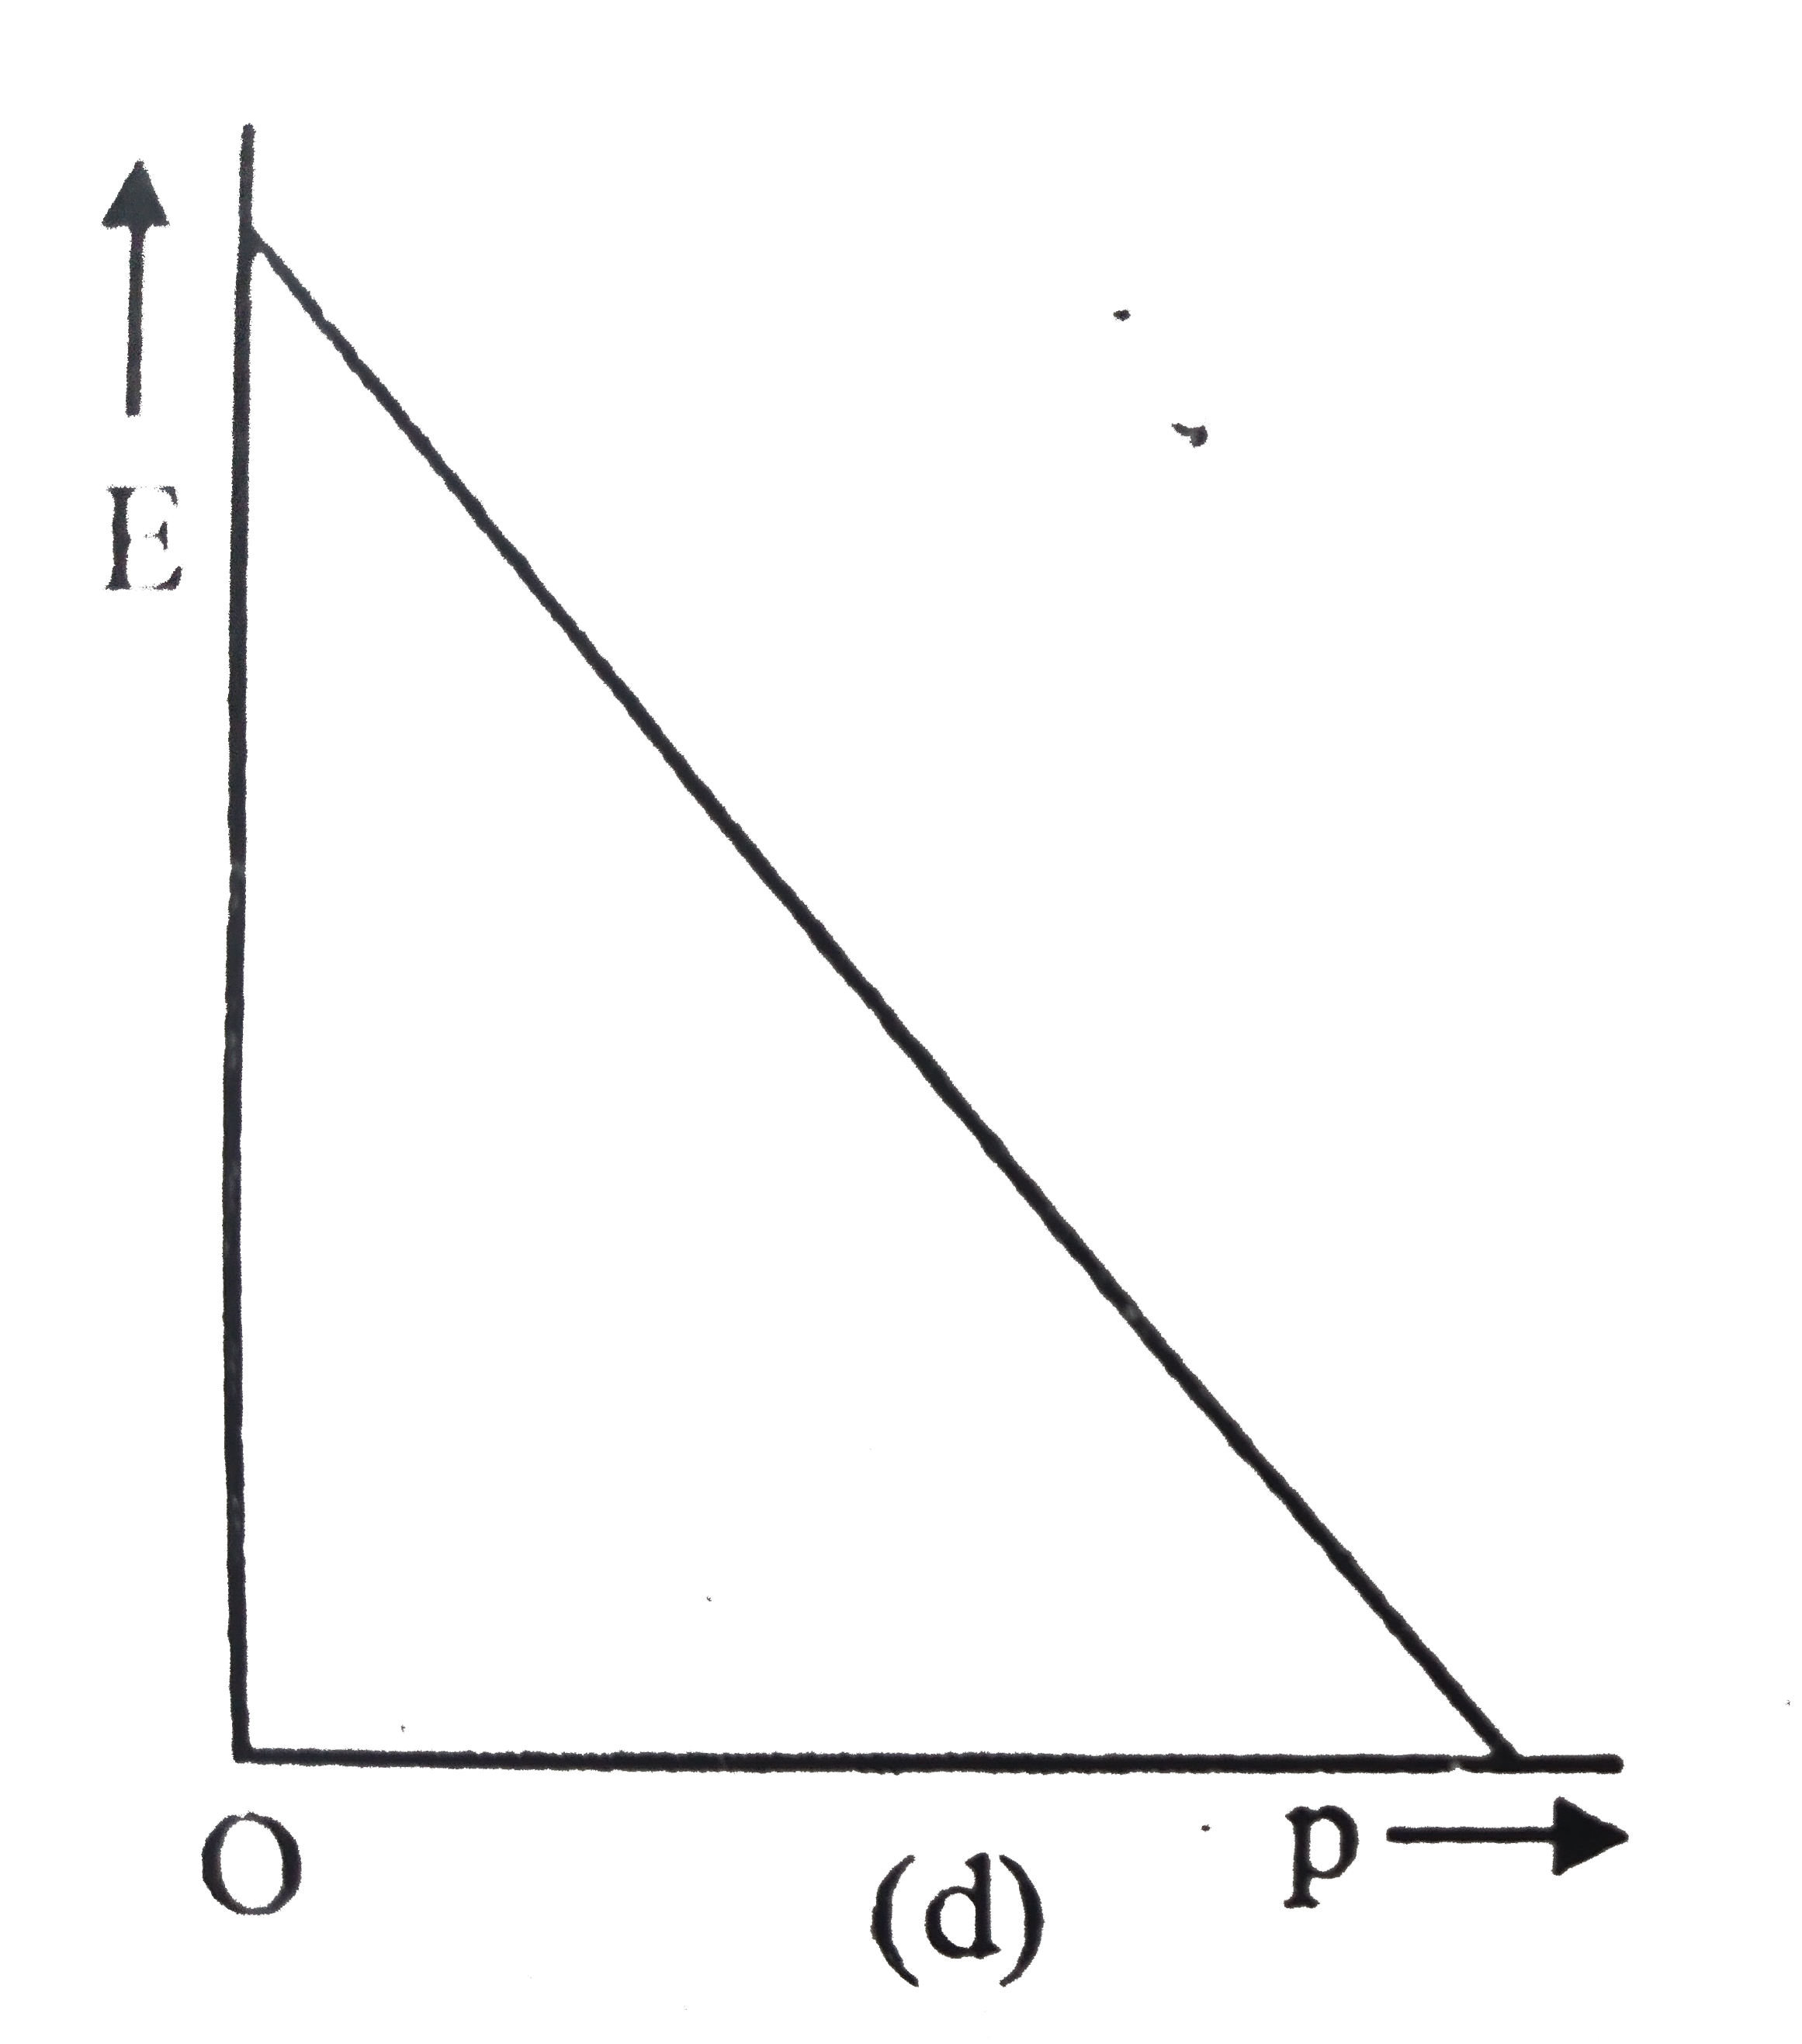
Which of the following plots correctly represents variation of equivalent conductance (∧eq) with dilution for a strong electrolyte ?
View SolutionWhich of the following plots represents correctly the variation of molar conductivity with dilution for a strong electrolyte?
View SolutionWhich of the following plots represents correctly variation of equivalent conductance (Λ) with dilution for a strong electrolyte ?
View SolutionWhich of the following equations correctly represents the temperature variation of energy gap between the conduction and valence bands for Si?
View SolutionWhich of the following equations correctly represents the temperature variation of energy gap between the conduction and valence bands for Si?
View Solution
