Which of the following plots is/are correct?
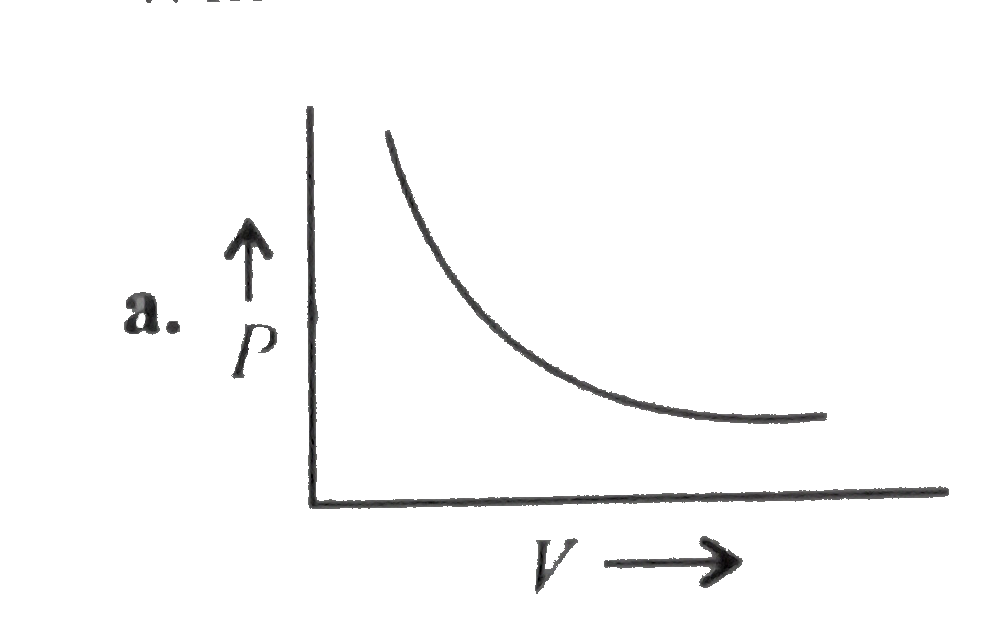
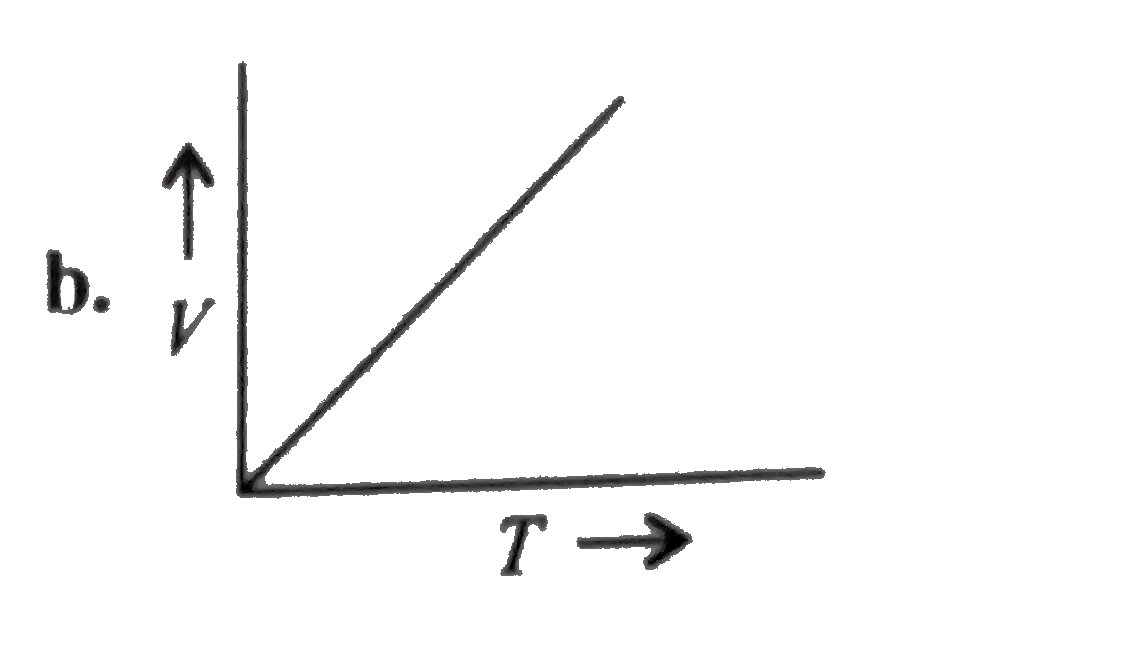
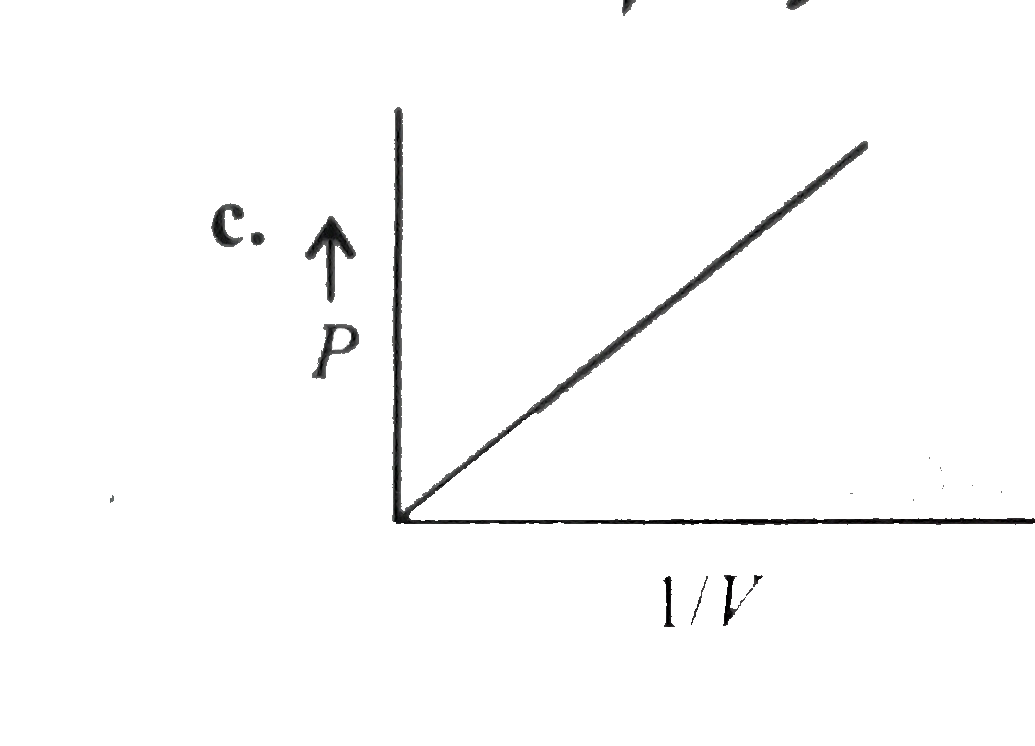
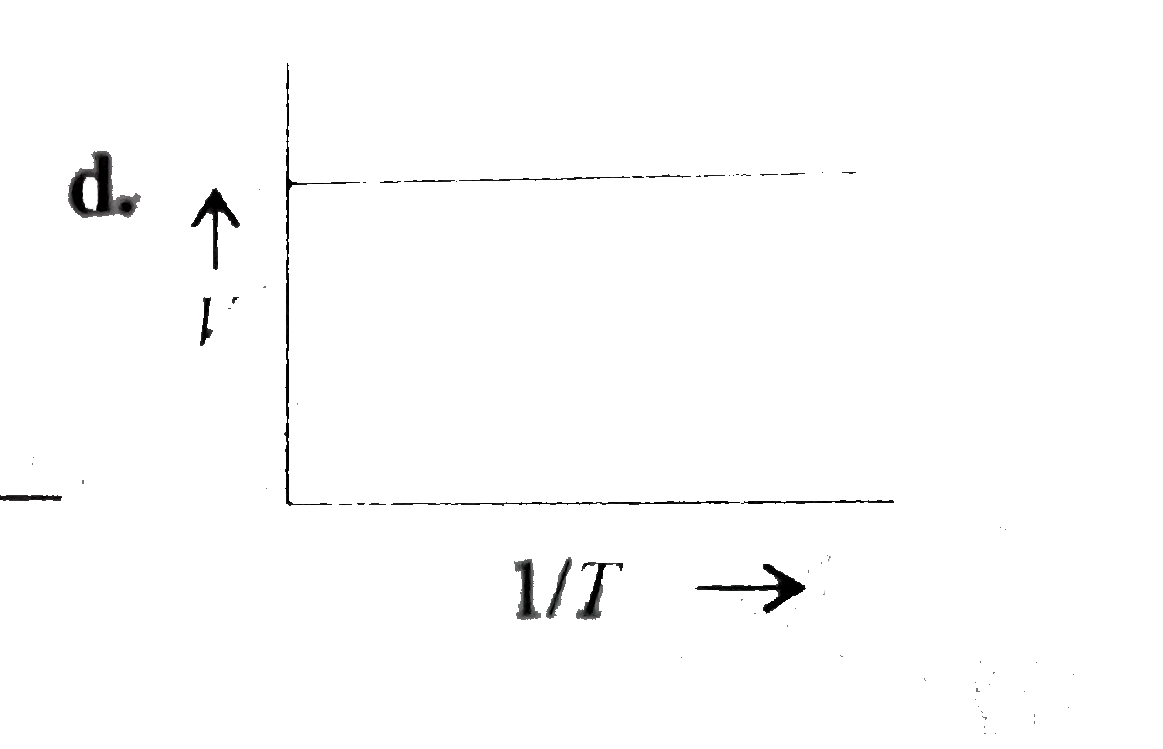
To solve the question regarding which plots are correct, we will analyze the relationships between pressure (P), volume (V), and temperature (T) based on the ideal gas law (PV = nRT).
1. Understanding the Ideal Gas Law:
The ideal gas law states that PV = nRT, where P is pressure, V is volume, n is the number of moles of gas, R is the ideal gas constant, and T is temperature.
2. Analyzing Graph A:
- Graph A shows the relationship between pressure (P) and volume (V) at constant temperature (T) and fixed amount of gas (n).
- According to the ideal gas law, if T and n are constant, then P is inversely proportional to V (P ∝ 1/V).
- Therefore, Graph A is correct.
3. Analyzing Graph B:
- Graph B is not explicitly mentioned in the transcript, but we will assume it is not correct based on the analysis of other graphs.
4. Analyzing Graph C:
- Similar to Graph A, Graph C also shows the relationship between pressure (P) and volume (V) at constant temperature.
- Since it also indicates that P is inversely proportional to V, Graph C is correct.
5. Analyzing Graph D:
- Graph D shows the relationship between volume (V) and temperature (T) at constant pressure (P).
- According to Charles's Law, if pressure is constant, then volume is directly proportional to temperature (V ∝ T).
- Therefore, if Graph D shows an increasing trend for both V and T, it is correct.
6. Analyzing Graph E:
- Graph E shows the relationship between volume (V) and 1/T.
- If V is constant, then as T increases, 1/T decreases, which means V cannot remain constant while T increases.
- Therefore, Graph E is incorrect.
Conclusion:
The correct plots based on the analysis are Graphs A, C, and D. Graph E is incorrect.
Final Answer:
The correct options for the question are Graphs A, C, and D.
The ideal gas law states that PV = nRT, where P is pressure, V is volume, n is the number of moles of gas, R is the ideal gas constant, and T is temperature.
- Graph A shows the relationship between pressure (P) and volume (V) at constant temperature (T) and fixed amount of gas (n).
- According to the ideal gas law, if T and n are constant, then P is inversely proportional to V (P ∝ 1/V).
- Therefore, Graph A is correct.
- Graph B is not explicitly mentioned in the transcript, but we will assume it is not correct based on the analysis of other graphs.
- Similar to Graph A, Graph C also shows the relationship between pressure (P) and volume (V) at constant temperature.
- Since it also indicates that P is inversely proportional to V, Graph C is correct.
- Graph D shows the relationship between volume (V) and temperature (T) at constant pressure (P).
- According to Charles's Law, if pressure is constant, then volume is directly proportional to temperature (V ∝ T).
- Therefore, if Graph D shows an increasing trend for both V and T, it is correct.
- Graph E shows the relationship between volume (V) and 1/T.
- If V is constant, then as T increases, 1/T decreases, which means V cannot remain constant while T increases.
- Therefore, Graph E is incorrect.
The correct plots based on the analysis are Graphs A, C, and D. Graph E is incorrect.
The correct options for the question are Graphs A, C, and D.
Topper's Solved these Questions
- STATES OF MATTERBOOK - CENGAGE CHEMISTRY ENGLISHCHAPTER - STATES OF MATTEREXERCISE - Exercises (Single Correct)
85 Videos
- STATES OF MATTERBOOK - CENGAGE CHEMISTRY ENGLISHCHAPTER - STATES OF MATTEREXERCISE - Exercises (Assertion-Reasoning)
24 Videos
- STATES OF MATTERBOOK - CENGAGE CHEMISTRY ENGLISHCHAPTER - STATES OF MATTEREXERCISE - Exercises (Linked Comprehensive)
48 Videos
- SOME BASIC CONCEPTS AND MOLE CONCEPTBOOK - CENGAGE CHEMISTRY ENGLISHCHAPTER - SOME BASIC CONCEPTS AND MOLE CONCEPTEXERCISE - Archives Subjective
11 Videos
- STOICHIOMETRYBOOK - CENGAGE CHEMISTRY ENGLISHCHAPTER - STOICHIOMETRYEXERCISE - Archives Subjective
33 Videos
Similar Questions
Knowledge Check
Which of the following plots is/are correct?
A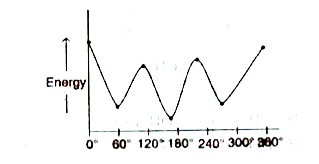 B
B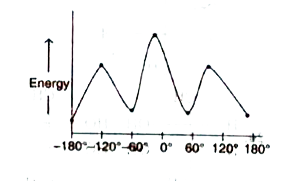 C
C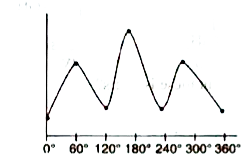 DAll are incorrect
The mass of argon adsorbed per unit mass of carbon surface is plotted against pressure. Which of the following plots is correct if x and m represent the masses of argon and carbon respectively ? (………. Represents extrapolated data)
View SolutionWhich of the following plot is correct about the kinetic energy of photoelectrons ?
View SolutionWhich of the following plot is correct about Maxwell's speed distribution low ?
View SolutionConsider the following plots of rate constant versus 1T for four different reactions. Which of the following orders is correct for the activation energies of these reactions ?
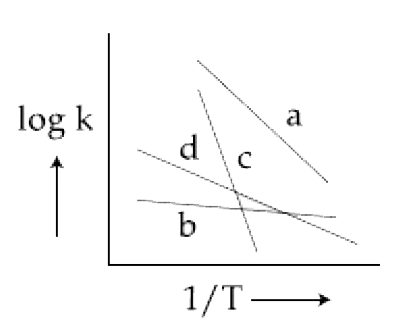
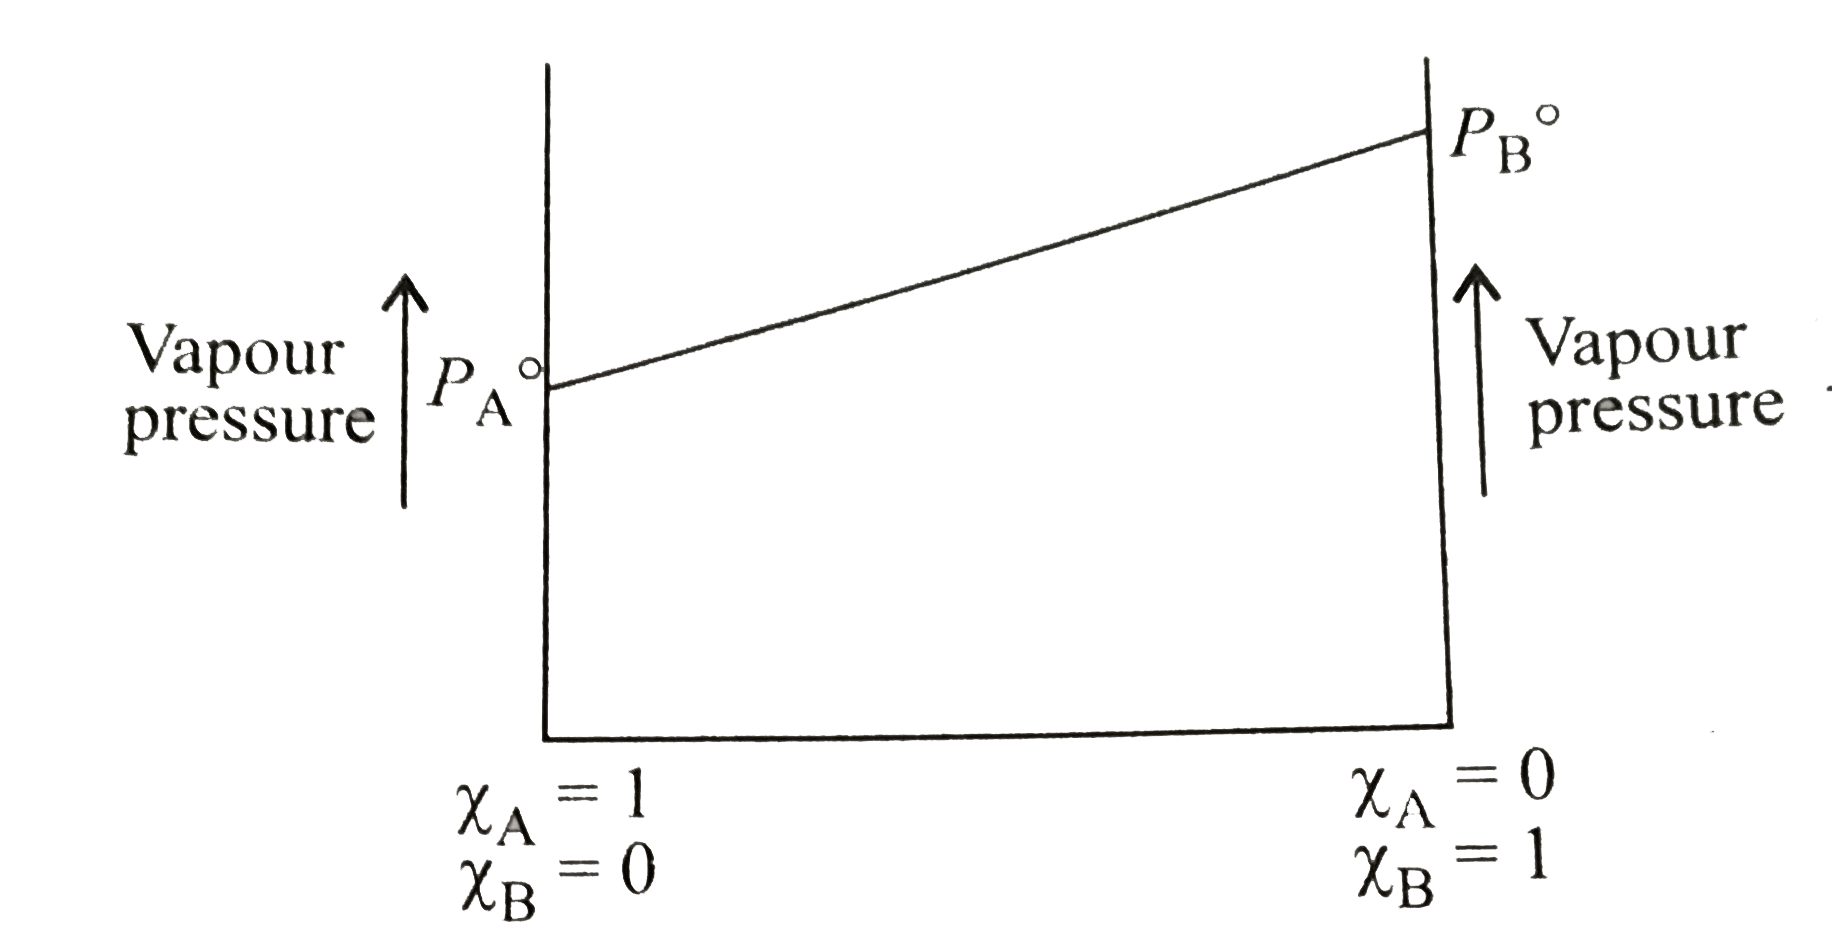
View SolutionThe following is a graph plotted between the vapour pressure of two volatile liquids against their respective mole fractions. Which of the following statements is/are correct?
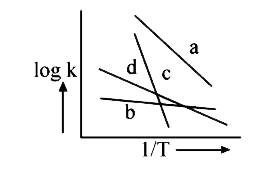
View SolutionConsider the following plots of rate constant versus 1T for four different reactions. Which of the following orders is correct for the activation energies of these reactions?
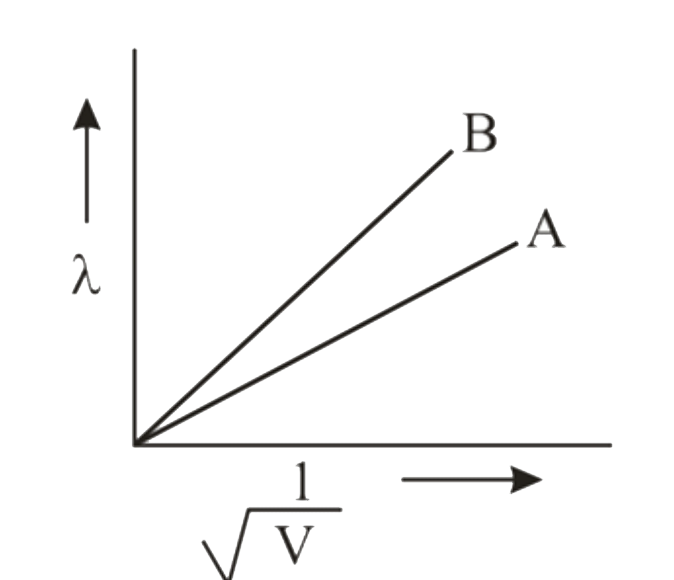
View Solutionde Broglie wavelengths of two particles A and B are plotted against (1√V) , where V is the potential on the particles. Which of the following relation is correct about the mass of the particles ?
View Solution
