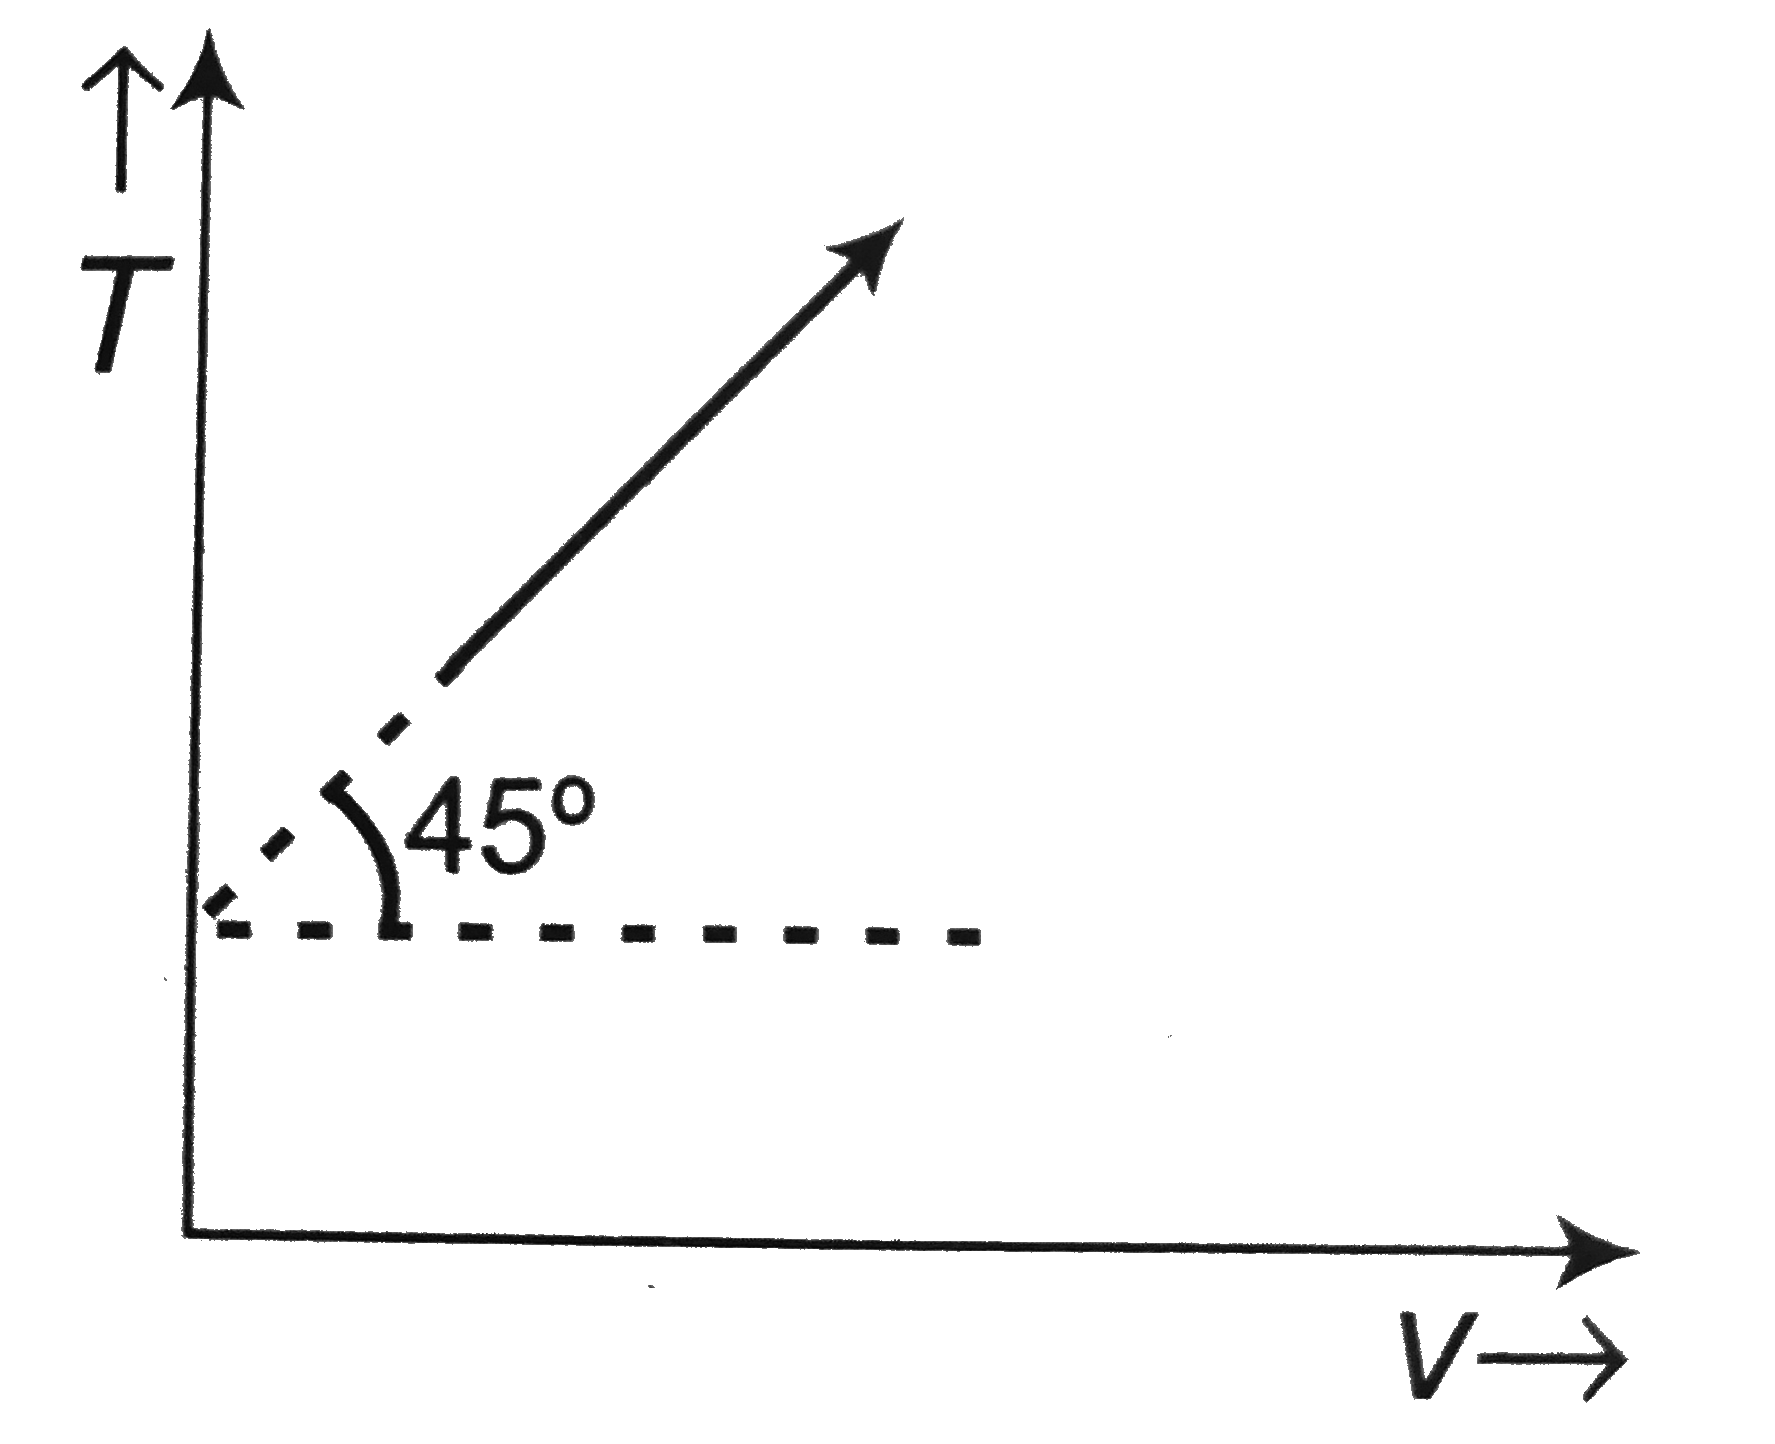
Which of the following volume-temperature (V−T) plots represents the behaviour of 1mole of an ideal gas at the atmospheric pressure?
To solve the question regarding which volume-temperature (V-T) plot represents the behavior of 1 mole of an ideal gas at atmospheric pressure, we can follow these steps:
Step 1: Understand the Ideal Gas Law
The ideal gas law is given by the equation:
PV=nRT
Where:
- P = Pressure
- V = Volume
- n = Number of moles
- R = Universal gas constant
- T = Temperature in Kelvin
Since we are considering 1 mole of gas at constant atmospheric pressure, we can simplify our analysis.
Step 2: Identify Charles's Law
When the pressure is constant, Charles's Law states:
VT=k
Where k is a constant. This means that the volume V of the gas is directly proportional to its temperature T. Therefore, as the temperature increases, the volume must also increase.
Step 3: Analyze the Given Options
We need to evaluate the given options based on the relationship established by Charles's Law.
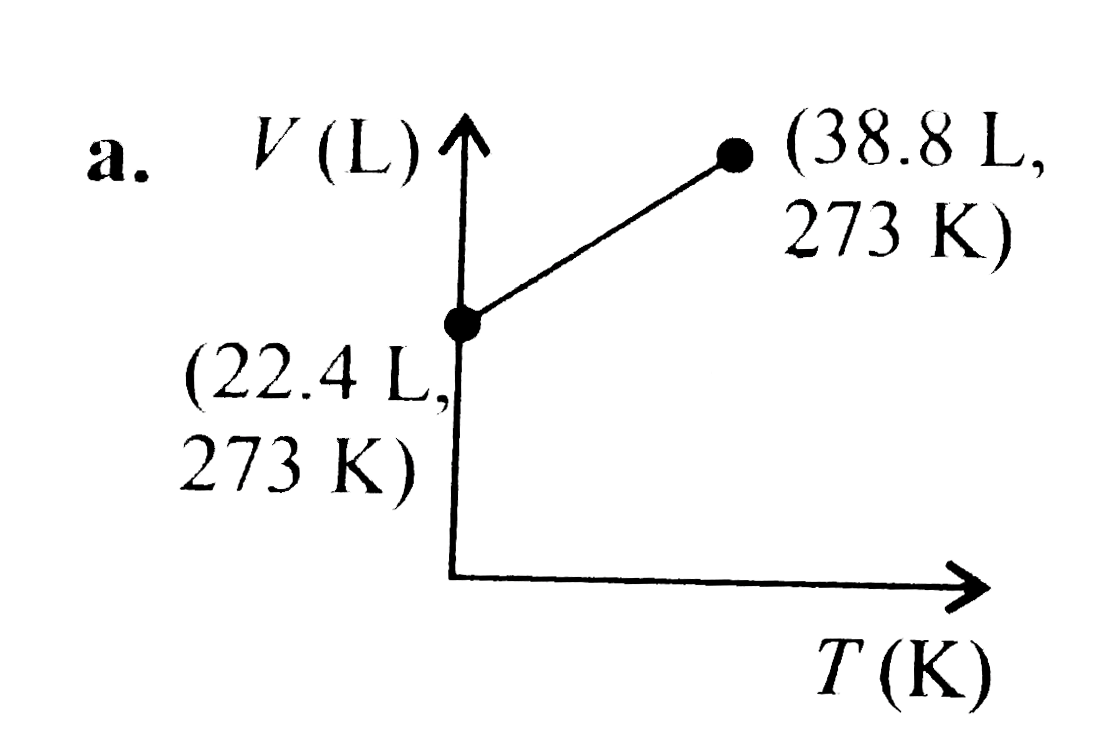
1. Option A:
- V1=22.4L,T1=273K
- V2=38.8L,T2=273K
- Here, the volume increases while the temperature remains constant, which violates Charles's Law. This option is incorrect.
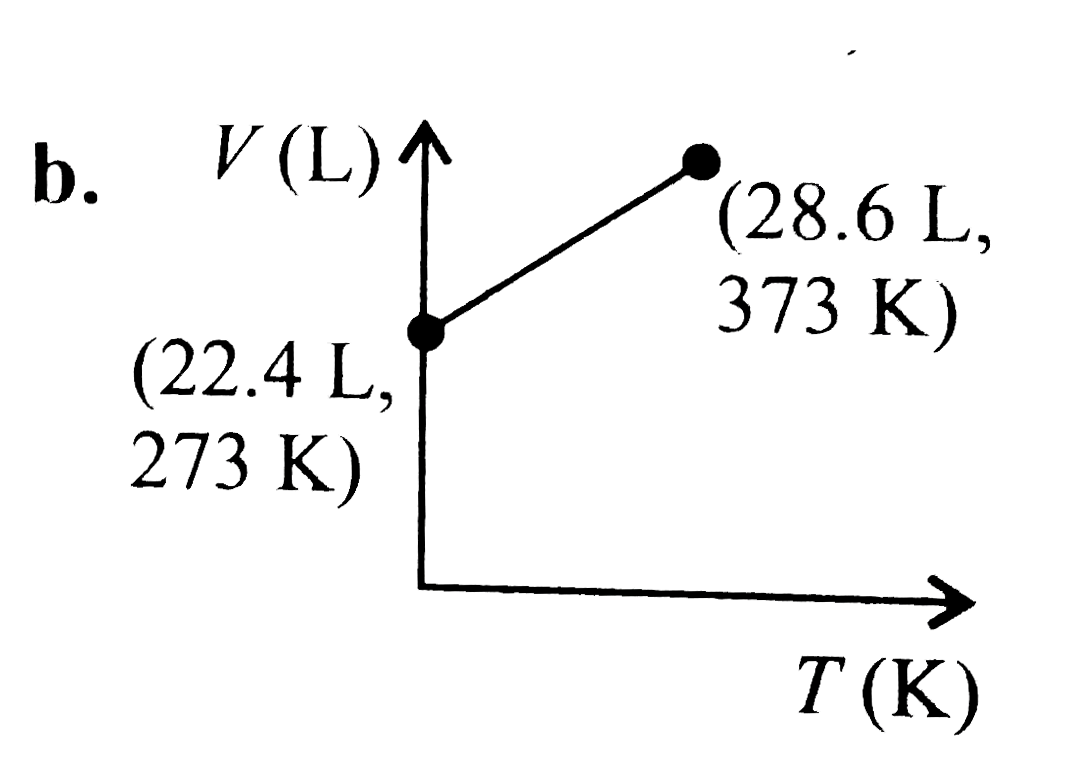
2. Option B:
- V1=22.4L,T1=273K
- V2=28.6L,T2=373K
- We can check if this satisfies Charles's Law:
V1T1=22.4273,V2T2=28.6373
Calculating:
22.4273≈0.0822,28.6373≈0.0767
These values are not equal, hence this option is also incorrect.
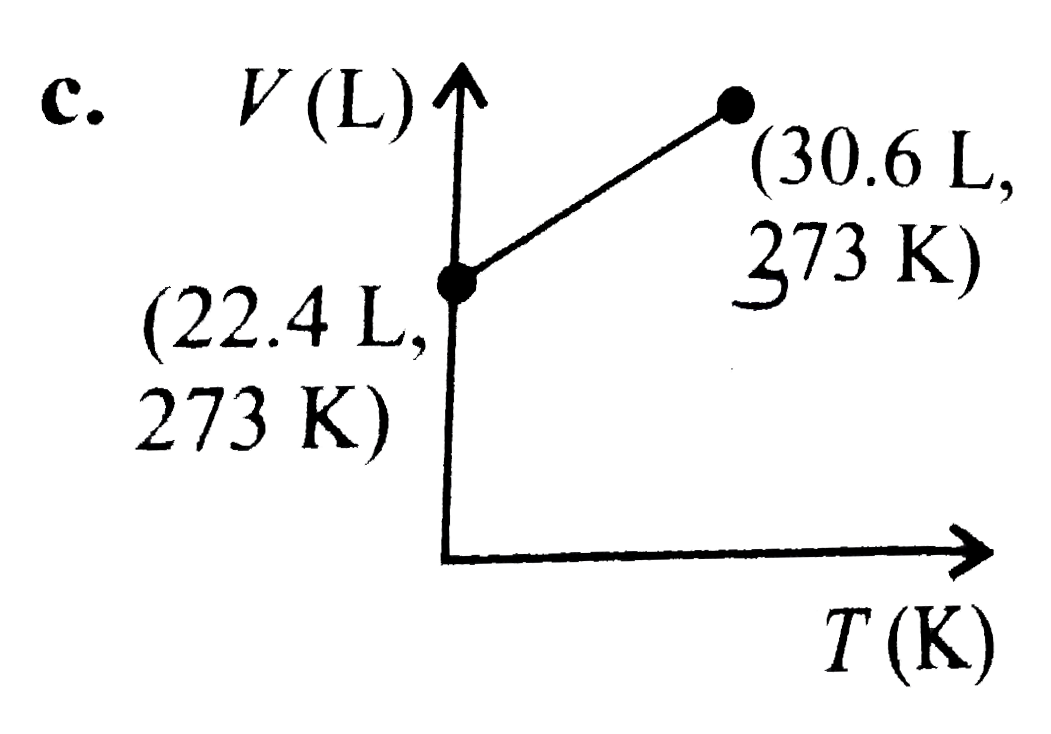
3. Option C:
- V1=22.4L,T1=273K
- V2=30.6L,T2=373K
- Check:
V1T1=22.4273,V2T2=30.6373
Calculating:
22.4273≈0.0822,30.6373≈0.0820
These values are approximately equal, confirming that this option is correct.
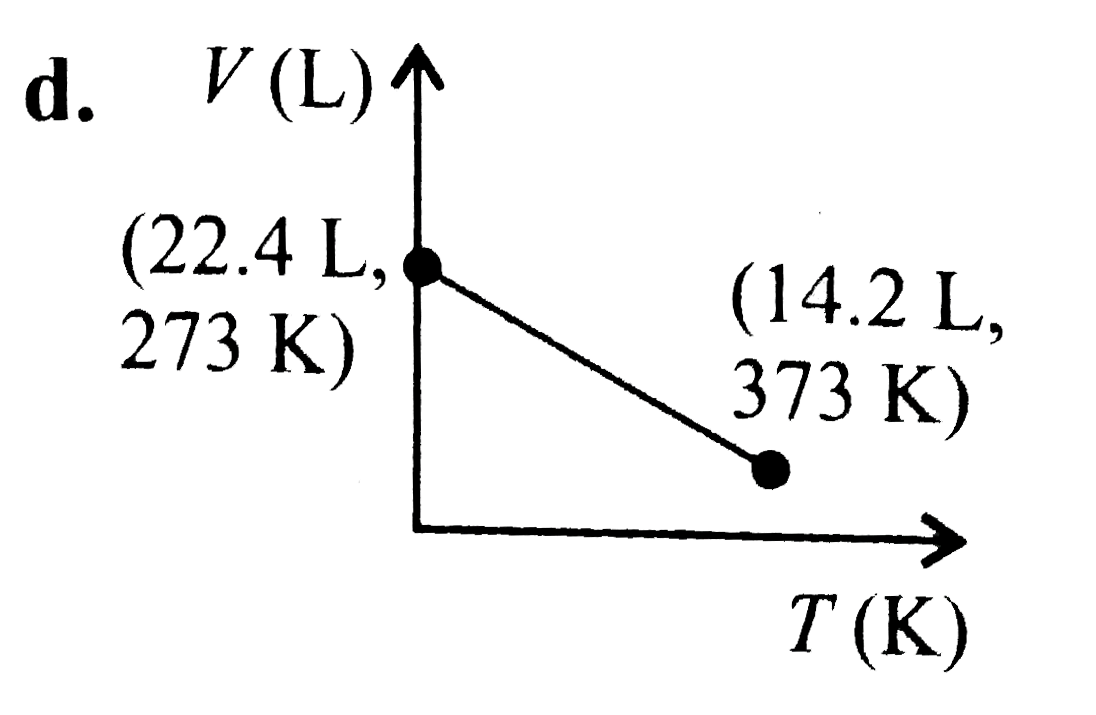
4. Option D:
- V1=22.4L,T1=273K
- V2=?L,T2=373K
- If the temperature increases, the volume should also increase, but if the volume decreases, this contradicts Charles's Law. This option is incorrect.
Conclusion
The correct answer is Option C.
The ideal gas law is given by the equation:
PV=nRT
Where:
- P = Pressure
- V = Volume
- n = Number of moles
- R = Universal gas constant
- T = Temperature in Kelvin
When the pressure is constant, Charles's Law states:
VT=k
Where k is a constant. This means that the volume V of the gas is directly proportional to its temperature T. Therefore, as the temperature increases, the volume must also increase.
We need to evaluate the given options based on the relationship established by Charles's Law.
- V1=22.4L,T1=273K
- V2=38.8L,T2=273K
- Here, the volume increases while the temperature remains constant, which violates Charles's Law. This option is incorrect.
- V1=22.4L,T1=273K
- V2=28.6L,T2=373K
- We can check if this satisfies Charles's Law:
V1T1=22.4273,V2T2=28.6373
Calculating:
22.4273≈0.0822,28.6373≈0.0767
These values are not equal, hence this option is also incorrect.
- V1=22.4L,T1=273K
- V2=30.6L,T2=373K
- Check:
V1T1=22.4273,V2T2=30.6373
Calculating:
22.4273≈0.0822,30.6373≈0.0820
These values are approximately equal, confirming that this option is correct.
- V1=22.4L,T1=273K
- V2=?L,T2=373K
- If the temperature increases, the volume should also increase, but if the volume decreases, this contradicts Charles's Law. This option is incorrect.
The correct answer is Option C.
Topper's Solved these Questions
- STATES OF MATTERBOOK - CENGAGE CHEMISTRY ENGLISHCHAPTER - STATES OF MATTEREXERCISE - Archives ( Assertion-Reasoning)
2 Videos
- STATES OF MATTERBOOK - CENGAGE CHEMISTRY ENGLISHCHAPTER - STATES OF MATTEREXERCISE - Archives (Integer)
1 Videos
- STATES OF MATTERBOOK - CENGAGE CHEMISTRY ENGLISHCHAPTER - STATES OF MATTEREXERCISE - Archives (Multiple Correct)
3 Videos
- SOME BASIC CONCEPTS AND MOLE CONCEPTBOOK - CENGAGE CHEMISTRY ENGLISHCHAPTER - SOME BASIC CONCEPTS AND MOLE CONCEPTEXERCISE - Archives Subjective
11 Videos
- STOICHIOMETRYBOOK - CENGAGE CHEMISTRY ENGLISHCHAPTER - STOICHIOMETRYEXERCISE - Archives Subjective
33 Videos
Similar Questions
Knowledge Check
Which of the following graphs represent the behaviour of an ideal gas ?
A1.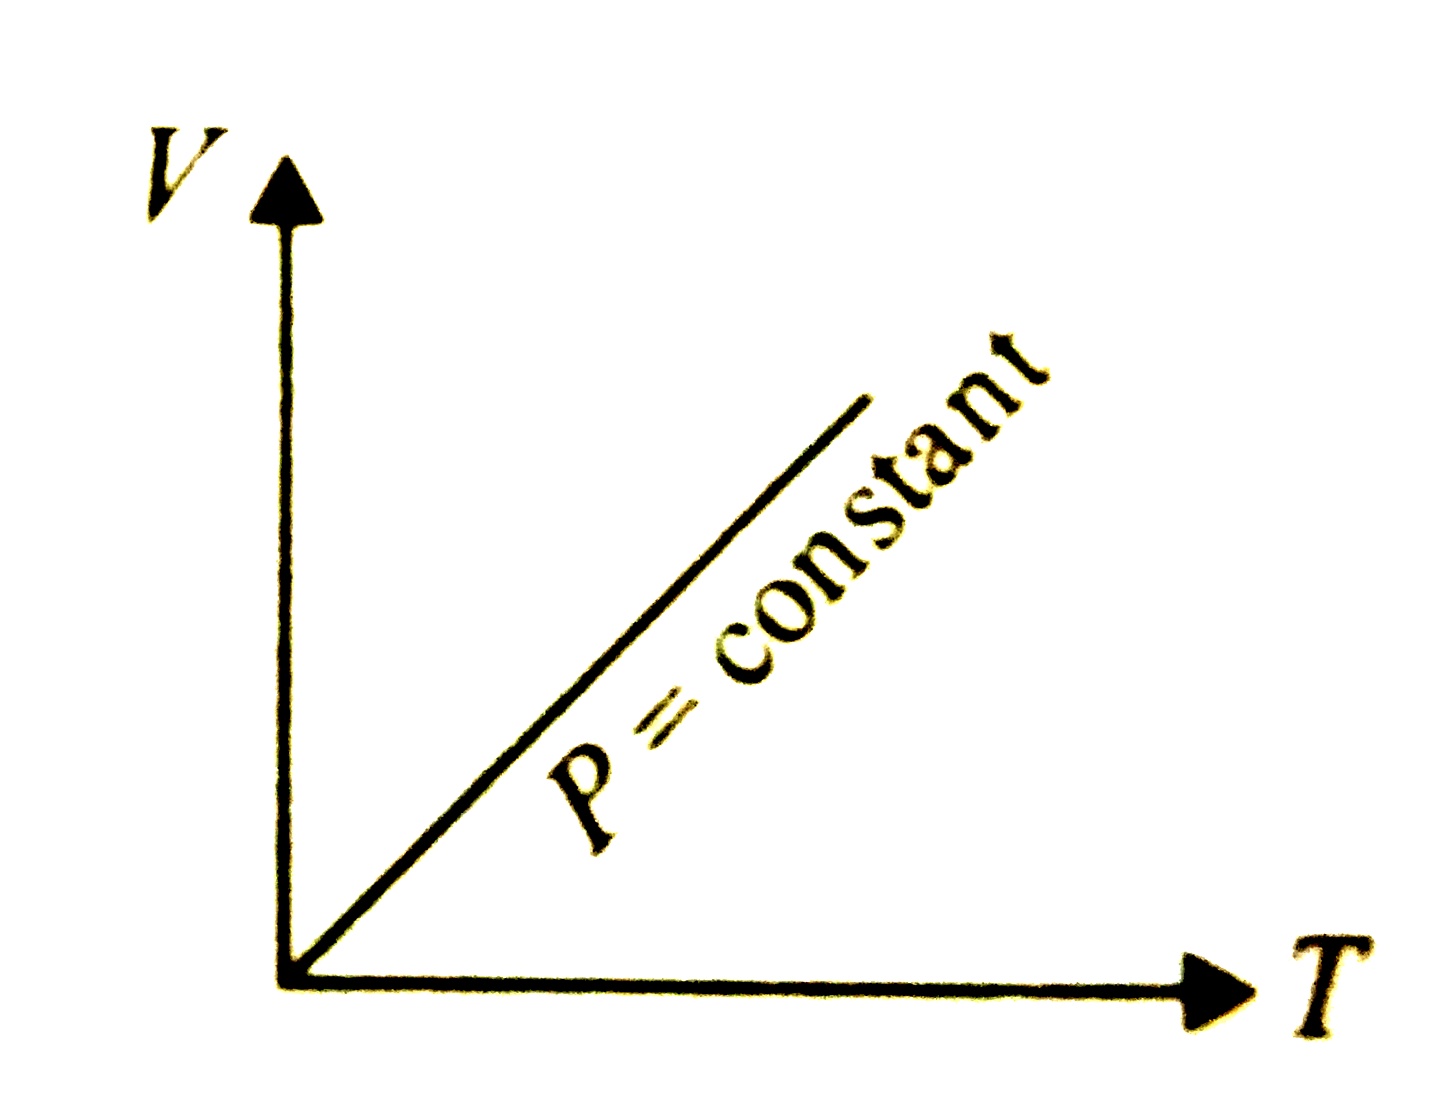 B2.
B2.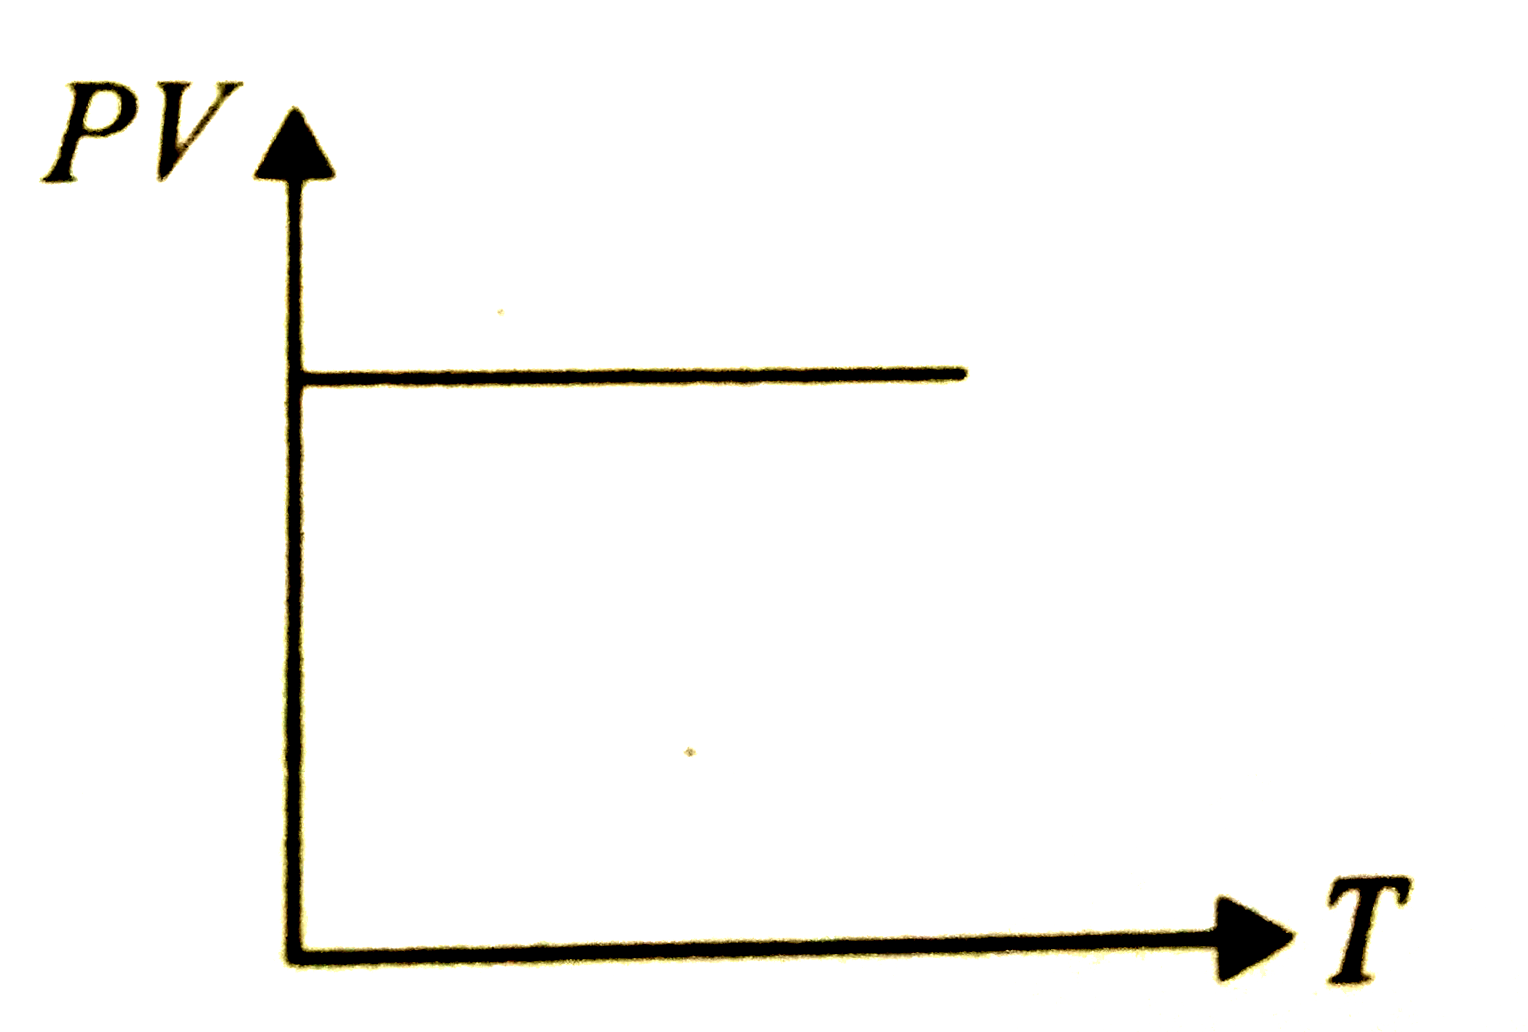 C3.
C3.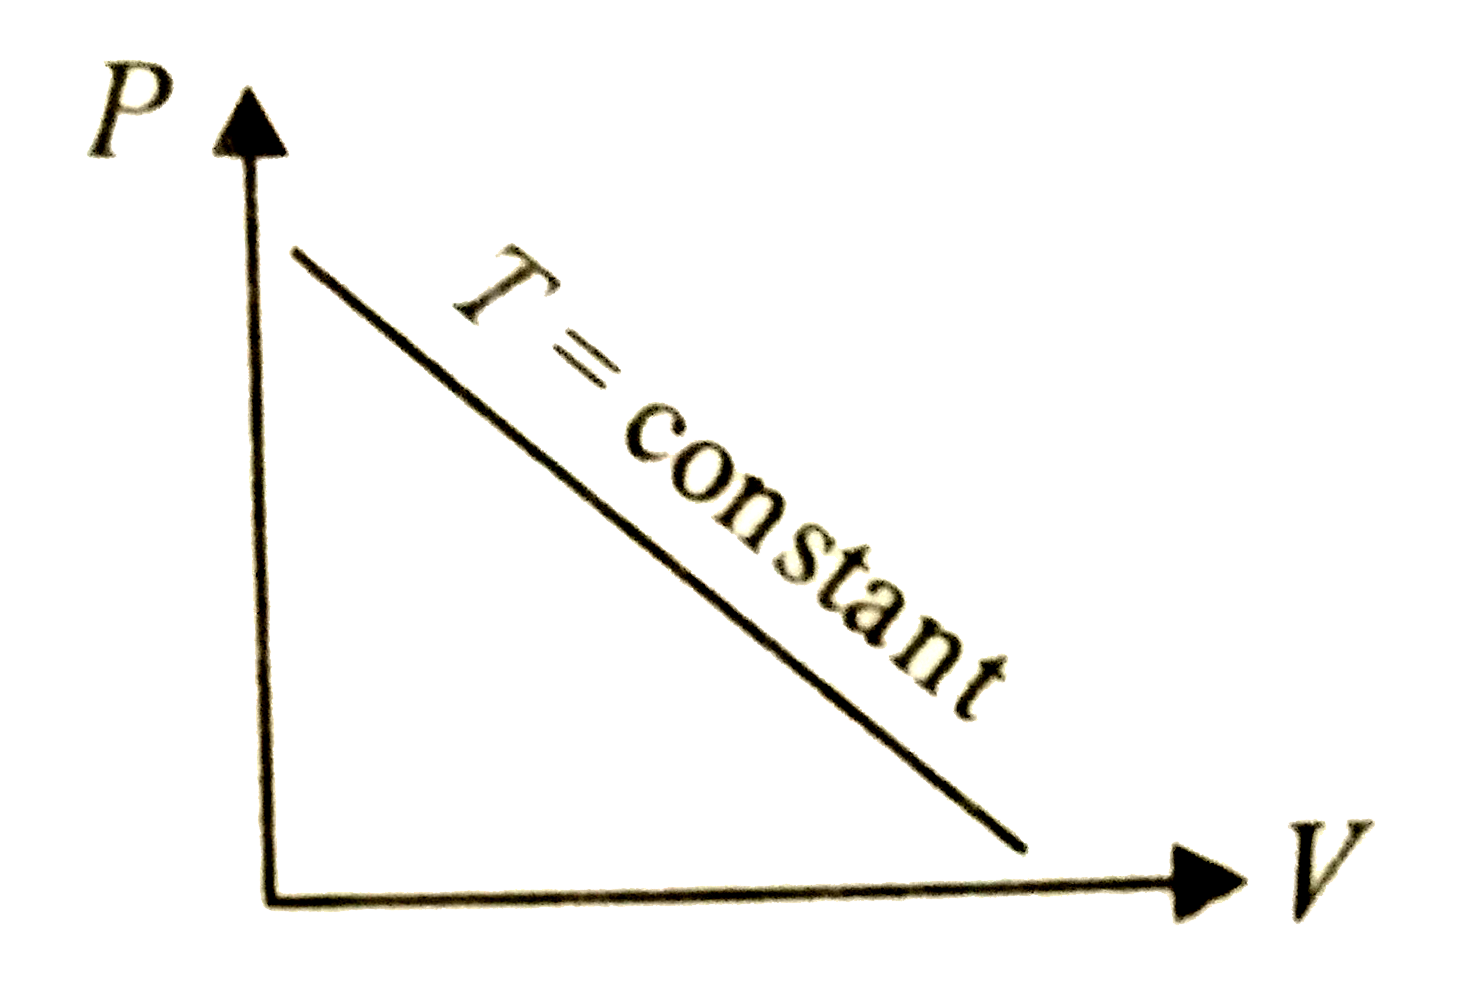 D4.
D4.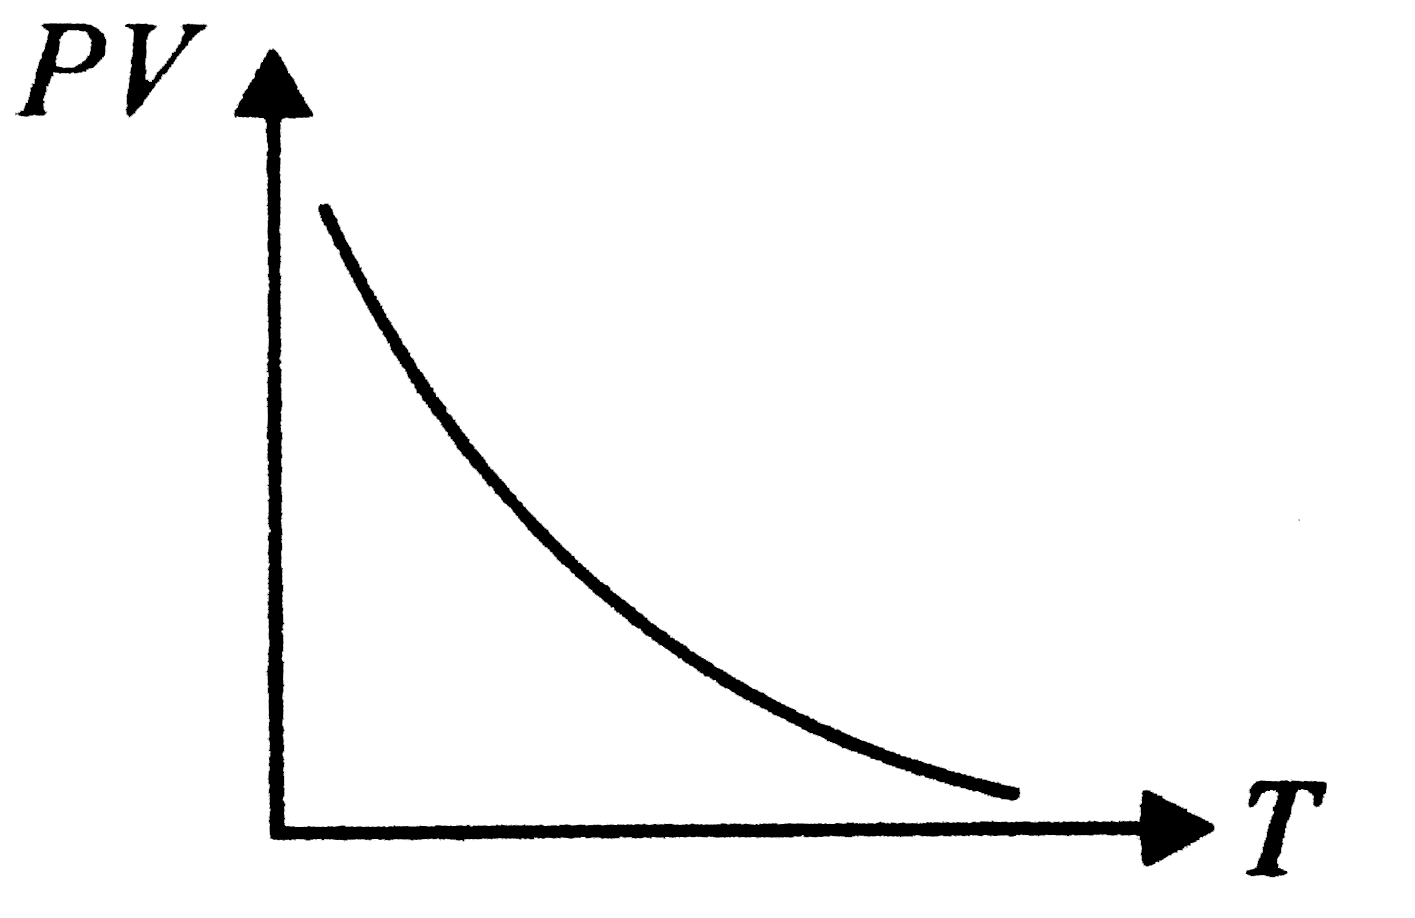
which of the following volume-temperature (V−T) curve best represents an isobaric process for a fixed mass of gas?
View SolutionIf both the temperature and the volume of an ideal gas are doubled, the pressure
View SolutionWhich of the following is a correct plot of the volume of fixed amount of ideal gas as a function of temperature (at constant pressure)
View SolutionFigure shows volume - temperature (V-T) graph for same mass of an ideal gas at two different pressures P1and P2. Hence
View SolutionA certain amount of water of mass m, at a temperature T2 cools.to temperature T1. The heat given out by the water is absorbed by n mole of an ideal gas. The gas expands at constant temperature T and changes its volume from Vi to Vf What is its initial volume ?
View SolutionThe behaviour of ideal gas is goverened by various gas laws which are described by mathematical statements as given below:
(i) PV=k (constant) at constant n and T
(ii) V/T=k2 (constant) at constant n and P
(iii) V/n=k3 (constant) at constant T and P
(iv) PV=nRT
(v) P/T=k4 (constant) at constant n and V
Answer the following
If we plot a graph between volume (L) and temperature (−273.15∘C) by studying their variation for 2.0g of certain ideal gas at 1¯ pressure, the graph obtained is a straight line which is
View SolutionThe given curve represents the variation of temperature as a function of volume for one mole of an ideal gas. Which of the following curves best represents the variation of pressure as a function of volume?
View Solution

