The chart given below illustrates the weight measurements of people in the United States of America in 2020. Summarise the information in an analytic paragraph of 150-200 words by selecting and reporting the main features. Make comparisons where relevant.
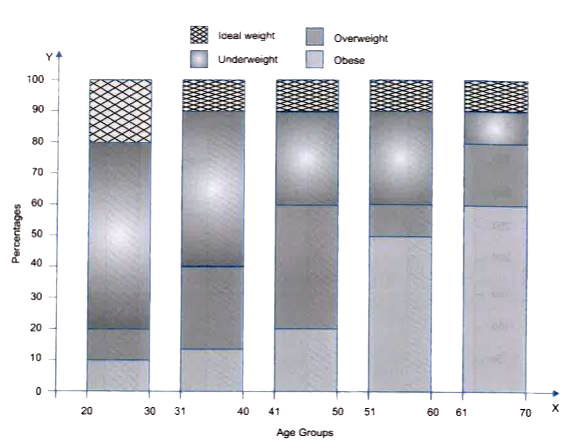
The bar graph given above represents the weight measurements of people in the United States of America in 2020. The general trend that emerges out is that the age group of 20-30 represents the ideal health of its citizens. In the age group of 20-30, 60 percent of the people enjoy Ideal weight measurements. It is followed by 31-40 age group where there is a slight decline of 10 per cent where half of the people enjoy Ideal weight measurement. The percentage of Ideal weight in the age groups of 41-50 and 51-60 remain the same, 35 percent each. The oldest age group 61-70 showed the least percentage, just 10% of the people enjoying ideal weights. The youngest age group showed the maximum percentage of under weights, about 20 percent. In the next age groups, it declined appreciably to 5 percent. In the oldest age group, 10 percent of people were found underweight. The youngest age group 20-30 showed the least number of overweight people, just 10 percent. The age-group 41-50 showed that 45 percent people of this age group were overweight. The same percent age is shown by 51-60 age group. In the oldest group, about 20 percent of people were found overweight. Naturally, as it is generally expected, the age group 20-30 showed that only 10 percent of people were obese in this group. This figure increased to 15 percent and 25 percent in 31-40 and 41-50 age group respectively. The percentage of obese people showed a quantum jump in the age group of 51-60 where half of the people were found obese. The highest percentage of obese people peaked in the oldest age group of 61 to 70, where 60 percent of the people were found obese.
Topper's Solved these Questions
- BOOK - FULL MARKSCHAPTER - COMPOSITION - II (WRITING ANALYTICAL PARAGRAPH ON MAP/CHART/REPORT/ LINE GRAPH)EXERCISE - PIE CHARTS4videos
COMPOSITION - II (WRITING ANALYTICAL PARAGRAPH ON MAP/CHART/REPORT/ LINE GRAPH)
- BOOK - FULL MARKSCHAPTER - COMPOSITION - II (WRITING ANALYTICAL PARAGRAPH ON MAP/CHART/REPORT/ LINE GRAPH)EXERCISE - NUMERICAL TABLES5videos
COMPOSITION - II (WRITING ANALYTICAL PARAGRAPH ON MAP/CHART/REPORT/ LINE GRAPH)
- BOOK - FULL MARKSCHAPTER - COMPOSITION - II (WRITING ANALYTICAL PARAGRAPH ON MAP/CHART/REPORT/ LINE GRAPH)EXERCISE - ANALYTIC STUDY OF MAPS3videos
COMPOSITION - II (WRITING ANALYTICAL PARAGRAPH ON MAP/CHART/REPORT/ LINE GRAPH)
- BOOK - FULL MARKSCHAPTER - CLOZE PASSAGEEXERCISE - Fill in the most appropriate option in each blank from those given below to complete the following passage.112videos
CLOZE PASSAGE
- BOOK - FULL MARKSCHAPTER - COMPOSITION-IEXERCISE - IV. OFFICIAL LETTERS ON ALL SITUATIONS (SOLVED EXAMPLES)29videos
COMPOSITION-I
Similar Questions
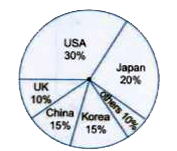
The following pie chart shows the foreign Direct Investment in India during 2019-2020. Write an analytic paragraph showing the general trends and the necessary details. Compare the segments where relevant.
 02:47View Solution
Read the table given above that describes postal charges among five main cities of India, Kanpur, Mumbai, Kolkata, Delhi and Lucknow. Write a critical and analytic description in a paragraph of 150-200 words. Compare and contrast them wherever possible.01:59View SolutionThe map given below illustrates the Thar Desert, also known as the Great Indian Desert. As the map represents, it is a large and completely dry region in the northwestern part of the Indian subcontinent. It covers an area of 200,000 km and forms a natural boundary between India and Pakistan. The Thar Desert is the 17th largest desert, and the world's 9th largest sub-trogpcal desert. About 85 percent of the Desert is located within India. The remaining 15 percent of the Desert is in Pakistan. Even in India, more than 60 percent of the Thar Desert lies in the Indian state of Rajasthan. From Rajasthan it extends into the states of Gujarat, Punjab and Haryana. In Pakistan it lies in the provinces of Sindh and Punjab.
 06:30View Solution
But Champaran …................. (a)………………… begin as …................. (b)………………… act of defiance. It grew out …................. (c)………………… an attempt to alleviate the distress of large numbers of poor peasants. This …................. (d)………………… the typical Gandhi pattern. …................. (e)………………… politics was intertwined …................. (f)………………… the practical day-to-day problems of millions. It was not a …................. (g)………………… to abstractions, it was a loyalty to …................. (h)………………… human beings.
05:07View SolutionIndia is a highly populated country. People lack in maintaining proper sanitation and hygiene. As a result, they suffer from various diseases. India has a serious sanitation challenge, around 60 per cent of the world's open defecation takes place in India. Poor sanitation causes health hazards including diarrhoea, particularly in children under 5 years of age, malnutrition and deficiencies in physical development and cognitive ability. Write a letter to the Minister of Health and Family welfare India highlighting the problem and suggesting practical ways to ensure public sanitation and the right to dignity and privacy.
 06:26View Solution
परिवर्ती ऑक्सीकरण अवस्थाओं से क्या तातपर्य है? इसे संक्रमण तत्वों के सन्दर्भ में समझाइए ।
03:50View Solutionअक्रिय गैसों में सबसे अधिक योगिक बनाने वाली गैसों का नाम एवं इसके कोई भी दो योगिकों के सूत्र लिखिए ।
03:07View Solution1.5 वोल्ट का एक आदर्श सेल 100Ω तथा 200Ω के प्रतिरोधों के श्रेणी संयोजन में धारा भेजता हैं जैसा कि चित्र में प्रदर्शित हैं। परिपथ में 100Ω के प्रतिरोध पर वोल्टता नापने के लिए 1000Ω प्रतिरोध को वोल्टमीटर चित्रानुसार लगा दिया जाता हैं। वोल्टमीटर का पाठ्यांक ज्ञात कीजिए।
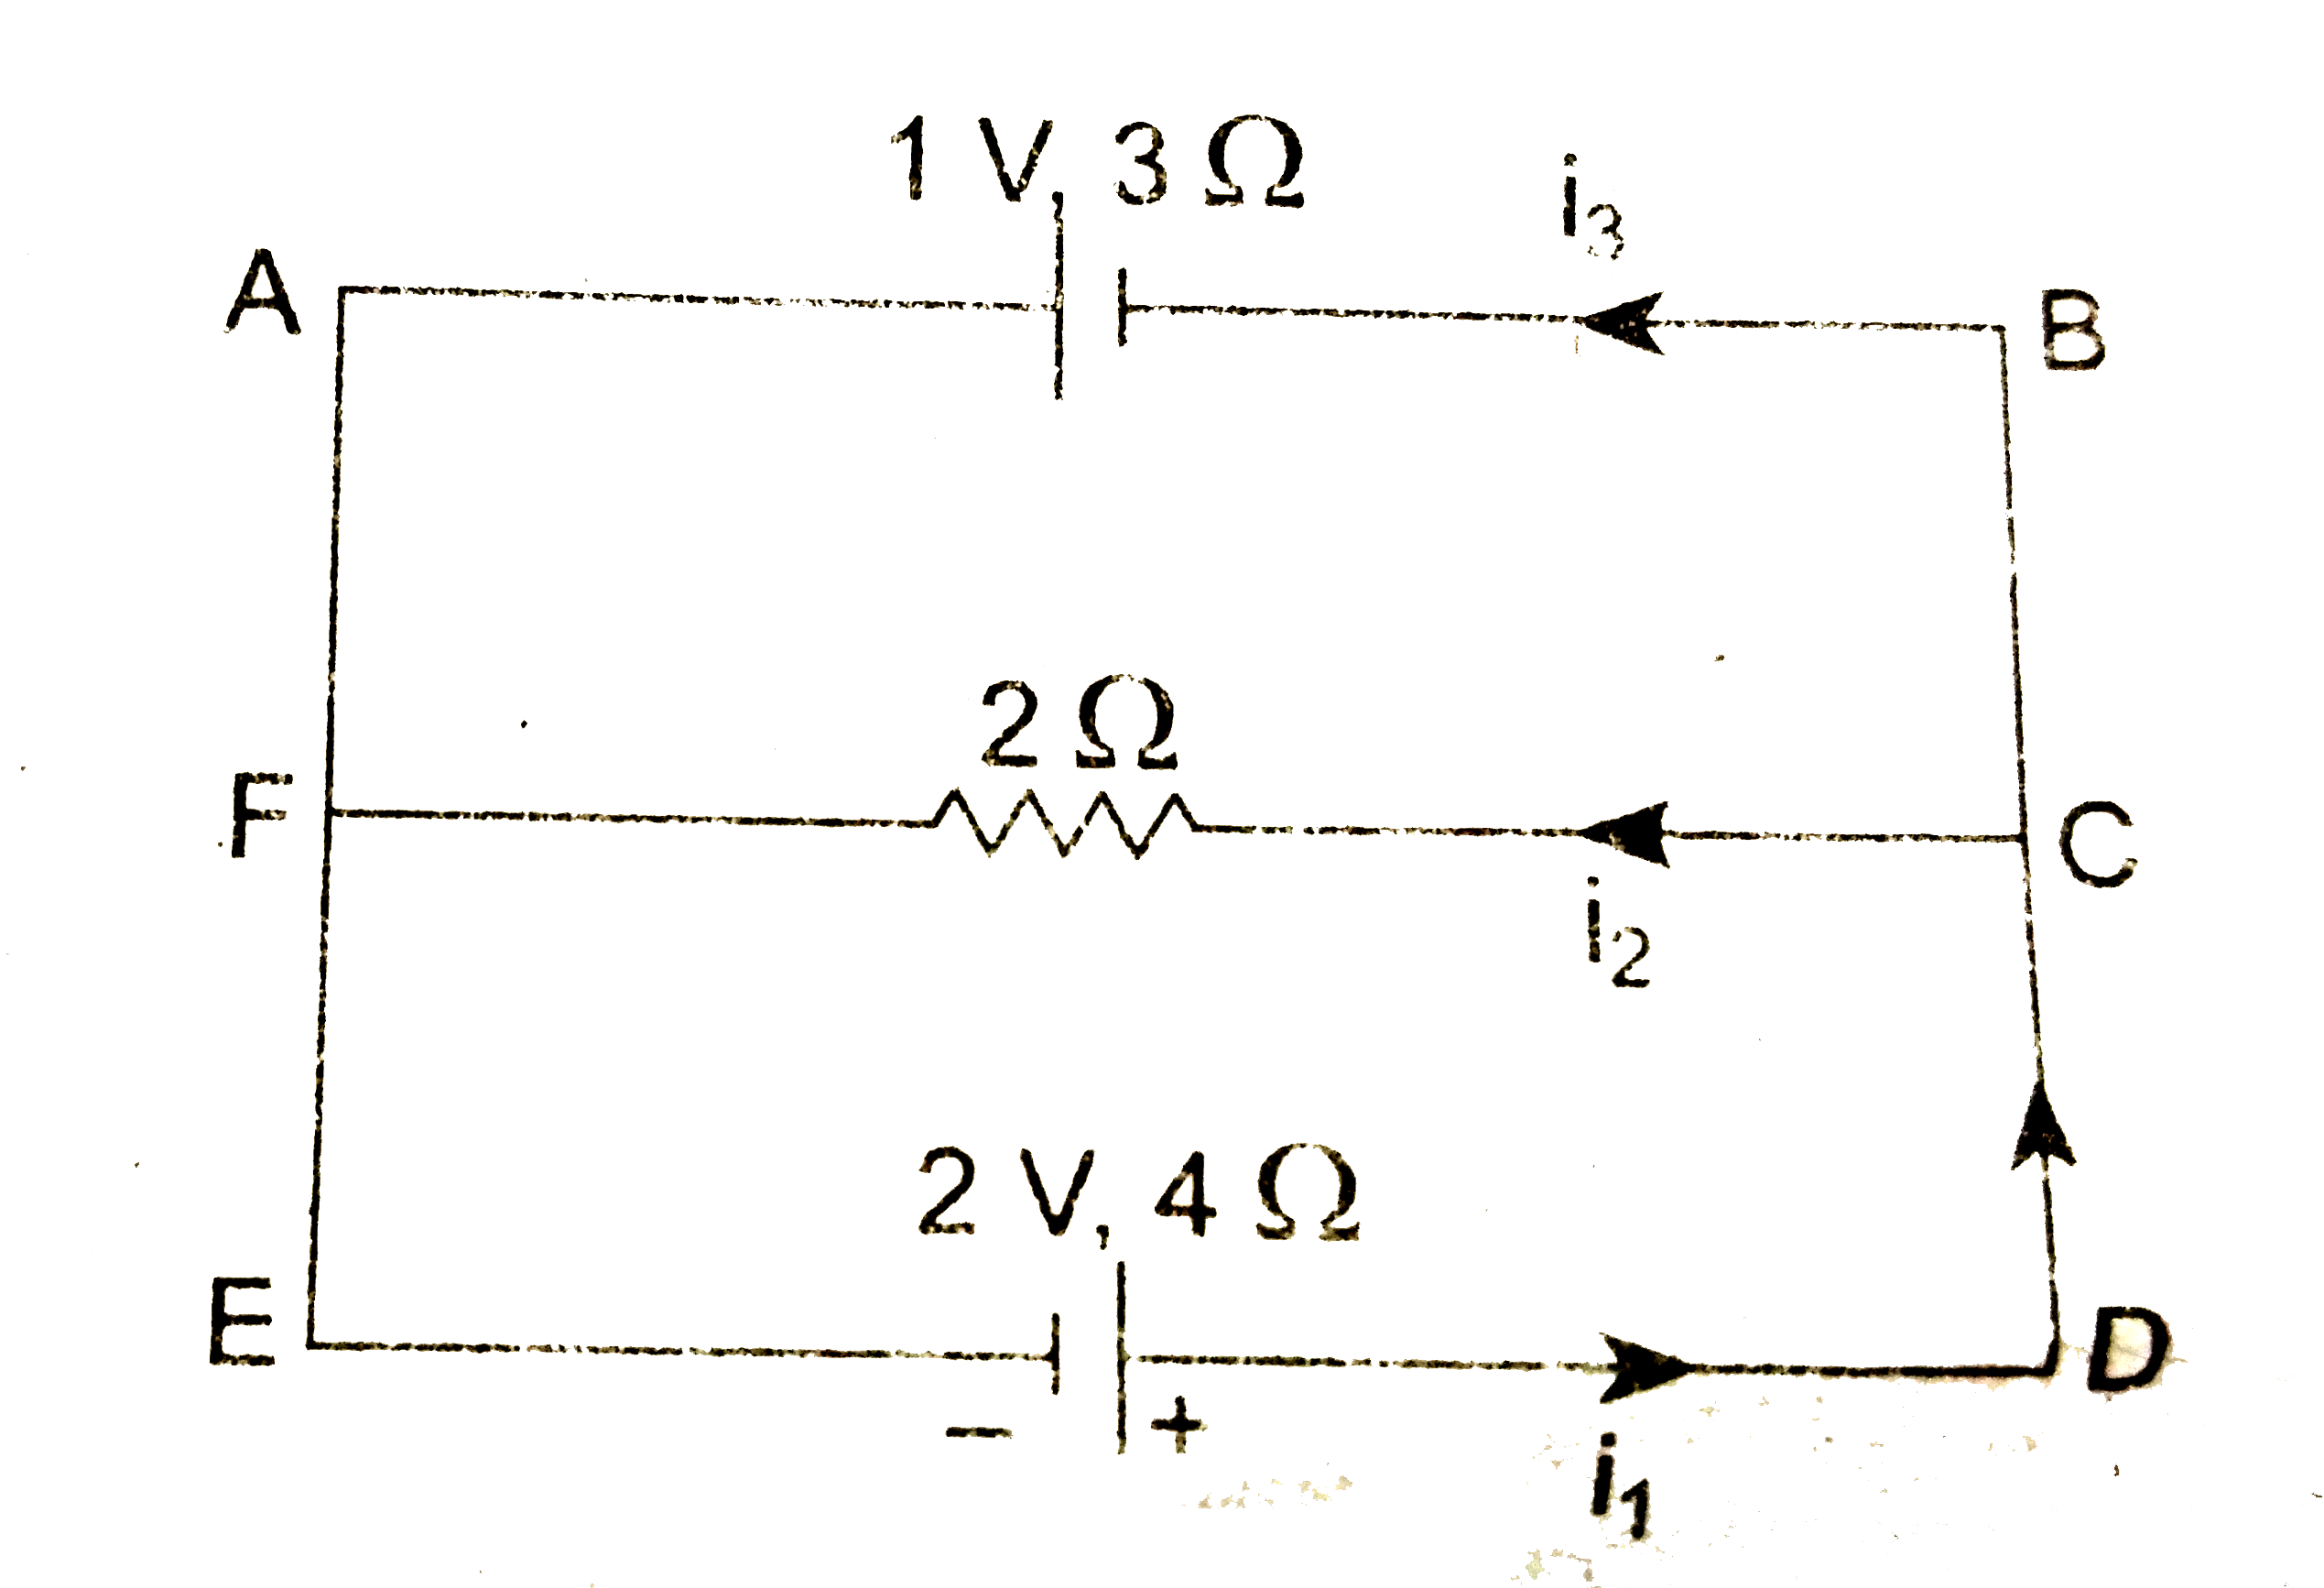
03:35View Solutionदिए गए परिपथ में प्रत्येक शाखा में धारा का मान ज्ञात करे ? ।
 02:43View Solution
दिए गए वैधुत परिपथ में सेल में प्रवाहित धारा ज्ञात कीजिए । सेल का आन्तरिक प्रतिरोध नगण्य है ।
04:47View Solutionदिए गए परिपथ में धारा I का मान ज्ञात कीजिये ?
 04:31View Solution
दिए गये परिपथ में प्र्तेक सेल के सिरों के बीच विभवान्तर ज्ञात कीजिए ।
01:16View Solutionदिए गये विघुत परिपथ में तथा के मध्य विभवान्तर की गणना कीजिए ।
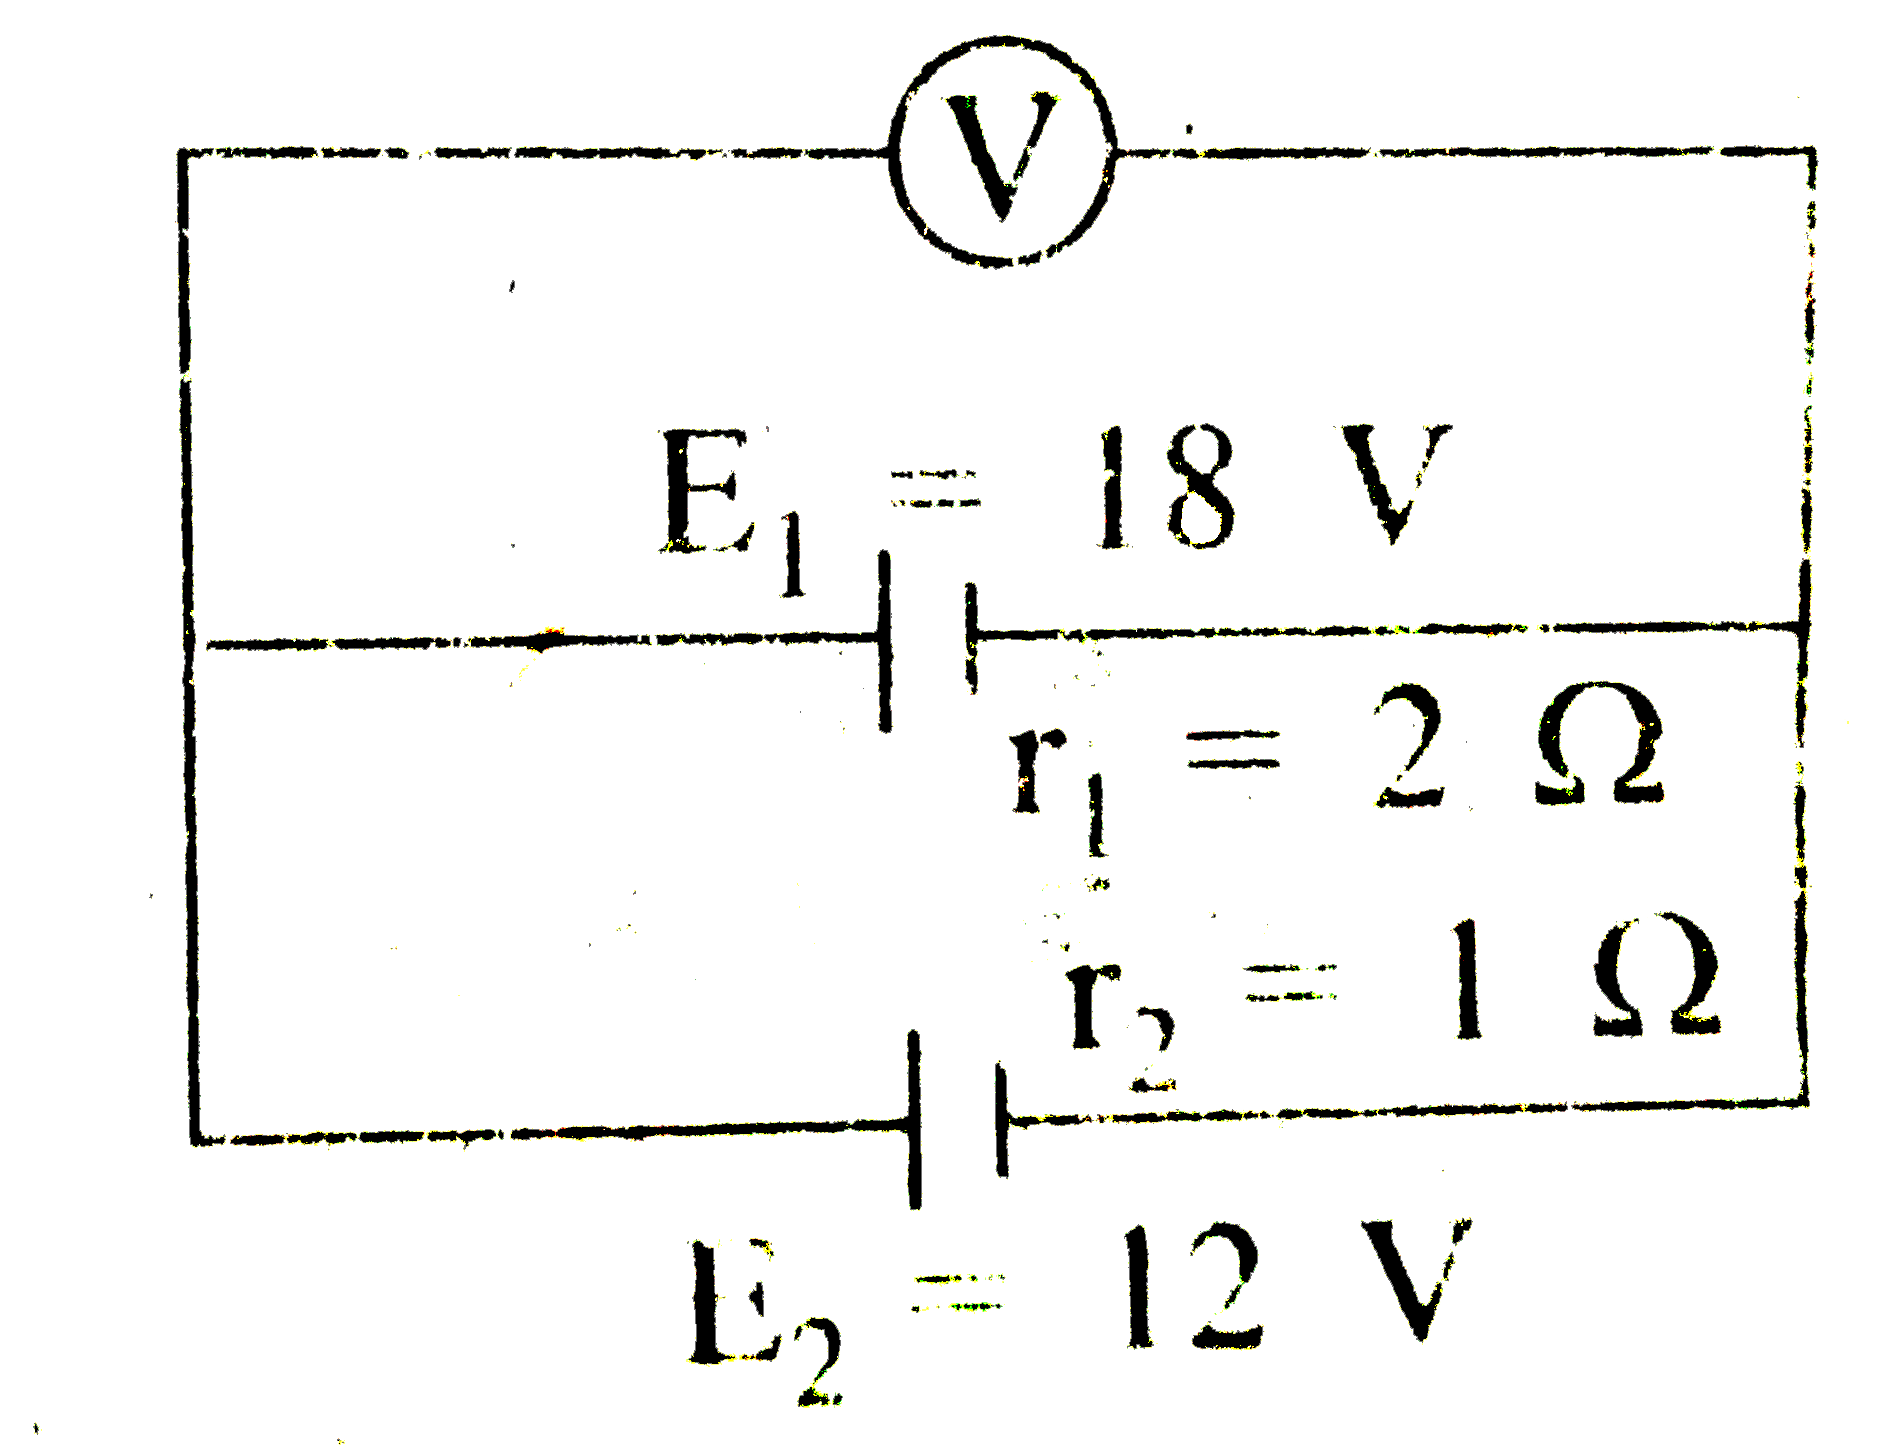 02:17View Solution
दिए गये विघुत परिपथ की सहायता से ज्ञात कीजिए
- (i) परिपथ में धारा , तथा
(ii) बिन्दु A तथा B के बीच विभवान्तर ।
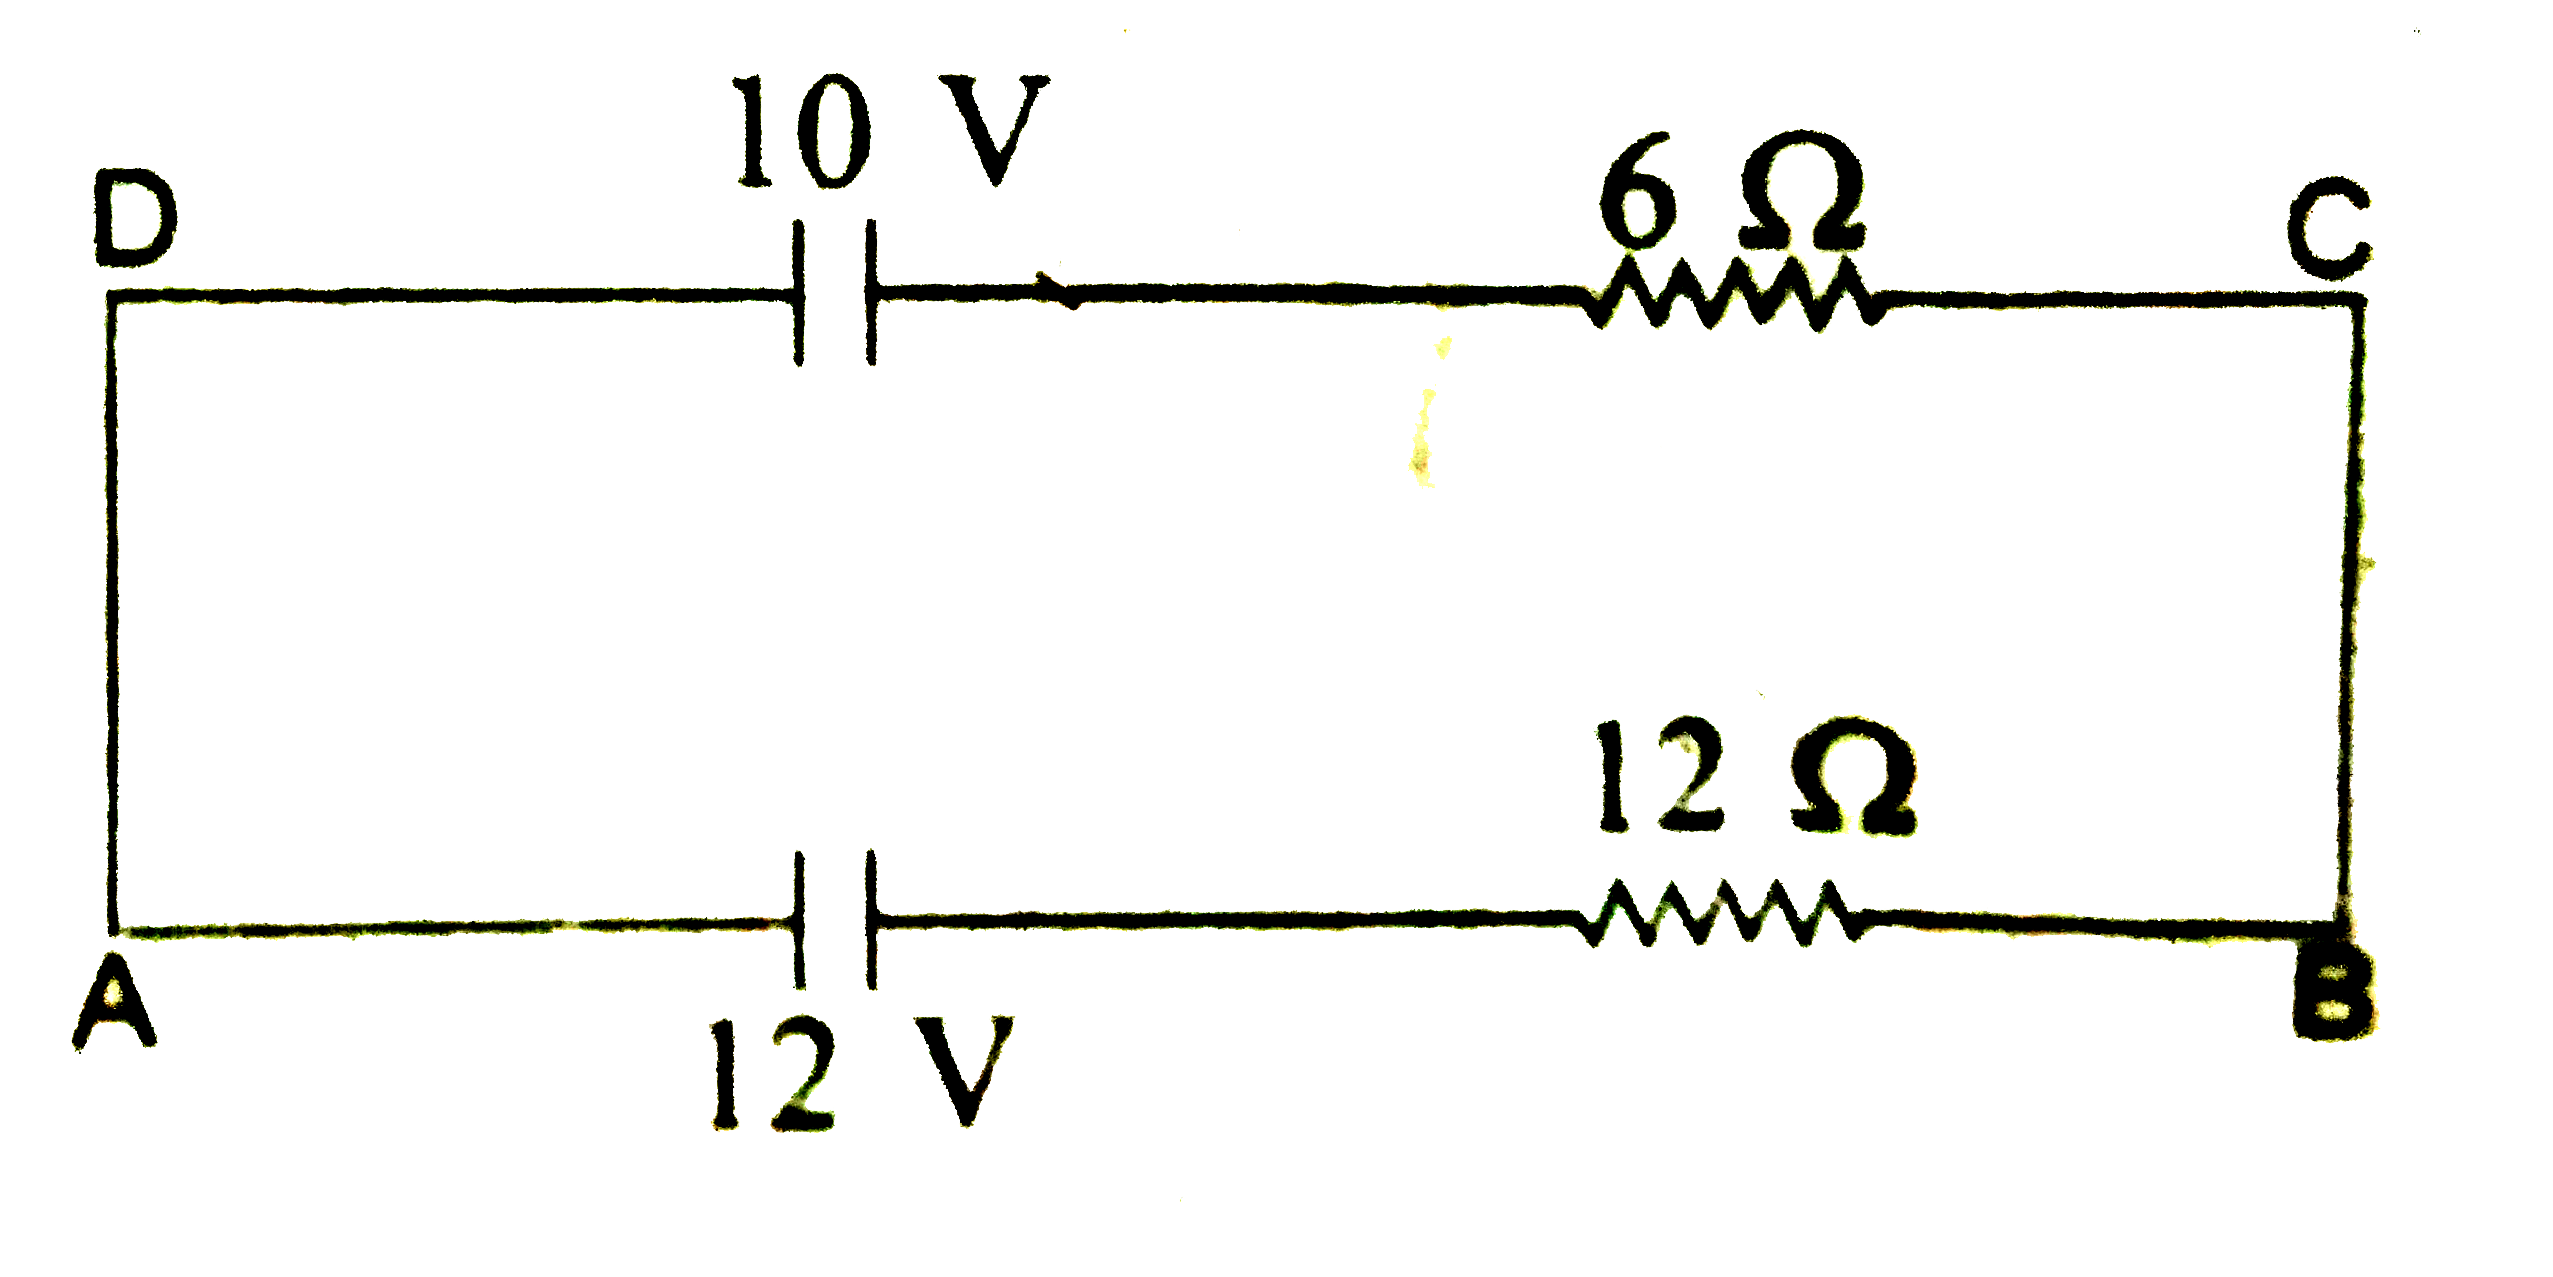 View Solution
एक प्रेरक के बहने वाली धारा, i=4+12t द्वारा दी जाती है, जहाँ I ऐम्पियर में तथा t सेकण्ड में है | इसमें स्वप्रेरित विधुत वाहक बल 12 mV है | ज्ञात कीजिए- (i) स्वप्रेरकत्व, तथा (ii) t=1 सेकण्ड पर प्रेरक में संचित ऊर्जा एवं इसको प्रदान की गयी शक्ति |
02:46View Solutionएक प्रेरक में प्रवाहित धारा, i=2+5t द्वारा व्यक्त की जाती है, जहाँ i ऐम्पियर तथा t सेकण्ड में है | इसमें स्वप्रेरित विधुत वाहक बल 10 मिलिवोल्ट है | ज्ञात कीजिए -
(i) स्वप्रेरण गुणांक, तथा (ii) t=2 सेकण्ड पर प्रेरक में संचित ऊर्जा |04:02View Solution

