The following pie chart shows the foreign Direct Investment in India during 2019-2020. Write an analytic paragraph showing the general trends and the necessary details. Compare the segments where relevant.
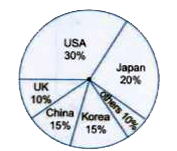
The given pie chart illustrates the Foreign Direct Investment (FDIS) by various nations in India during the financial year 2019-2020. The overall trend shows that the richest nation and the number one economy in the world, the USA invested the most in India. It constituted 30 percent of the total FDIs in India during this year. It was followed by Japan which invested more in India than China, Korea and the United Kingdom. One fifth of the total FDIs was done by Japan alone. Korea and China contributed 15 percent each of the total investments. The United Kingdom did have a sizeable contribution. Its share stood at 10 percent. Other countries contributed the remaining 10 percent of the FDIs. The counting of Asia, China, Japan and Korea contributed half of the total FDIs in India during 2019-20.
The other nations of the world contributed one third of the FDIs than the United States of America which topped the list of the foreign investors in India.
Topper's Solved these Questions
- COMPOSITION - II (WRITING ANALYTICAL PARAGRAPH ON MAP/CHART/REPORT/ LINE GRAPH)BOOK - FULL MARKSCHAPTER - COMPOSITION - II (WRITING ANALYTICAL PARAGRAPH ON MAP/CHART/REPORT/ LINE GRAPH)EXERCISE - NUMERICAL TABLES
5 Videos
- COMPOSITION - II (WRITING ANALYTICAL PARAGRAPH ON MAP/CHART/REPORT/ LINE GRAPH)BOOK - FULL MARKSCHAPTER - COMPOSITION - II (WRITING ANALYTICAL PARAGRAPH ON MAP/CHART/REPORT/ LINE GRAPH)EXERCISE - ANALYTIC STUDY OF REPORTS
3 Videos
- COMPOSITION - II (WRITING ANALYTICAL PARAGRAPH ON MAP/CHART/REPORT/ LINE GRAPH)BOOK - FULL MARKSCHAPTER - COMPOSITION - II (WRITING ANALYTICAL PARAGRAPH ON MAP/CHART/REPORT/ LINE GRAPH)EXERCISE - MAKING A BAR GRAPH/CHART
6 Videos
- CLOZE PASSAGEBOOK - FULL MARKSCHAPTER - CLOZE PASSAGEEXERCISE - Fill in the most appropriate option in each blank from those given below to complete the following passage.
112 Videos
- COMPOSITION-IBOOK - FULL MARKSCHAPTER - COMPOSITION-IEXERCISE - IV. OFFICIAL LETTERS ON ALL SITUATIONS (SOLVED EXAMPLES)
29 Videos
Similar Questions
The survey conducted by TOI involving 11000 respondents what people think about the lockdowns and the first things they would do if they are lifted. Summarise and write an analytic paragraph highlighting the general trends and other necessary details. Compare wherever relevant.

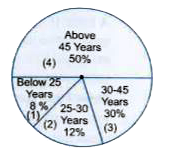
View SolutionThe following pie chart represents the distribution of the overseas tourists and their age profile respectively. Study the chart carefully and write an analytic paragraph (150- 200 words) giving the general trends and other necessary details. Don' forget to compare the segments where relevant.
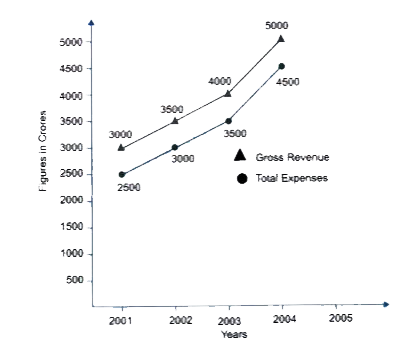
View SolutionThe Line graph given below represents Railway Finance from 2001-2002 to 2004-2005 (Northern Zone). It breaks down the gross revenue collected as well as the total expenses incurred during these years. Summarise and write an analytic paragraph highlighting the general trend and necessary details. Compare wherever relevant.
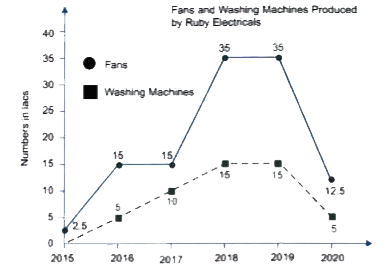
View SolutionThe line graph given below shows the number of Fans and Washing Machines produced by Ruby Electricals between 2015 and 2020. Summarise and write an analytic paragraph highlighting the main trends and the necessary details. Compare wherever relevant.
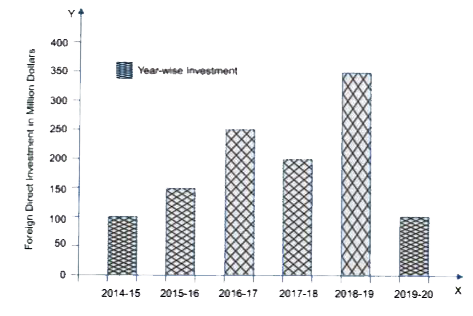
View SolutionThe bar chart given below illustrates the total Foreign Direct Investment (FDI) into India from all over the world. Summarise and write an analytic paragraph selecting the main features and giving all the necessary details. Compare where you find it relevant.
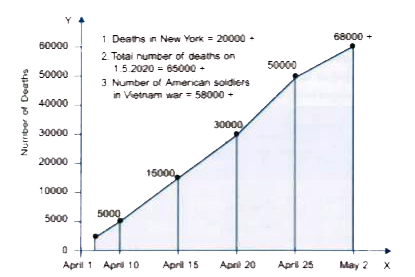
View SolutionIn the graph given below we get a shocking picture of deaths in the USA due to Corona Virus that showed a constant upward trend in the month of April 2020. Write an analytic paragraph describing the general trend and other details after analysing the graph.
View SolutionGiven above is the bar graph that represents the Total Sales Turnover of four major corporate giants of India. The figures shown record the total sales turnover in 3rd Quarter (September to December) and 4th Quarter (January to March). Summarise and write an analytic paragraph highlighting the general features and necessary details. Compare where you feel relevant.
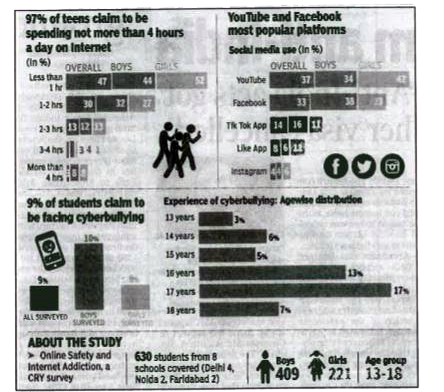
View SolutionA CRY survey about Online safety and Internet Addiction involving 630 students from 8 school illustrates the number of hours teens, both boys and girls, spend on Internet and their liking for social media use. Another isssue highlighted by the report is that of 'Cyberbullying. Summarise and write an analytic paragraph presenting the general trend and other details. Compare wherever it is relevant.
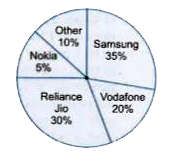
View SolutionThe pie chart given below represents the sales of mobile phones of the leading companies of the world in India. Summarise and analyse the chart in your own language in about 150-200 words. Give all necessary details and compare the segments where relevant.
View SolutionThe Bar graph given above illustrates the popular games and sports that are played in India and Pakistan. Summarise by writing an analytic paragraph (150-200 words) selecting the main features and details. Compare wherever relevant.
View Solution
