Make a bar chart of a class where students show their preference for different subjects. Forty percent prefer English, 30 percent prefer History, 15 percent prefer Physics, 10 percent. Chemistry and only 5 percent show their preference for Maths.
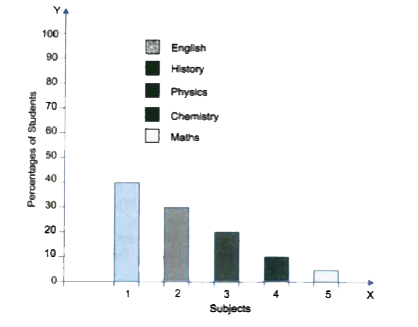
If we want to draw a bar graph, we can proceed with X-axis for showing subjects. The Y-axis is used to show the changing variable, the percentages of students. The colour index indicates the name of subjects. Bar 1 shows that 40 percent of students prefer English. Bar 2 shows that 30 percent of them like History. Bar 3 and Bar 4 show that 15 and 10 percent prefer Physics and Chemistry respectively. While only 5 percent prefer Maths. The number of students who prefer English is 8 times more than those of who prefer Maths. The number of students preferring History is thrice the number of students who prefer Chemistry as their pet subject.
Topper's Solved these Questions
- COMPOSITION - II (WRITING ANALYTICAL PARAGRAPH ON MAP/CHART/REPORT/ LINE GRAPH)BOOK - FULL MARKSCHAPTER - COMPOSITION - II (WRITING ANALYTICAL PARAGRAPH ON MAP/CHART/REPORT/ LINE GRAPH)EXERCISE - PIE CHARTS
4 Videos
- COMPOSITION - II (WRITING ANALYTICAL PARAGRAPH ON MAP/CHART/REPORT/ LINE GRAPH)BOOK - FULL MARKSCHAPTER - COMPOSITION - II (WRITING ANALYTICAL PARAGRAPH ON MAP/CHART/REPORT/ LINE GRAPH)EXERCISE - NUMERICAL TABLES
5 Videos
- COMPOSITION - II (WRITING ANALYTICAL PARAGRAPH ON MAP/CHART/REPORT/ LINE GRAPH)BOOK - FULL MARKSCHAPTER - COMPOSITION - II (WRITING ANALYTICAL PARAGRAPH ON MAP/CHART/REPORT/ LINE GRAPH)EXERCISE - ANALYTIC STUDY OF MAPS
3 Videos
- CLOZE PASSAGEBOOK - FULL MARKSCHAPTER - CLOZE PASSAGEEXERCISE - Fill in the most appropriate option in each blank from those given below to complete the following passage.
112 Videos
- COMPOSITION-IBOOK - FULL MARKSCHAPTER - COMPOSITION-IEXERCISE - IV. OFFICIAL LETTERS ON ALL SITUATIONS (SOLVED EXAMPLES)
29 Videos
Similar Questions
The line chart given below shows the marks scored by 2 students P and Q in five subjects.
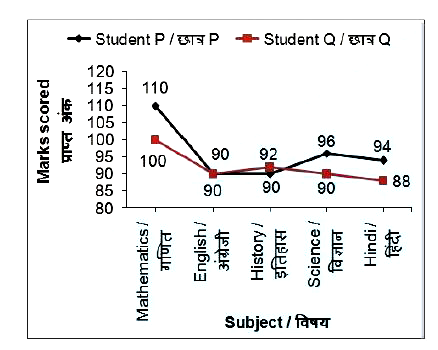
Marks scored by student Q in Hindi is what percent of marks scored by student P in Science?
View SolutionThe table given below shows the marks obtained by six students in 5 different subjects.
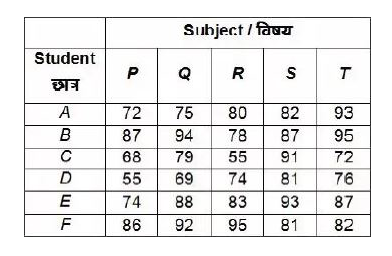
Maximum marks for each subject is 100.
Marks obtained by student B is how much percent more than the marks obtained by A?
View Solution
Knowledge Check
The bar chart given below shwos the runs scored by a bastsman in 10 different innings
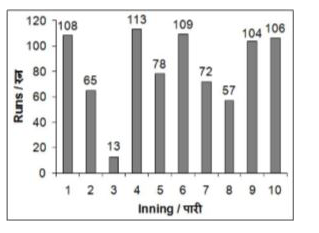
Runs scored in inning 1 is what percent of runs scored in inning 5?Aa. 131.29%Bb. 138.46%Cc. 126.17%Dd. 142.93%The table given below shows the marks obtained by six students in 5 different subjects.
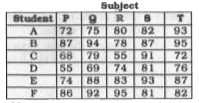
Maximum marks for each subject is 100.
Marks obtained by student B is how much per cent more than the marks obtained by A?A8.3B7.4C9.7D11.1Study the following pie-chart and answer the questions given below :
Preferences of stuents among six beverages in terms of degre of angle in the pie-chart Total no. of students = 6800
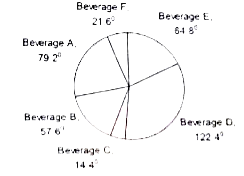
The number of students who prefer Beverage C are approximately what percent of the number of students who prefer Beverage D ?A7B12C18D22
The following data shows the number of students opting different subject in a college: Subjects, English, Maths, Physics, Chemistry, Eco., Commerce No. of Students, 45, 60, 20, 30, 10, 15 Construct a pie-diagram to represent the above data.
View SolutionThe following data shows the number of students opting different subject in a college: Subjects, English, Maths, Physics, Chemistry, Eco., Commerce No. of Students, 45, 60, 20, 30, 10, 15 Construct a pie-diagram to represent the above data.
View SolutionThe given pie chart shows expenditure on different type of sport in a particular year. Study the pie chart and answer the question below
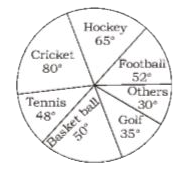
Expenditure on hockey was how much percent more than expenditure on basketball.
View SolutionThe table given below shows the number of students who were abset and percentage of students who were present in the given two examination from five different of students who were present in the Biology and Physics examination respectively.
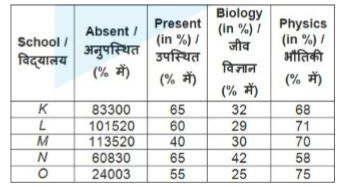
Number of students who were present in Physics examination from school M is what percent of number of students who were absent from school M, L and O?
View SolutionThe bar chart given below shows the revenue (in crores) of company A for the years 2008 to 2015.
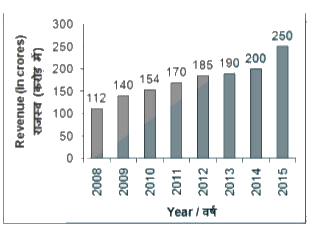
The revenue in 2015 is what percent of the revenue in 2014?
View Solution
