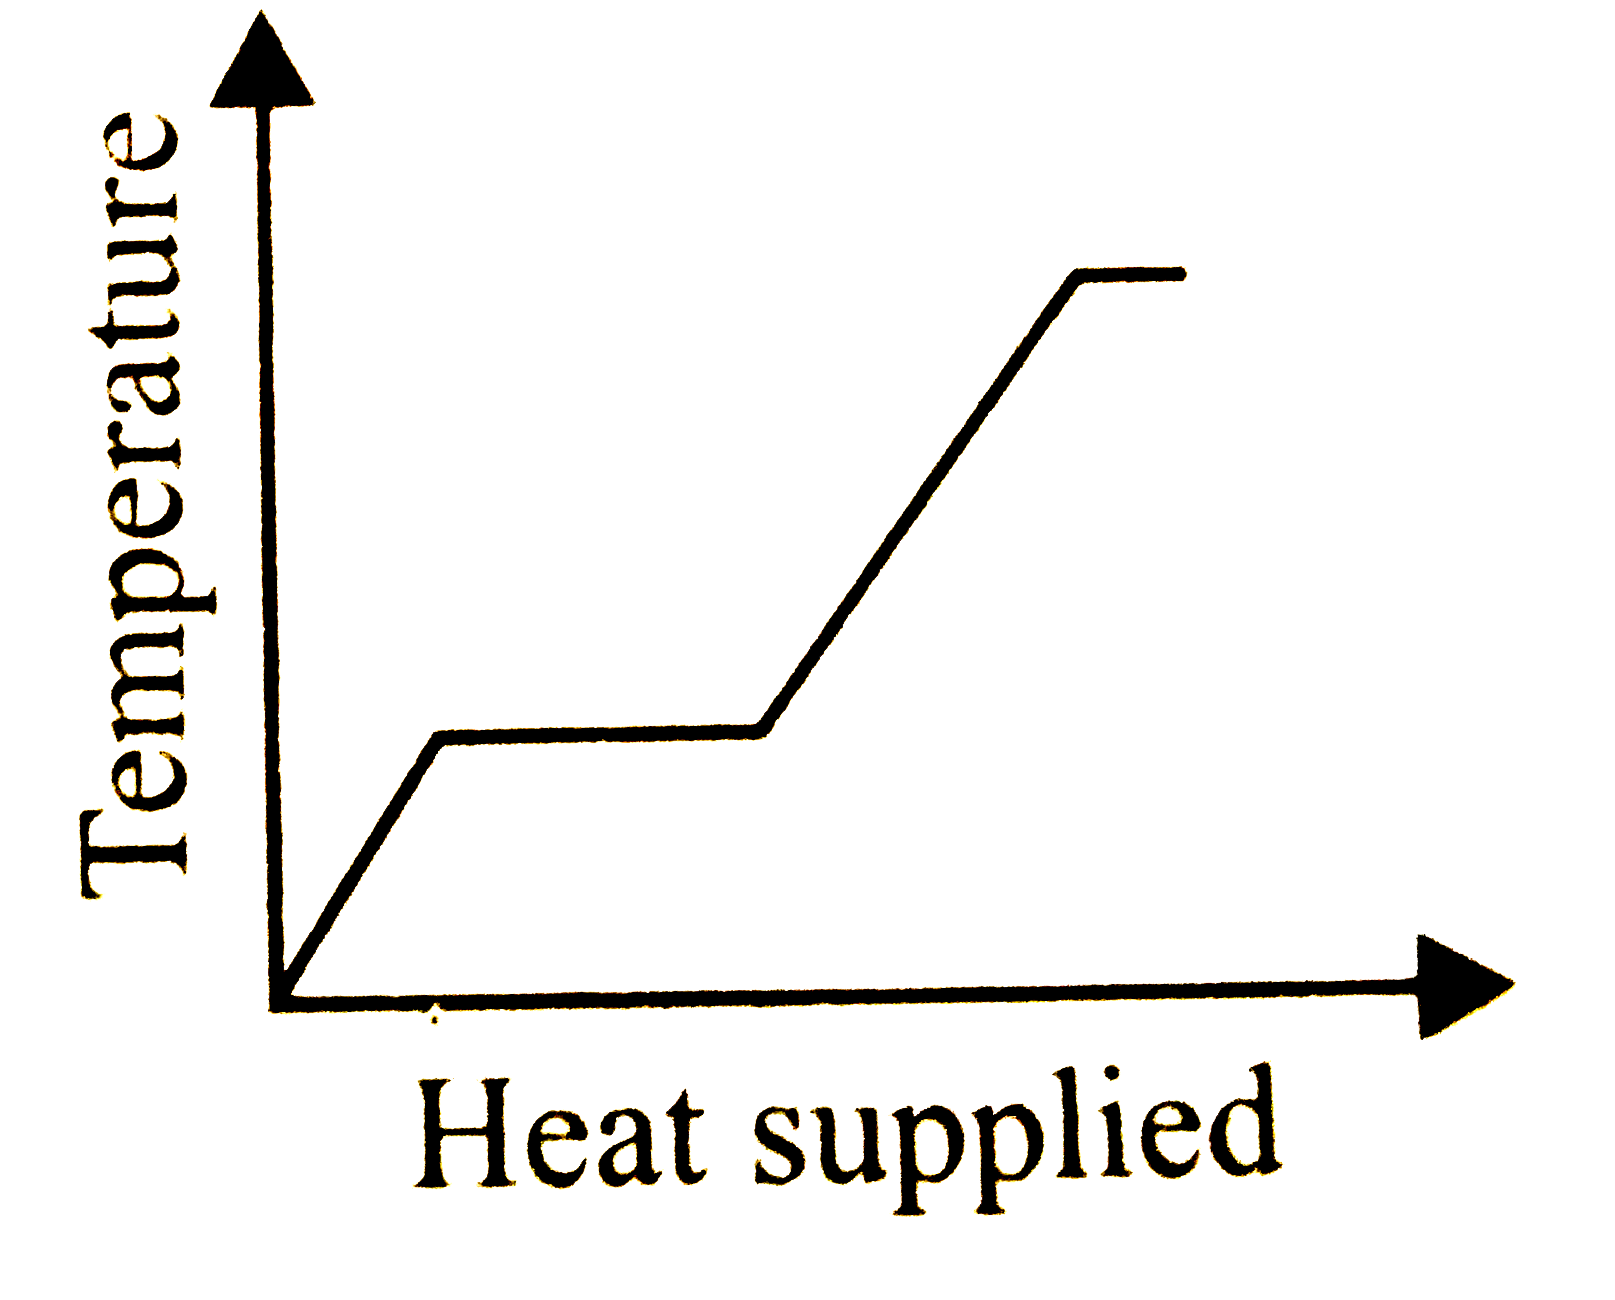
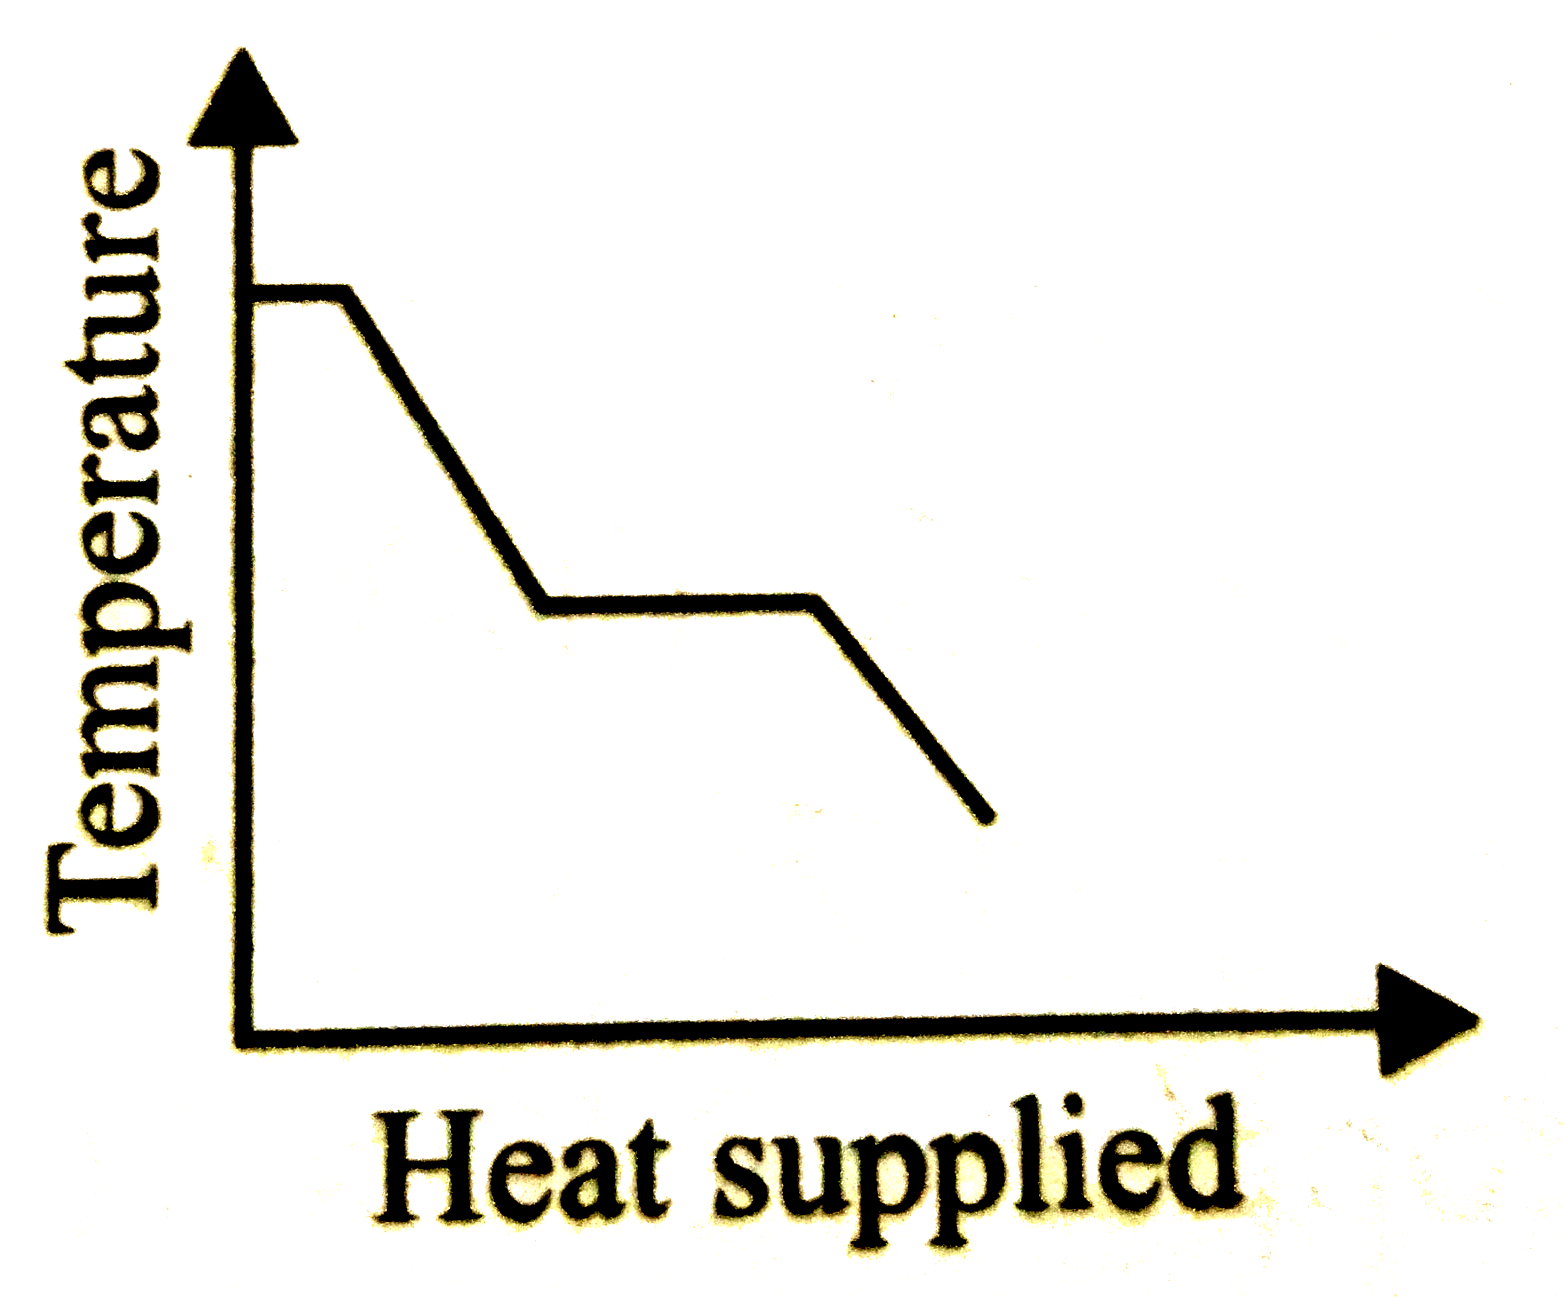
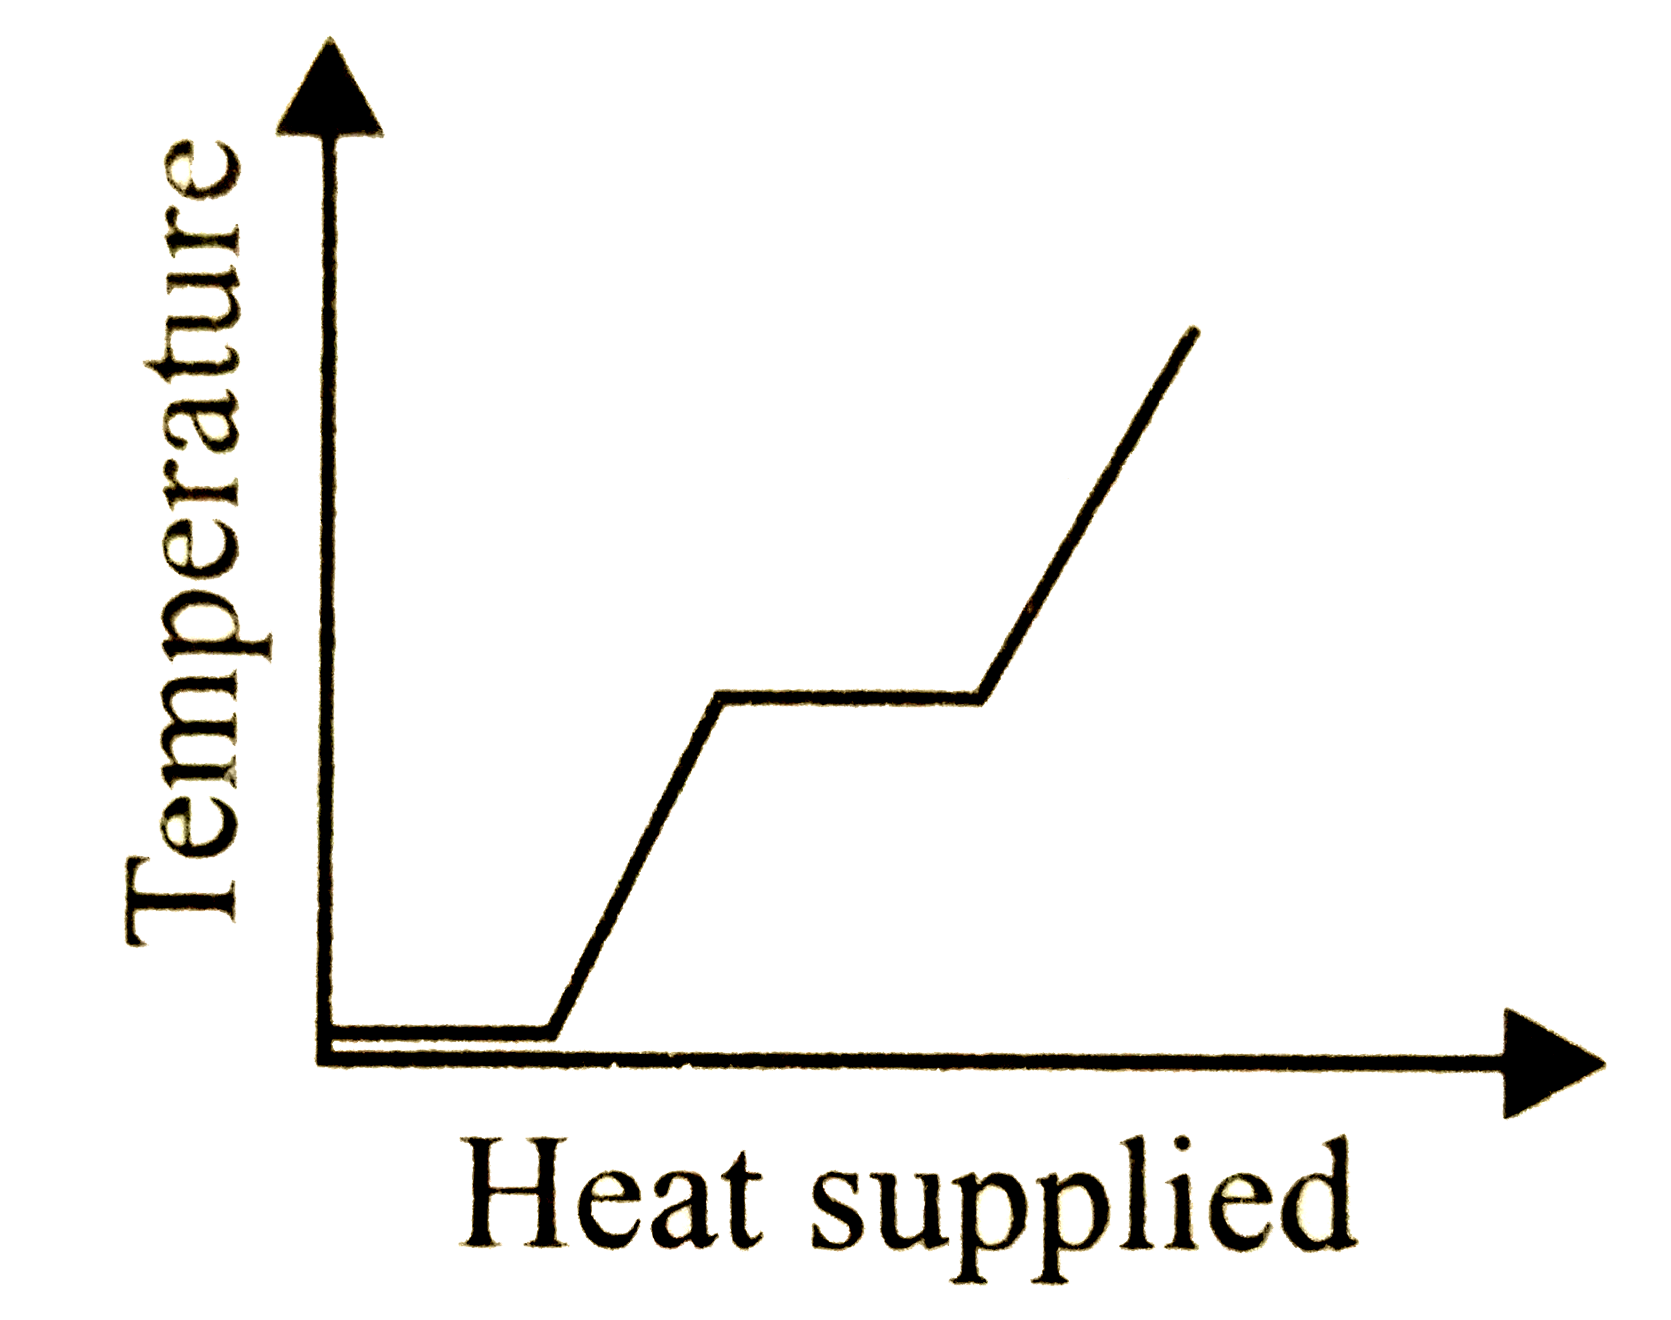
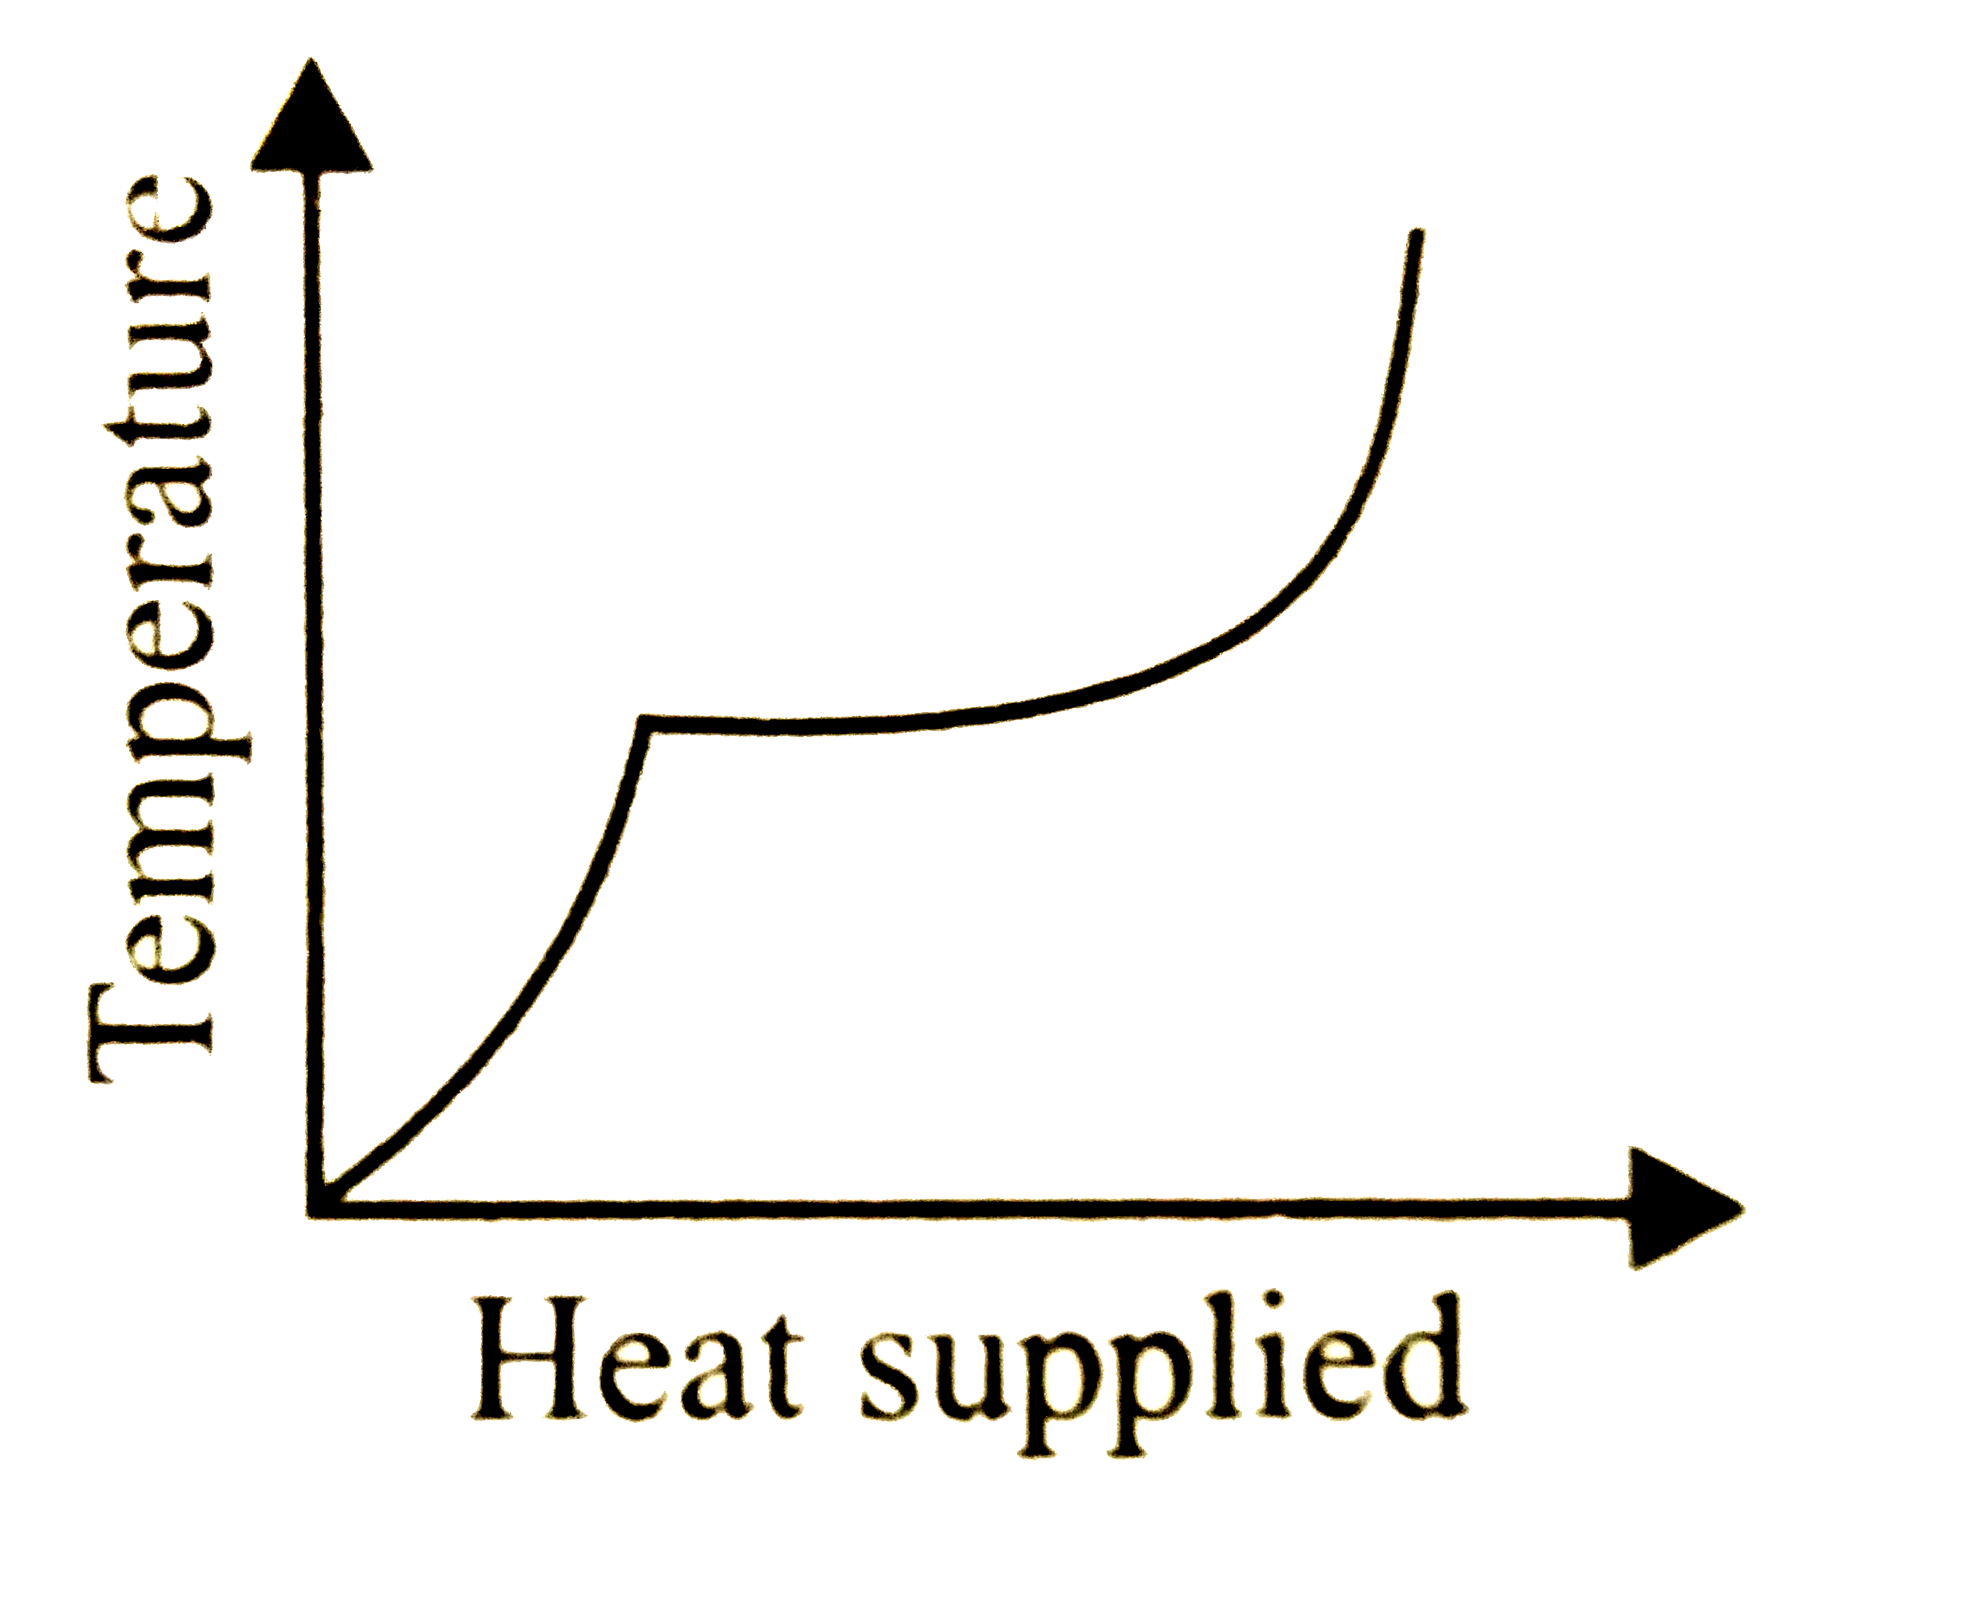
A block of ice at −10∘C is slowly heated and converted to steam at 100∘C. Which of the following curves represents the phenomenon qualitatively?


The correct Answer is:A
To solve the problem of heating a block of ice at -10°C to steam at 100°C, we will analyze the process step by step and represent it qualitatively on a graph.
Step 1: Heating the Ice from -10°C to 0°C
- Initial State: The block of ice is at -10°C.
- Process: As we apply heat, the temperature of the ice increases until it reaches 0°C.
- Graph Representation: This part of the graph will show a linear increase in temperature with respect to heat added.
Step 2: Melting the Ice at 0°C
- State Change: At 0°C, the ice begins to melt into water.
- Process: During this phase, the temperature remains constant at 0°C while the ice absorbs latent heat.
- Graph Representation: This will be a horizontal line on the graph, indicating that temperature does not change while heat is being absorbed.
Step 3: Heating the Water from 0°C to 100°C
- Process: After all the ice has melted, the temperature of the water increases from 0°C to 100°C.
- Graph Representation: This part of the graph will again show a linear increase in temperature with respect to heat added.
Step 4: Converting Water to Steam at 100°C
- State Change: At 100°C, the water begins to convert into steam.
- Process: During this phase, the temperature remains constant at 100°C while the water absorbs latent heat.
- Graph Representation: This will again be a horizontal line on the graph, indicating that temperature does not change while heat is being absorbed.
Step 5: Final State
- Final State: After all the water has turned into steam, the process can continue if more heat is added, but for this question, we stop here.
- Graph Representation: The graph ends after the horizontal line at 100°C.
Summary of the Graph
- The graph will consist of:
1. A sloped line from -10°C to 0°C (heating the ice).
2. A horizontal line at 0°C (melting the ice).
3. A sloped line from 0°C to 100°C (heating the water).
4. A horizontal line at 100°C (boiling the water to steam).
Conclusion
Based on the above analysis, the correct qualitative representation of the phenomenon is option A.
---
- Initial State: The block of ice is at -10°C.
- Process: As we apply heat, the temperature of the ice increases until it reaches 0°C.
- Graph Representation: This part of the graph will show a linear increase in temperature with respect to heat added.
- State Change: At 0°C, the ice begins to melt into water.
- Process: During this phase, the temperature remains constant at 0°C while the ice absorbs latent heat.
- Graph Representation: This will be a horizontal line on the graph, indicating that temperature does not change while heat is being absorbed.
- Process: After all the ice has melted, the temperature of the water increases from 0°C to 100°C.
- Graph Representation: This part of the graph will again show a linear increase in temperature with respect to heat added.
- State Change: At 100°C, the water begins to convert into steam.
- Process: During this phase, the temperature remains constant at 100°C while the water absorbs latent heat.
- Graph Representation: This will again be a horizontal line on the graph, indicating that temperature does not change while heat is being absorbed.
- Final State: After all the water has turned into steam, the process can continue if more heat is added, but for this question, we stop here.
- Graph Representation: The graph ends after the horizontal line at 100°C.
- The graph will consist of:
1. A sloped line from -10°C to 0°C (heating the ice).
2. A horizontal line at 0°C (melting the ice).
3. A sloped line from 0°C to 100°C (heating the water).
4. A horizontal line at 100°C (boiling the water to steam).
Based on the above analysis, the correct qualitative representation of the phenomenon is option A.
Topper's Solved these Questions
- THERMAL PROPERTIES OF MATTERBook:NCERT FINGERTPS ENGLISHChapter:THERMAL PROPERTIES OF MATTERExercise:Heat Transper
Explore 29 Videos
- THERMAL PROPERTIES OF MATTERBook:NCERT FINGERTPS ENGLISHChapter:THERMAL PROPERTIES OF MATTERExercise:Higher Order
Explore 8 Videos
- THERMAL PROPERTIES OF MATTERBook:NCERT FINGERTPS ENGLISHChapter:THERMAL PROPERTIES OF MATTERExercise:Calorimetery
Explore 4 Videos
- SYSTEM OF PARTICLES AND ROTATIONAL MOTIONSBook:NCERT FINGERTPS ENGLISHChapter:SYSTEM OF PARTICLES AND ROTATIONAL MOTIONSExercise:NCERT Exemplar
Explore 8 Videos
- THERMODYNAMICSBook:NCERT FINGERTPS ENGLISHChapter:THERMODYNAMICSExercise:Assertion And Reason
Explore 15 Videos
Similar Questions
Knowledge Check
A block of ice, initially at −20∘C, is heated a steady rate until the temperature of the sample reaches 120∘C. Which of the following graphs best illustrates the temperature of the sample as a function of time?
A B
B C
C D
D
5g ice at 0∘C is mixed with 5g of steam at 100∘C. What is the final temperature?
View Solution1 g of water at 100∘C is completely converted into steam at 100∘C. 1g of steam occupies a volume of 1650cc. (Neglect the volume of 1g of water at 100∘C). At the pressure of 105N/m2, latent heat of steam is 540 cal/g (1 Calorie=4.2 joules). The increase in the internal energy in joules is
View SolutionA certain mass of ice at 0∘C is converted to steam at 100∘C by constant heating, Draw temperature-time graph showing the change in phases.
View SolutionA certain mass of ice at 0∘C is converted to steam at 100∘C by constant heating, Draw temperature-time graph showing the change in phases.
View Solution100 g ice at 0∘C is mixed with 10 g steam at 100∘C . Find the final temperature.
View SolutionA slab of ice at 0∘C is constantly heated till the steam is formed at 100∘C. Draw a graph showing the change in temperature with time. Label the various parts of the graph properly.
View SolutionOne kilowatt electric heater is to be used with 220V d.c. supply.
(i) What is the current in the heater?
(ii) What is lts resistance?
(iii) what is the power dissipated in the heater?
(iv) How much heat in calories is produced per second?
(v) How many grams of water at 100∘C will be converted per minute into steam at 100∘C, with the heater?
Assume that the heat losses due to radiation are negligible. Latent heat of steam=540cal per gram.
View Solution