A block of ice, initially at −20∘C, is heated a steady rate until the temperature of the sample reaches 120∘C. Which of the following graphs best illustrates the temperature of the sample as a function of time?


The correct Answer is:A
Ice melts at 0∘C and boils at 100∘C during these phase transitions, the temperature remains constant. Therefore, the graph of the sample's temperature must be momentarily flat at both 0∘C and at 100∘C.
Topper's Solved these Questions
Similar Questions
A block of ice at −12∘C is slowly heated and converted into steam at 100∘C. Which of the following curves best represents the event ?
View SolutionAluminium container of mass of 10 g contains 200 g of ice at−20∘C. Heat is added to the system at the rate of 100 calories per second. What is the temperature of the system after four minutes? Draw a rough sketch showing the variation of the temperature of the system as a function of time . Given:
Specific heat of ice = 0.5calg−1(.∘C)−1
Specific heat of aluminium = 0.2calg−1(.∘C)−1
Latent heat of fusion of ice = 80calg−1
View Solution
Knowledge Check
A block of ice at −12∘C is slowly heated and converted into steam at 100∘C. Which of the following curves best represents the event ?
A B
B C
C D
D
A piece of ice is heated and the temperature is monitored as a function of time .Which of the following figures will justify the observation ?
A B
B C
C D
D
A block of ice at temperature −20∘C is slowly heated and converted to steam at 100∘C. Which of the following diagram is most appropriate?
A B
B C
C D
D
a block of ice at temperature −20∘C is slowly heated and converted to steam at 100∘C which of the following diagram is most appropriate
View Solutiona block of ice at temperature −20∘C is slowly heated and converted to steam at 100∘C which of the following diagram is most appropriate
View Solution
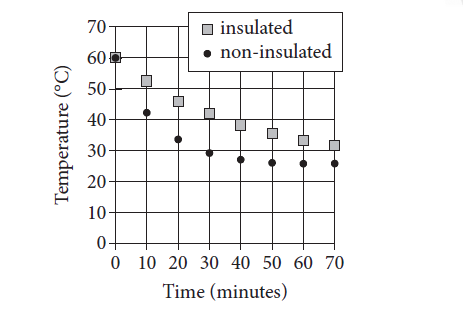
Two samples of water of equal mass are heated to 60 degrees Celsius (°C). One sample is poured into an insulated container, and the other sample is poured into a non-insulated container. The samples are then left for 70 minutes to cool in a room having a temperature of 25°C. The graph above shows the temperature of each sample at 10-minute intervals. Which of the following statements correctly compares the average rates at which the temperatures of the two samples change?
View SolutionWe add the same amount of heat to ten grams of each of the following substance at 20∘C. Which of the samples show the lowest temperature change?
View Solution100 g of ice at −15∘C was heated. The rise in temperature of ice was plotted against the heat given to ice. Which of the following graphs (Fig. 6.2) correctly depicts this behaviour?
View Solution
