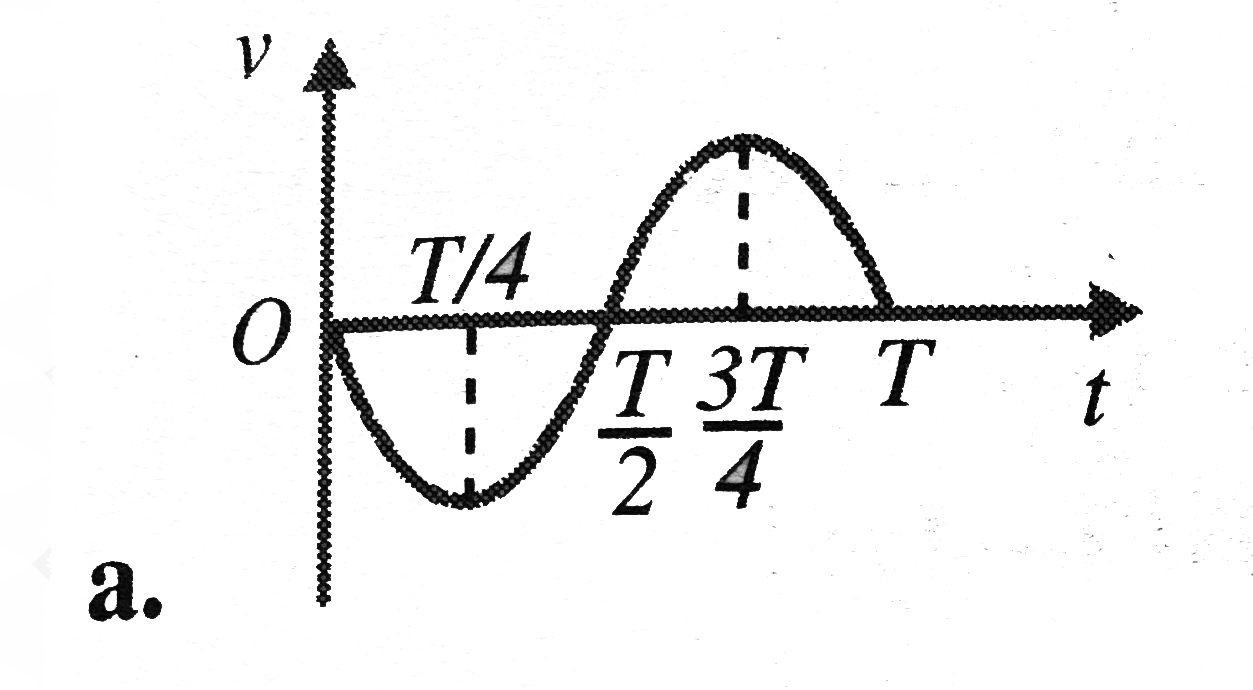
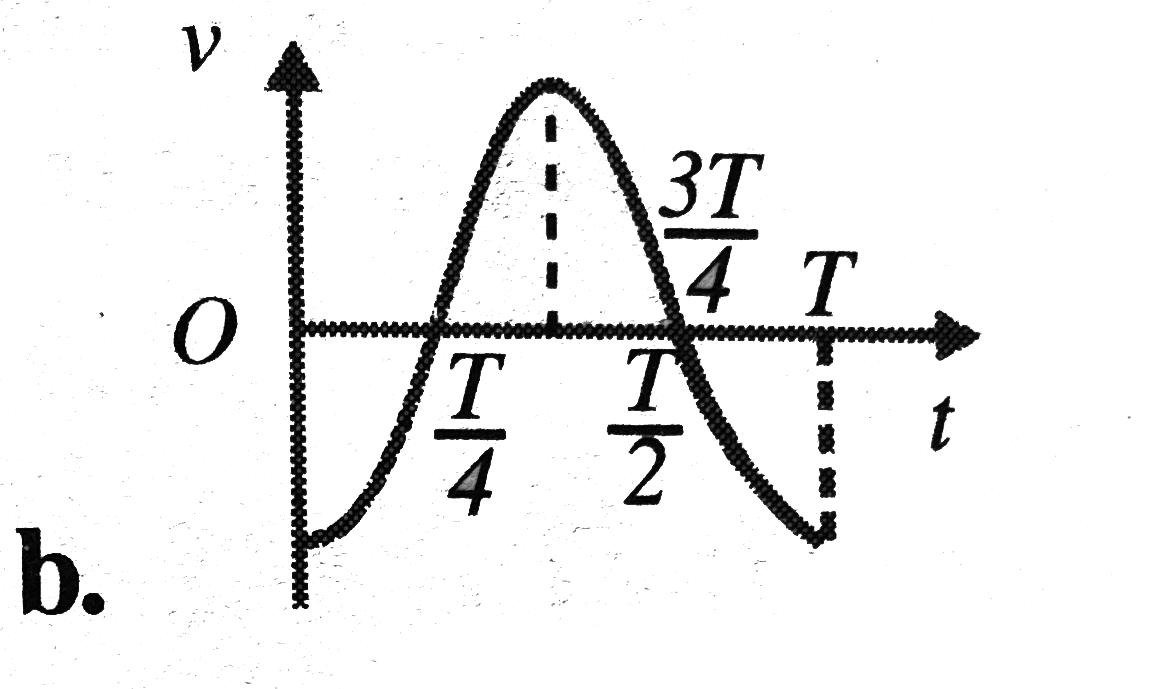
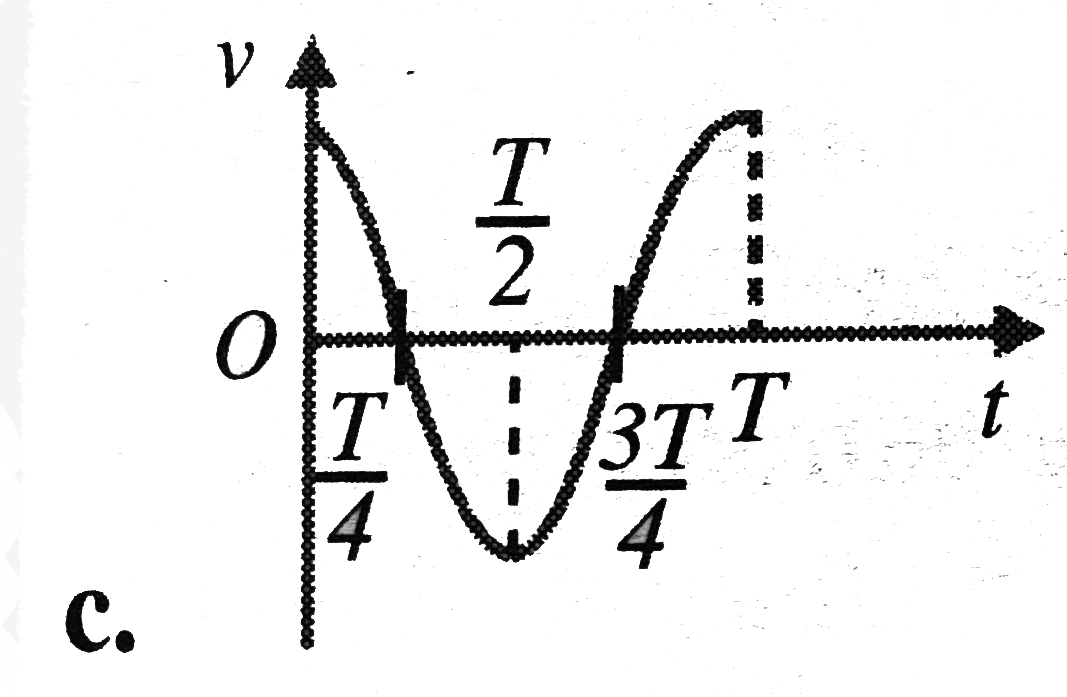
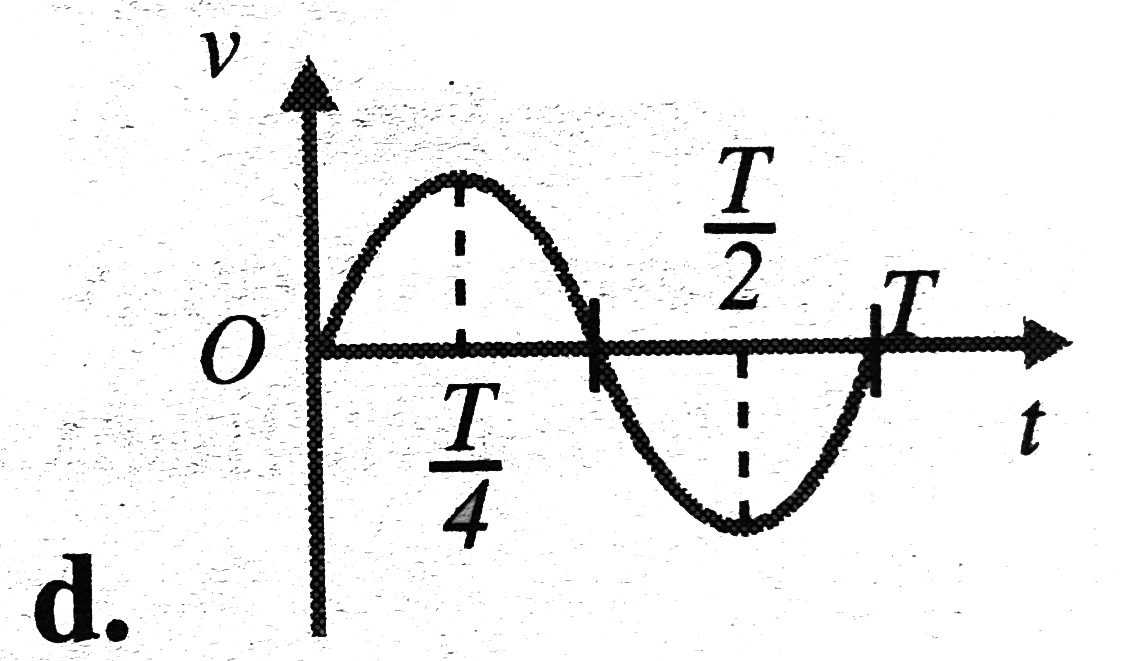
A body is performing simple harmonic motion with amplitude a and line period T variation of its acceleration (f) with time(t) is shown in figure If a line x velocity of the body is x which of the following graph is correct?

The correct Answer is:A
From graph of acceleration and time graph
f=fmaxcosωt=−(ω2A)cosωt
And we have relationship between acceleration and position as f=−ω2ξmpliesx=Acosωt
which gives v=dxdt=−Aωsinωt=−vmaxsinωt
Hence option (a) is correct.
Topper's Solved these Questions
- LINEAR AND ANGULAR SIMPLE HARMONIC MOTIONBOOK - CENGAGE PHYSICSCHAPTER - LINEAR AND ANGULAR SIMPLE HARMONIC MOTIONEXERCISE - Multiple Correct
35 Videos
- LINEAR AND ANGULAR SIMPLE HARMONIC MOTIONBOOK - CENGAGE PHYSICSCHAPTER - LINEAR AND ANGULAR SIMPLE HARMONIC MOTIONEXERCISE - Assertion Reasoning
6 Videos
- LINEAR AND ANGULAR SIMPLE HARMONIC MOTIONBOOK - CENGAGE PHYSICSCHAPTER - LINEAR AND ANGULAR SIMPLE HARMONIC MOTIONEXERCISE - Subjective
21 Videos
- KINETIC THEORY OF GASES AND FIRST LAW OF THERMODYNAMICSBOOK - CENGAGE PHYSICSCHAPTER - KINETIC THEORY OF GASES AND FIRST LAW OF THERMODYNAMICSEXERCISE - Interger
11 Videos
- MISCELLANEOUS KINEMATICSBOOK - CENGAGE PHYSICSCHAPTER - MISCELLANEOUS KINEMATICSEXERCISE - Interger type
3 Videos
Similar Questions
A simple harmonic motion has an amplitude A and time period T. What is the time taken to travel from x=A to x=A/2?
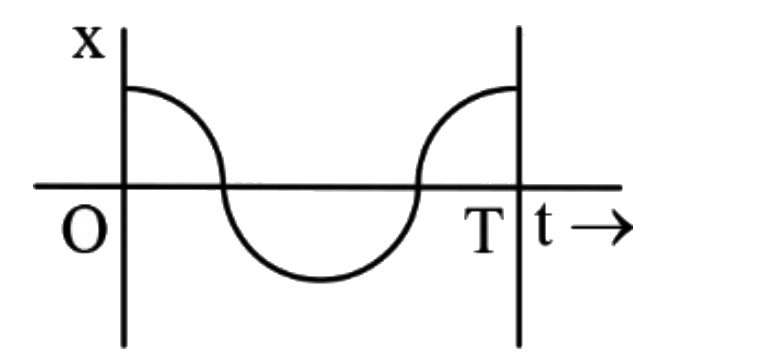
View SolutionA body is performing simple harmonic motion of amplitude A and time period T. The figure shown position-time graph of the body . At any time t, acceleration of the body is f, then which of the following graphs is/are appropriate?
View Solution
Knowledge Check
A body is performing simple harmonic motion with amplitude A and time period T variation of its acceleration (f) with time(t) is shown in figure If a line x velocity of the body is x which of the following graph is correct?
 A
A B
B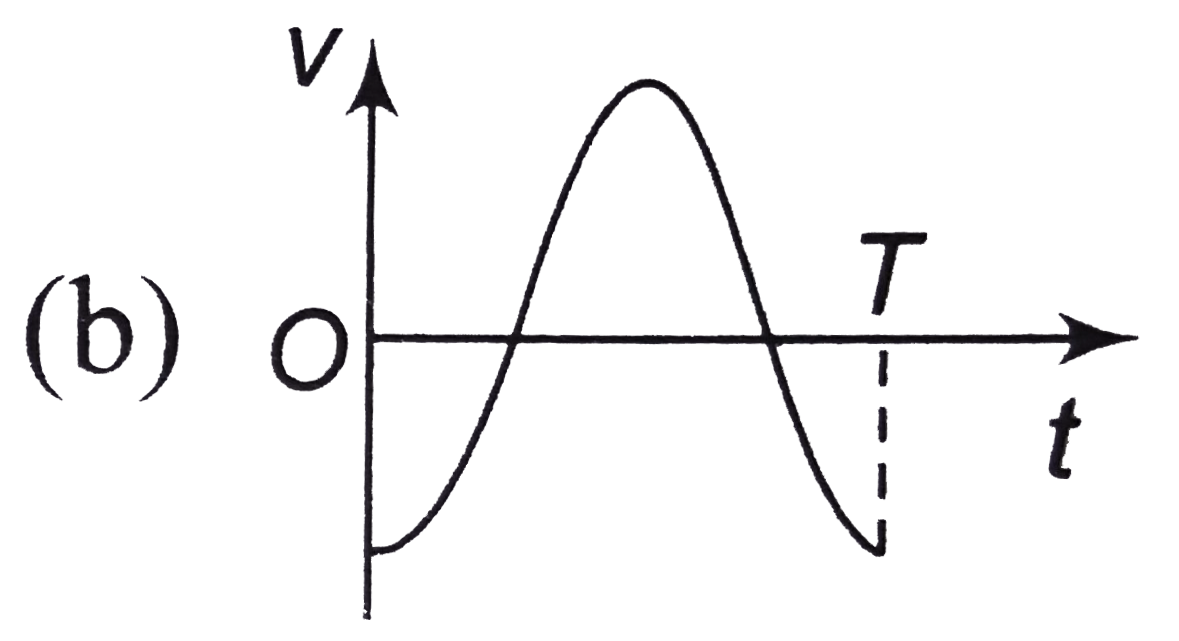 C
C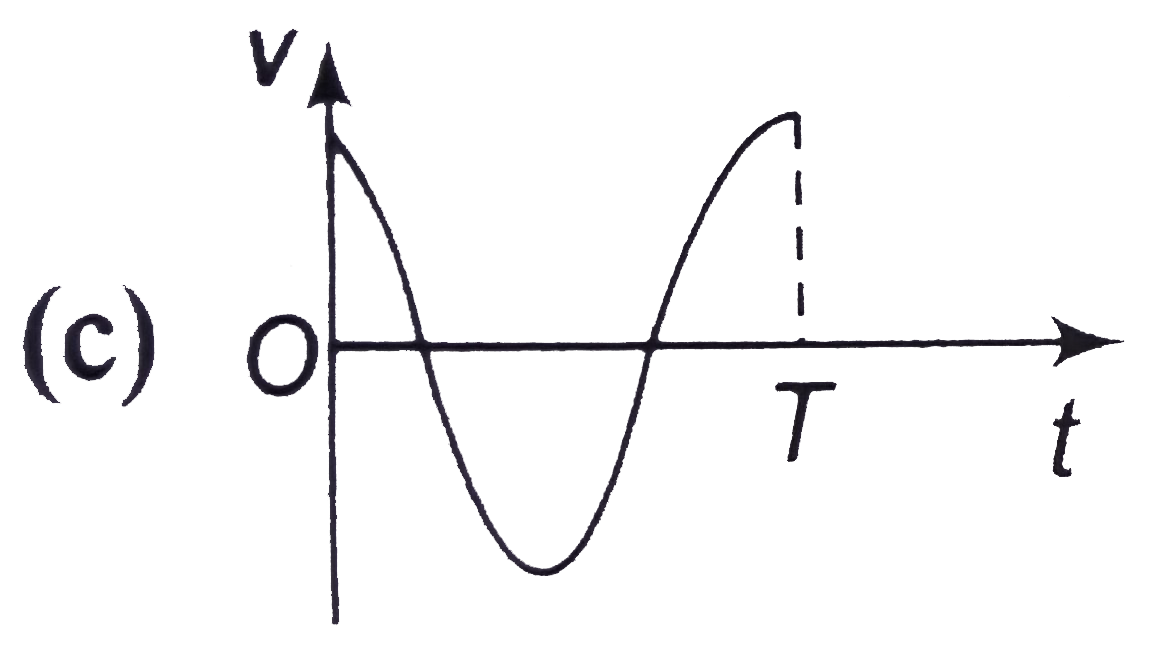 D
D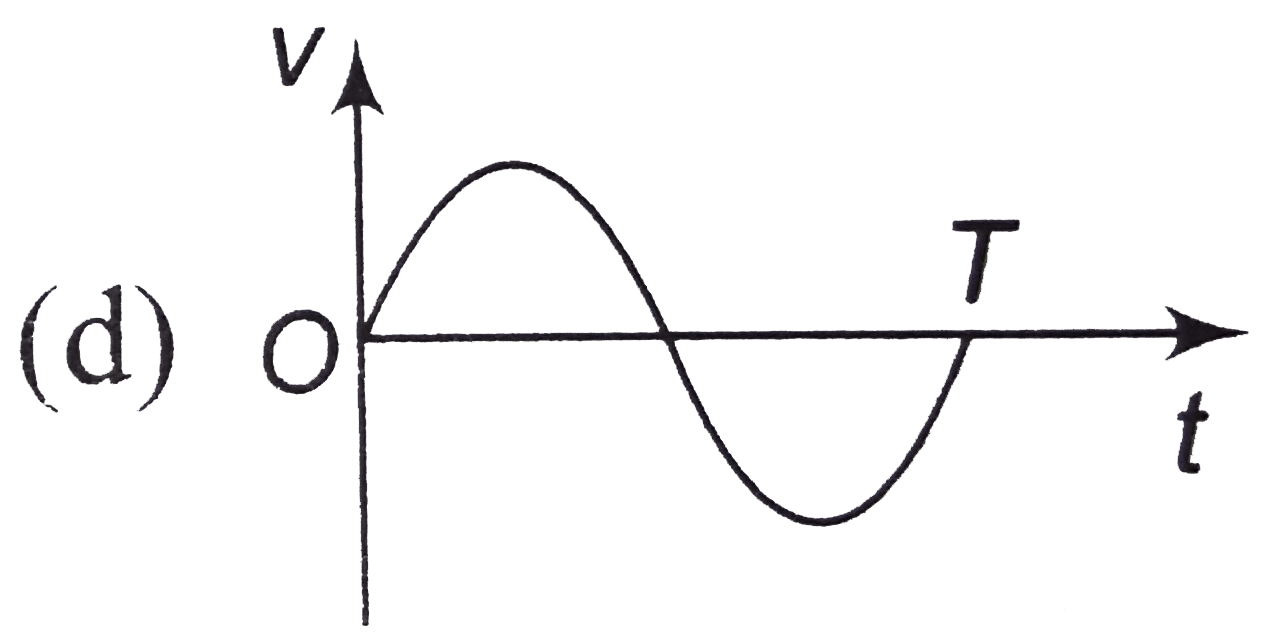
A body is performing simple harmonic motion. Then its
Aaverage total energy per cycle is equal to its maximum kinetic energy.Baverage kinetic energy per cycle is equal to half of its maximum kinetic energy.Caverage total energy per cycle is equal to half of its malximum kinetic energy.DNone of these.A simple harmonic motino has amplitude A and time period T. The maxmum velocity will be
A4ATB2ATC2π√ATD2πAT
A simple harmonic motion of amplitude A has a time period T. The acceleration of the oscillator when its displacement is half the amplitude is
View SolutionA body is vibrating in simple harmonic motion with an amplitude of 0.06 m and frequency of 15 Hz . The velocity and acceleration of body is
View SolutionA particle is performing simple harmonic motion with amplitude A and angular velocity ω . The ratio of maximum velocity to maximum acceleration is
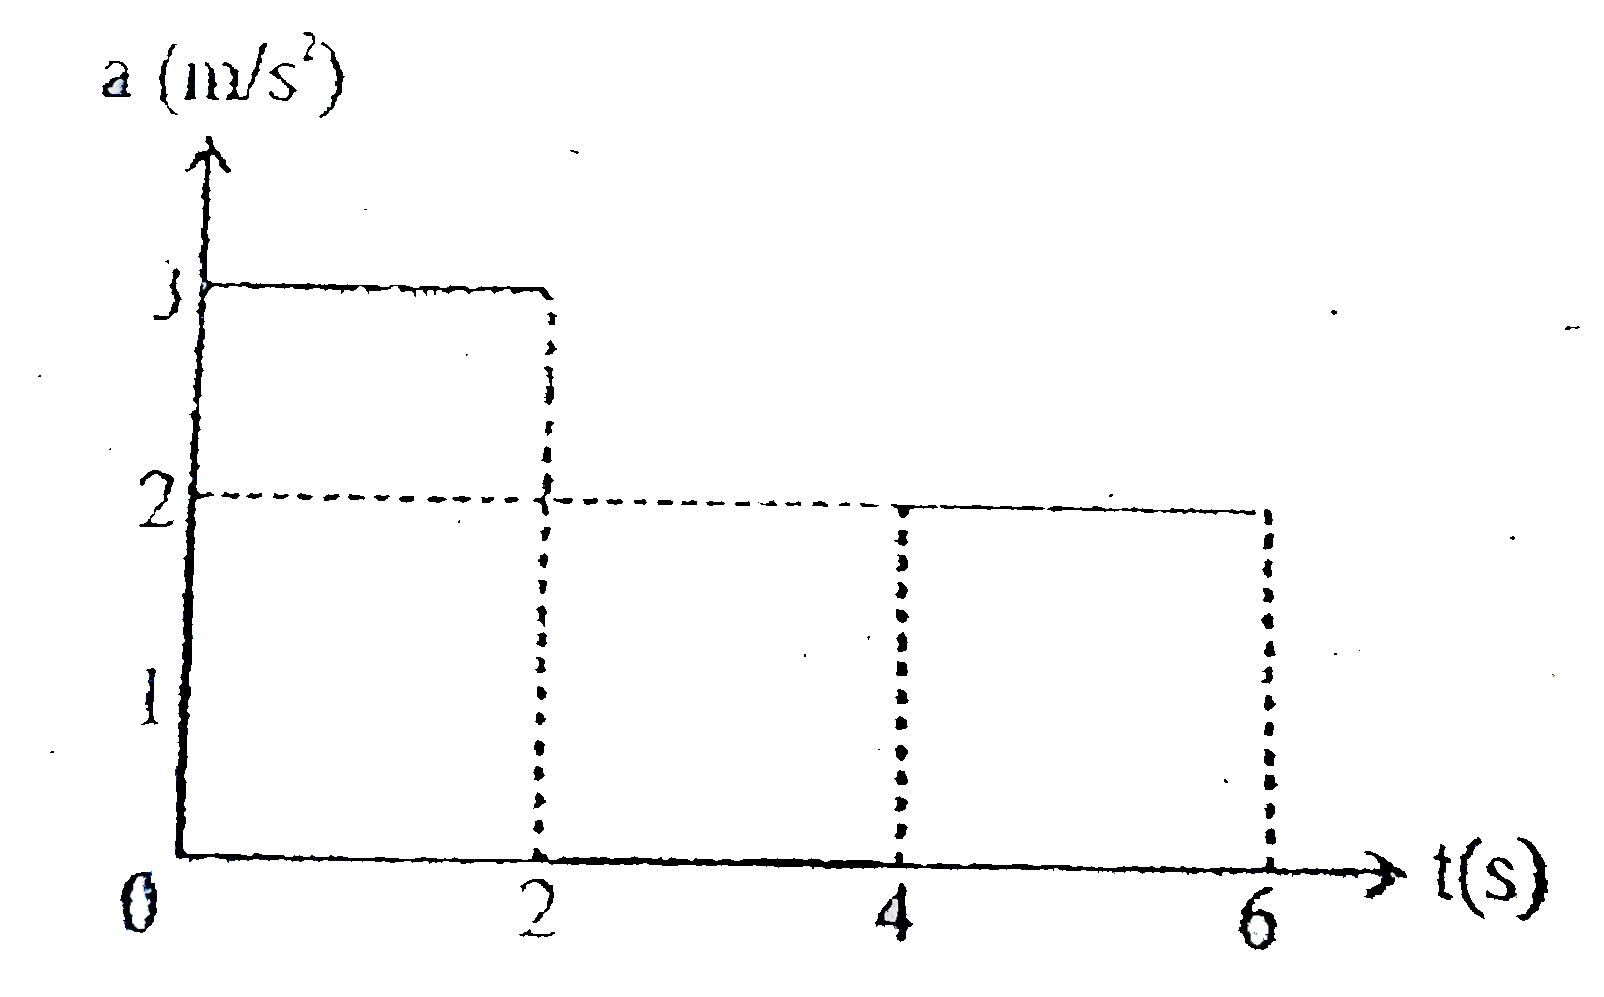
View SolutionThe dependence of the acceleration of a body with time is shown in Figure. At t=0, the velocity of the body is −3m/s and position is x=0m.
View SolutionA simple pendulum performs simple harmonic motion about x=0 with an amplitude a and time period T speed of the pendulum at x=a/2 will be
View Solution
