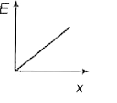
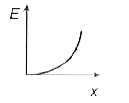
A body moves from rest with a constant ac- celeration. Which of the following graphs represents the variation of its kinetic energy (E) with distance travelled (x)?
A
B
C
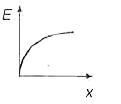
D

Video Solution
Text Solution
The correct Answer is:A
Also, v2=u2+ 2as
= 2 as
∴E∝v2∝ S, as a is constant .
It is of the fonn y ∝ x , which is the equation of a straight line passing through the origin, as shown in (a).
|
Topper's Solved these Questions
Similar Questions
Knowledge Check
A body moves from rest with a constant acceleration. Which one of the following graphs represents the variation of its kinetic energy K with the distance travelled x?
A B
B C
C D
D
A body moves from rest with a constant acceleration. Which one of the following graphs represents the variation of its kinetic energy K with the distance travelled x?
A B
B C
C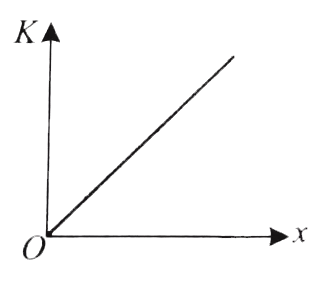 D
D
Which of the following graph represents e−x?
A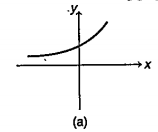 B
B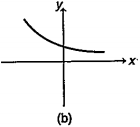 C
C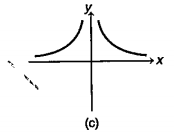 D
D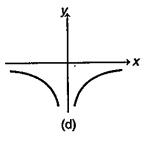
Which of the following graph represents e−x?
View SolutionWhich of the following graphs best represents the variation of acceleration 'a' with displacement x?
View SolutionA body starting from the the rest moves along a straight line with constant acceleration. Which one of the following graphs represents the variation of speed(v) and distance(s)?
View SolutionA body starting from the rest moves along a straight line with constant acceleration .Which one of the following graphs represent the variation of speed (v) and distance (s) ?
View SolutionWhich of the following represents the graph of e−x2:
View Solution

