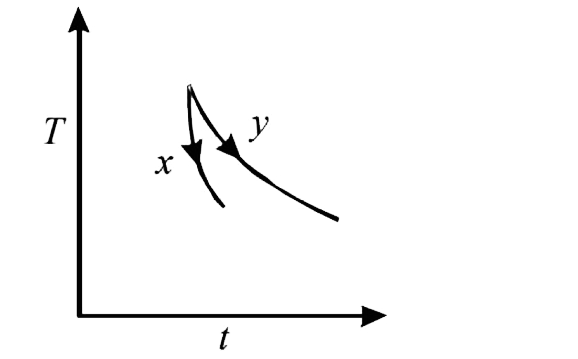
A graph showing the variation of temperature with time for two bodies P and Q due to emission of radiation is shown. If P and Q have surface area, then the correct relation between the emissivity and absorptivity power of the two bodies is

eP>eQ and aP<aQ
eP<eQ and aP>aQ
eP<eQ and aP<aQ
eP>eQ andaP>aQ
The correct Answer is:D
Rate of cooling, −dTdt∝ Emissivity (e)
From graph,
−(dTdt)P>(−dTdt)Q [Slope is more for P]
∴eP>eQ
Also, e∝ absorptive power (a)
∴aP>aQ
Topper's Solved these Questions
- BOOK - MODERN PUBLICATIONCHAPTER - THERMAL PROPERTIES OF MATTEREXERCISE - COMPETITION FILE (OBJECTIVE TYPE QUESTION ((B) MULTIPLE CHOICE QUESTION FROM CPMPETITIVE EXAMINATION ) AIMPMT/NEET AND OTHER STATE BOARDS FOR MEDICAL ENTRANCE)18videos
THERMAL PROPERTIES OF MATTER
- BOOK - MODERN PUBLICATIONCHAPTER - THERMAL PROPERTIES OF MATTEREXERCISE - COMPETITION FILE (OBJECTIVE TYPE QUESTION ((B) MULTIPLE CHOICE QUESTION FROM CPMPETITIVE EXAMINATION ) JEE MAIN AND OTHER STATE BOARDS FOR ENGINEERING ENTRANCE)19videos
THERMAL PROPERTIES OF MATTER
- BOOK - MODERN PUBLICATIONCHAPTER - THERMAL PROPERTIES OF MATTEREXERCISE - REVISION EXERCISE (NUMERICAL PROBLEM)19videos
THERMAL PROPERTIES OF MATTER
- BOOK - MODERN PUBLICATIONCHAPTER - SYSTEMS OF PARTICLES AND ROTATIONAL MOTIONEXERCISE - Chapter Practice Test (for Board Examination)16videos
SYSTEMS OF PARTICLES AND ROTATIONAL MOTION
- BOOK - MODERN PUBLICATIONCHAPTER - UNITS AND MEASUREMENTEXERCISE - CHAPTER PRACTICE TEST15videos
UNITS AND MEASUREMENT
Similar Questions
The graph, shown in the adjacent diagram, represents the variation of temperature (T) of two bodies, x and y having same surface area, with time (t) due to the emission of radiation. Find the correct relation between the emissivity and absorptivity power of the two bodies
 View Solution
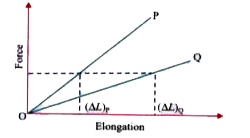
The graph in Fig. 11.8 shows the variation of elongation with tensile force for two wires P and Q.

If P and Q are of the same material and have the same length, which one has a greater area of cross section ?View Solution
Knowledge Check
- Question 1 - Select One
Relation between emissivity e and absorptive power a is (for black body)
Ae=aBe=1aCe=a2Da=e2 - Question 2 - Select One
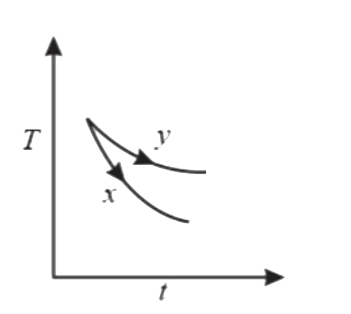
The graph, shown in the adjacent diagram, represents the variation of temperature (T) of two bodies, x and y having same surface area, with time (t) due to the emission of radiation. Find the correct relation between the emissivity and absorptivity power of the two bodies
 AEx>Ey&ax<ayBEx<Ey&ax>ayCEx>Ey&ax>ayDEx<Ey&ax<ay
 - Question 3 - Select One
The graph shown in the adjacement diagram represents the variation of temperature (T) of two bodies x and y having the same surface area, with time (t). Both of these bodies lose heat only due to the emission of radiation. Find the correct relation between the emissive and absorptive power of the two bodies.
 AEx>Eyandax<ayBEx<Eyandax>ayCEx>Eyandax>ayDEx<Eyandax<ay
Two bodies of same shape, same size and same radiating power have emissivities 0.2 and 0.8. The ratio of their temperatures is
View SolutionHeat energy at constant rate is given to two substances P and Q. If variation of temperature (7) of substances with time (1) is as shown in figure, then select the correct statement
View SolutionHeat energy at constant rate is given to two substances P and Q. If variation of temperature (T) of substances with time (t) is as shown in figure, then select the correct statement
View SolutionThe temperatures of two bodies A and B are 727∘C and 127∘C . The ratio of rate of emission of radiations will be
View SolutionA body P moves with unifrom velocity and another body Q moves with uniform retardation. The correct velocity time graph of the two bodies is
View Solution

