A material particle is moving along a straight line in such a manner that its velocity varies as shown in the figure. At which moment in time numbered successively on the time axis will the acceleration of the particle be maximal? How should one use the graph to determine the average velocity of motion over the time interval from t1 to t2 ?
Step by step video & image solution for A material particle is moving along a straight line in such a manner that its velocity varies as shown in the figure. At which moment in time numbered successively on the time axis will the acceleration of the particle be maximal? How should one use the graph to determine the average velocity of motion over the time interval from t_1 to t_2 ? by Physics experts to help you in doubts & scoring excellent marks in Class 11 exams.
Updated on:21/07/2023Topper's Solved these Questions
Similar Questions
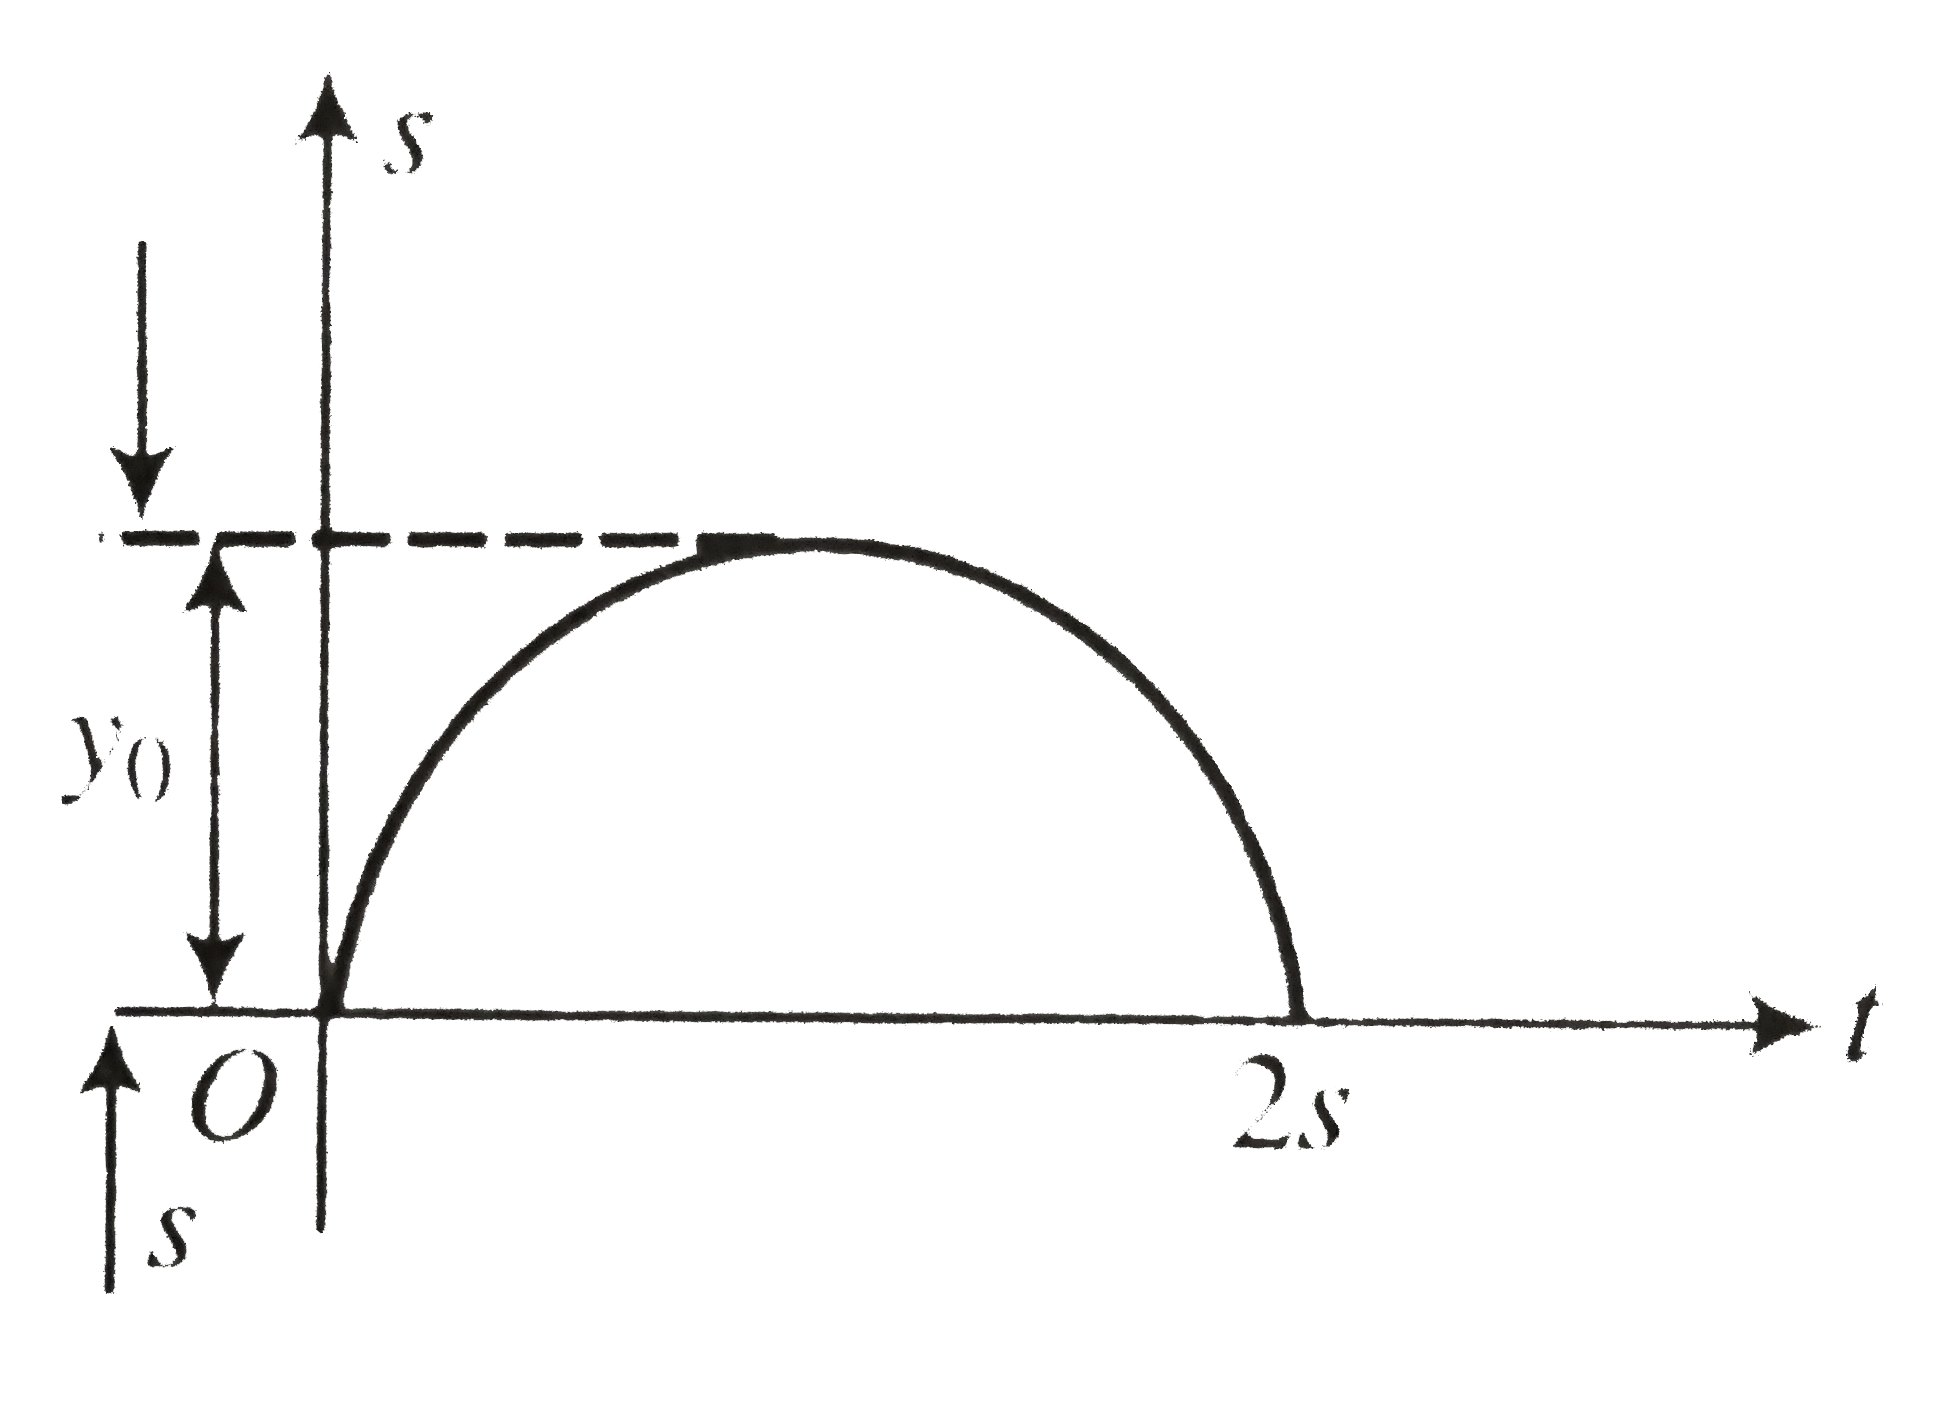
A particle moves rectilinearly possessing a parabolic s-t graph. Find the average velocity of the particle over a time interval from t=12s→t=1.5s.
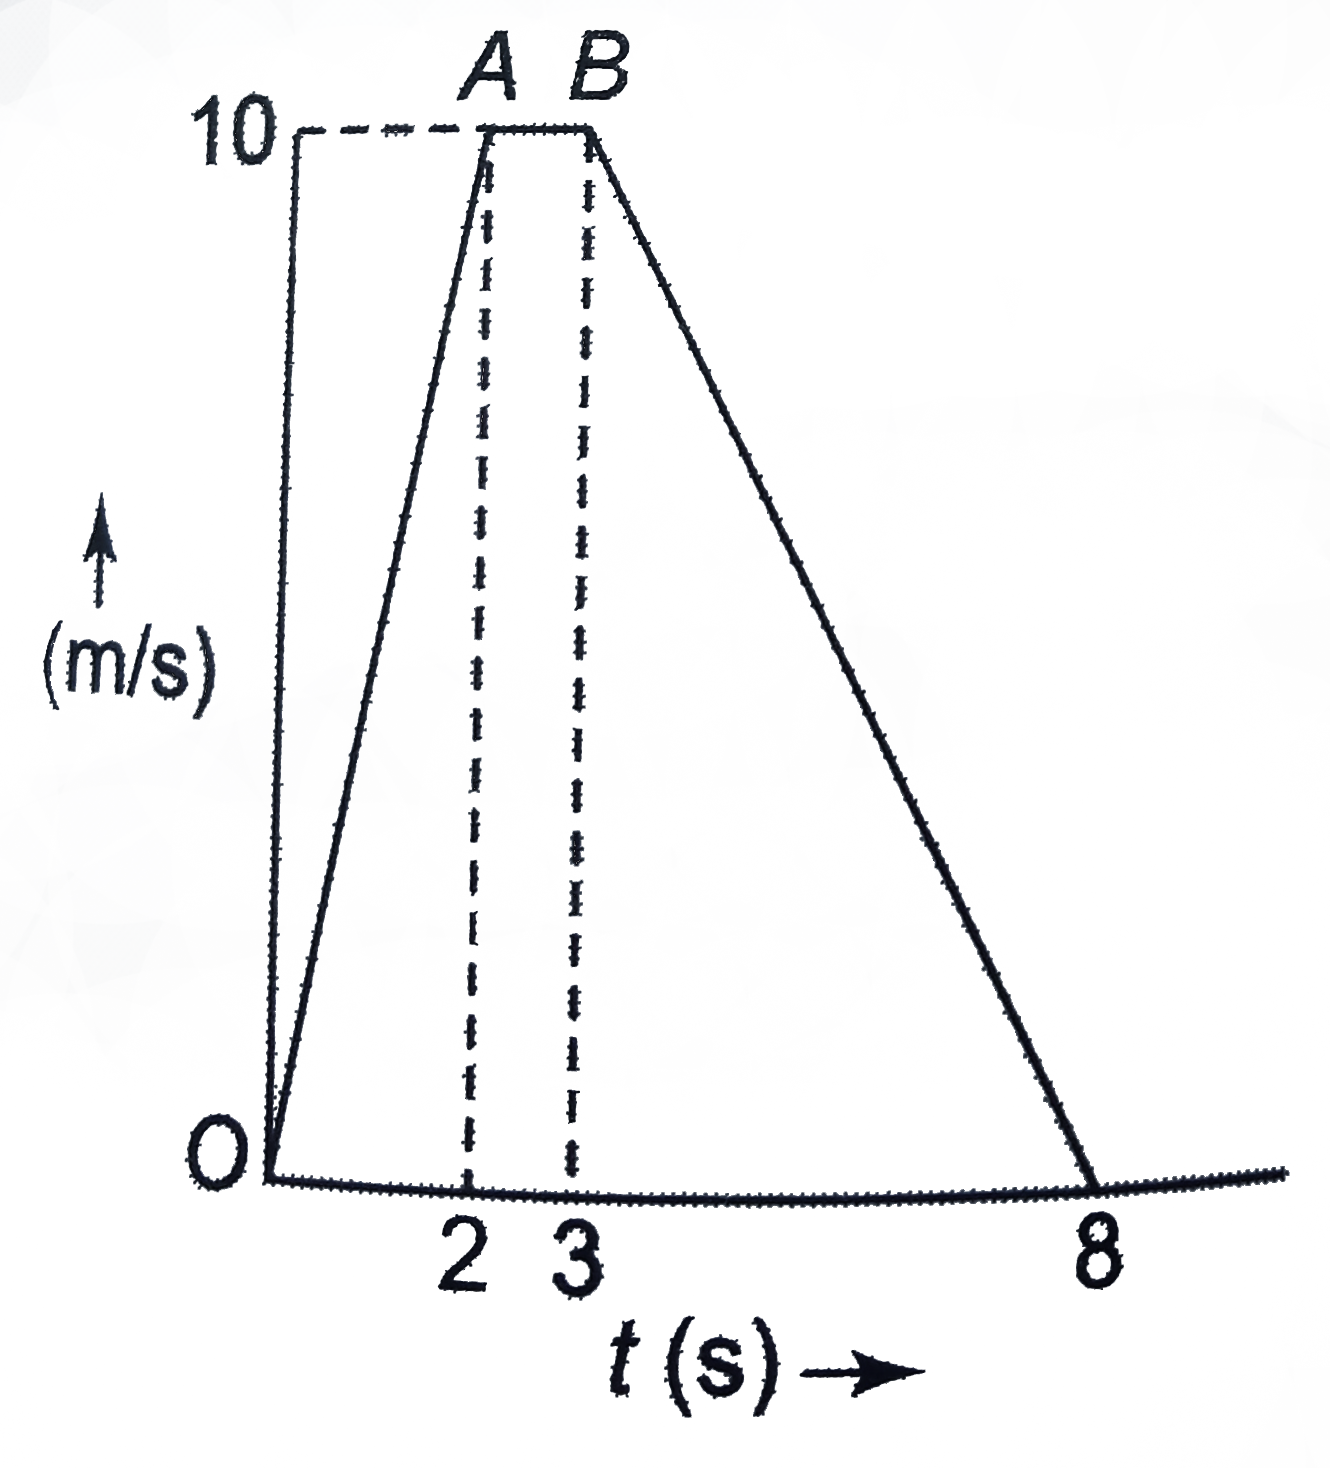
View SolutionFor a particle moving in a straight line, the velocity-time graph is as shown in the figure. Find the acceleration at time t=1s2.5s and 5s. Sketch the acceleration time graph.
View Solution
Knowledge Check
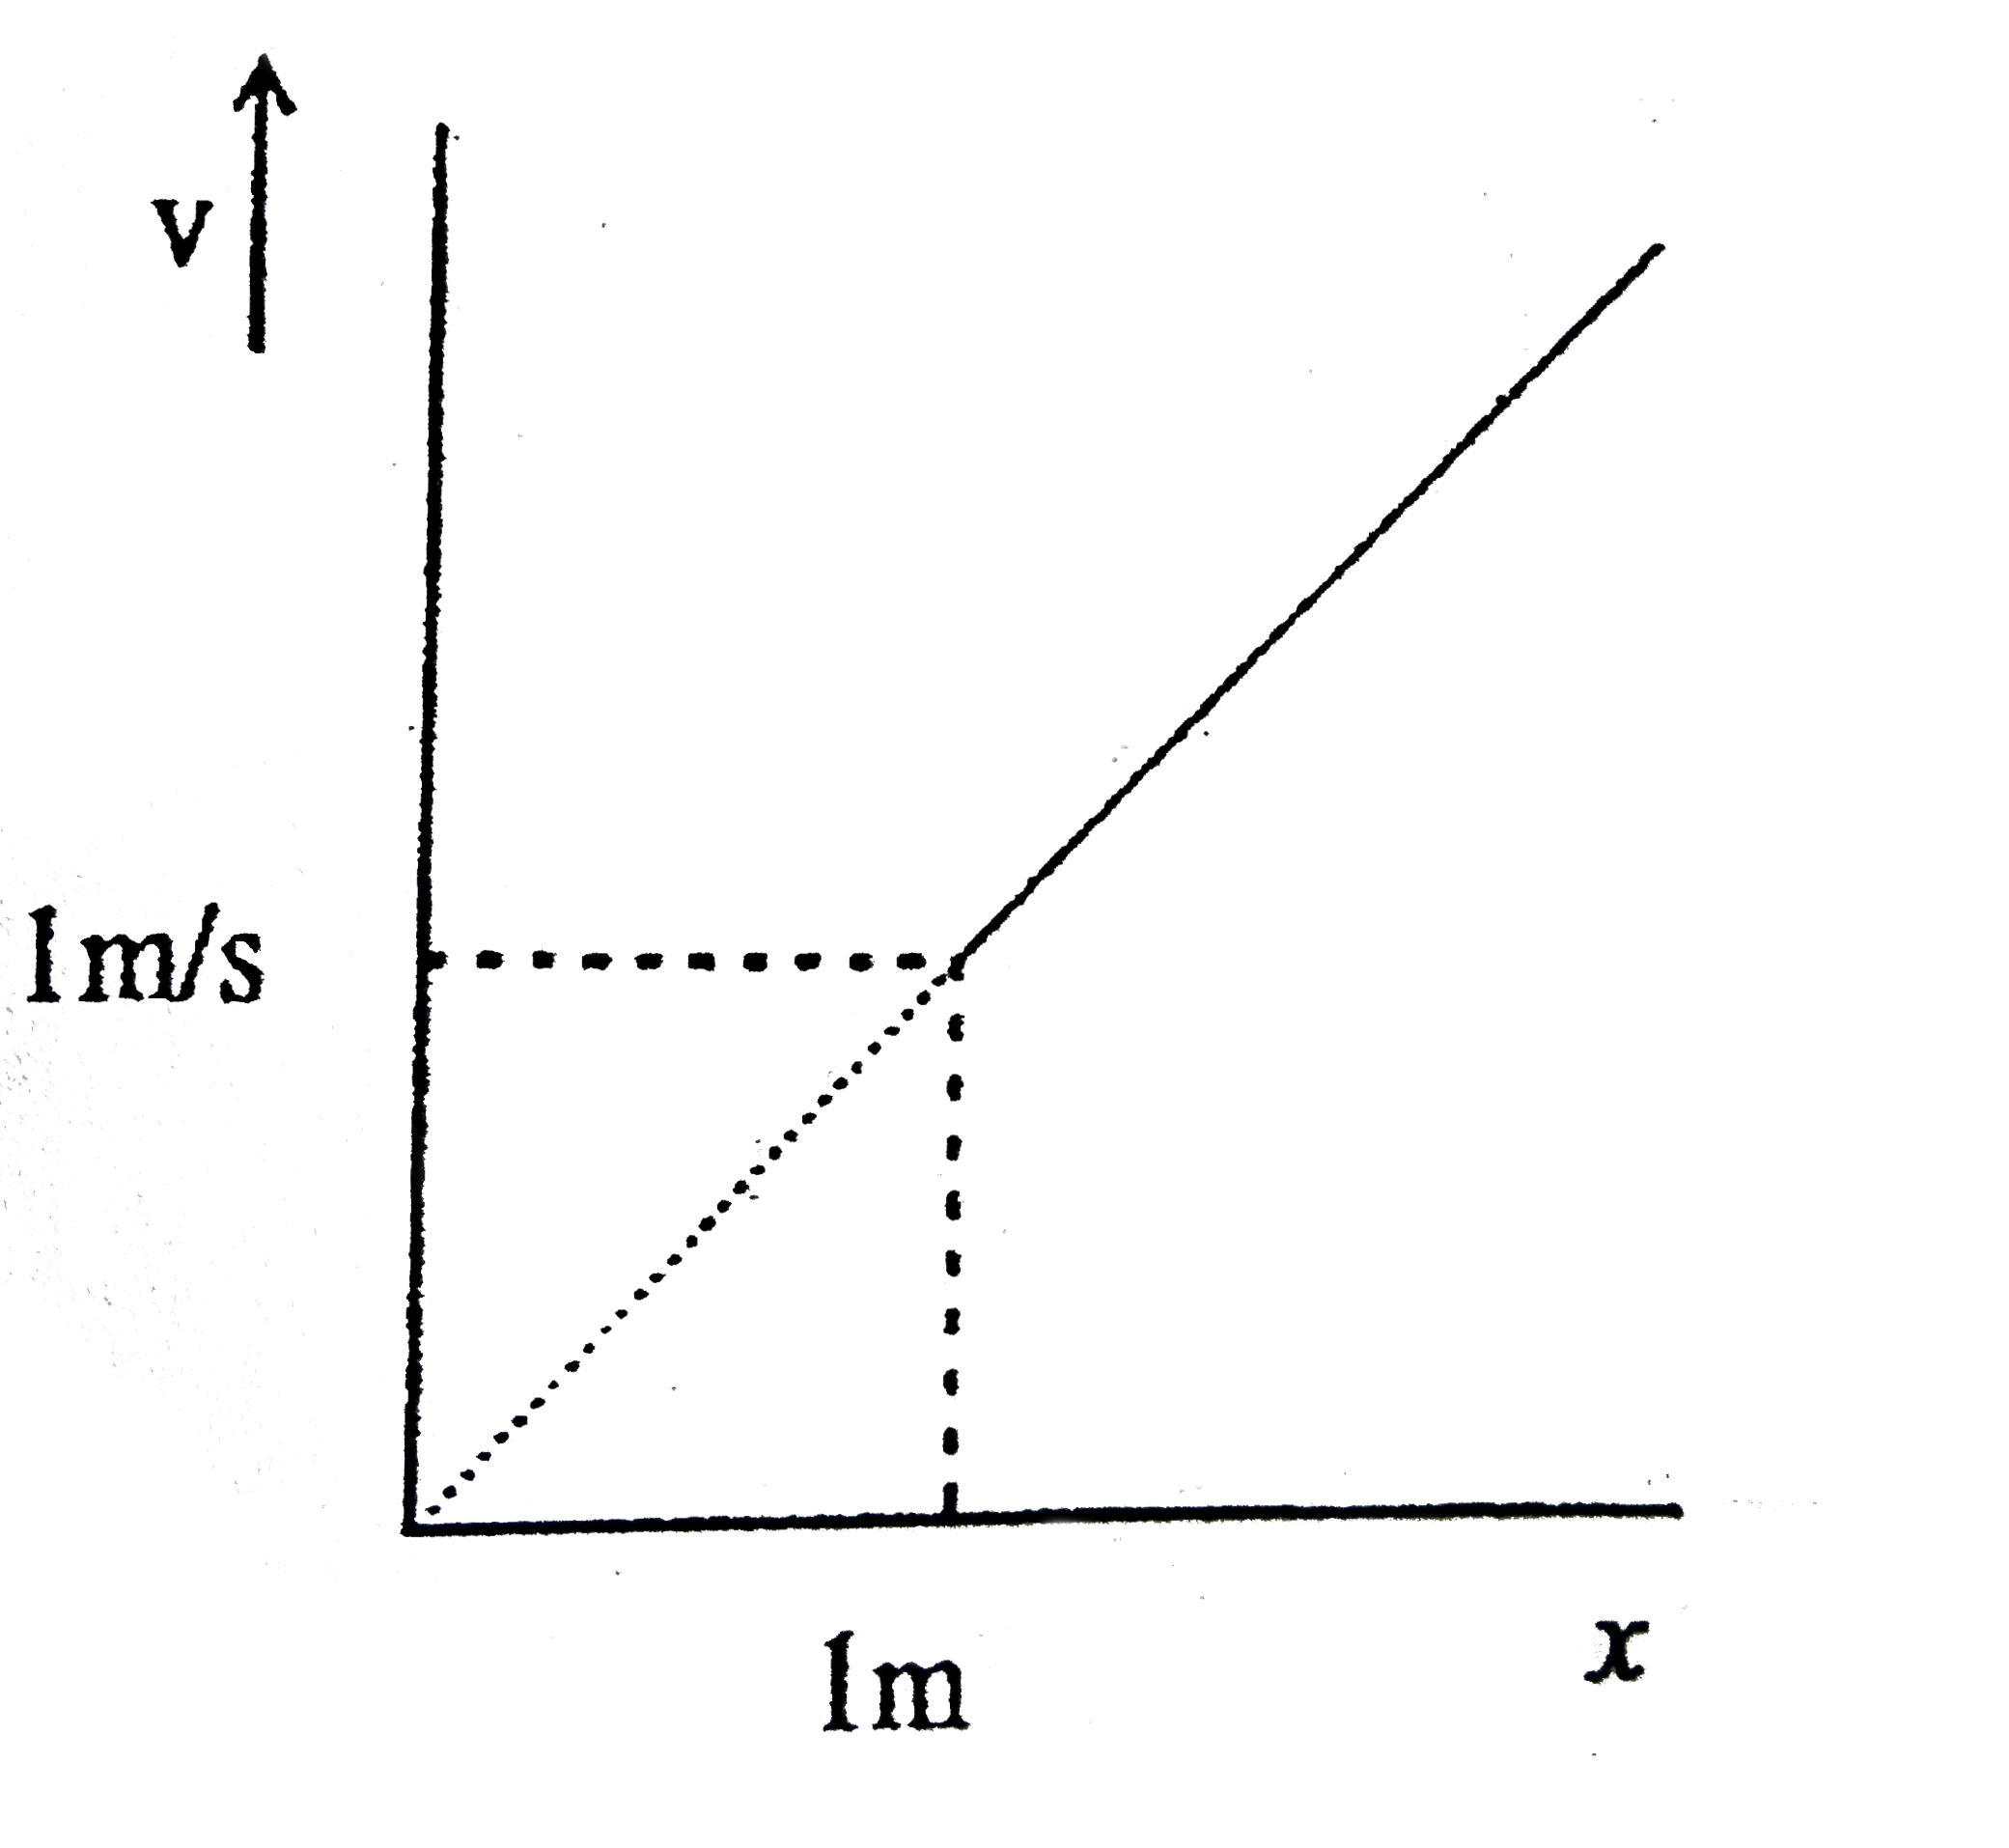
A particle is moving in a straight line according to graph given below : (a is acceleration, v is velocity, x is position, t is time) :
 A
A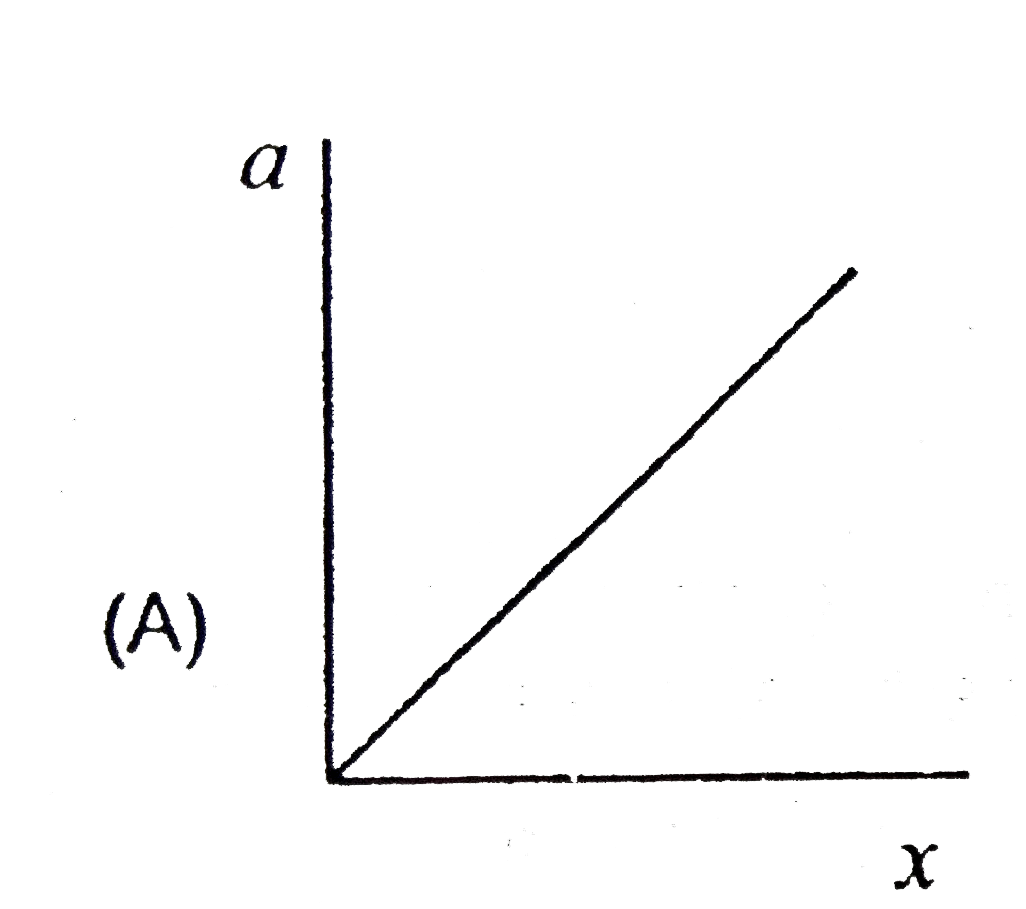 B
B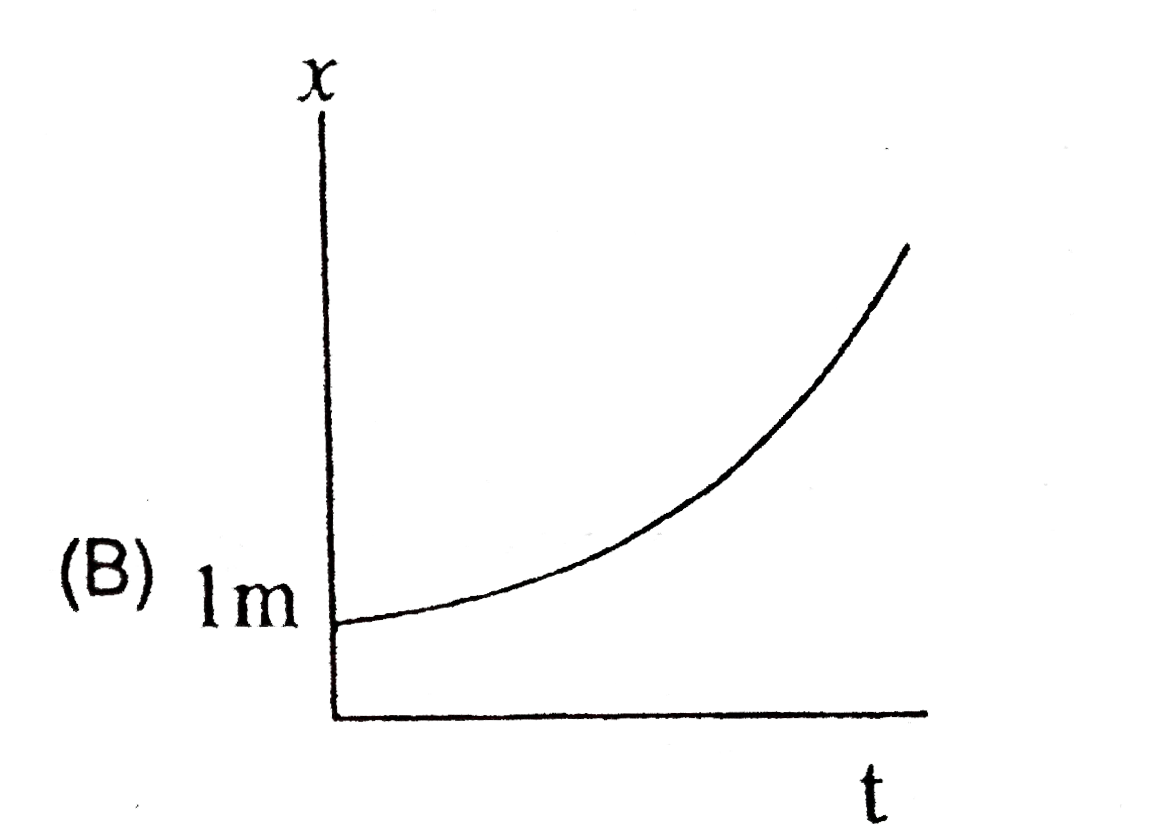 C
C D
D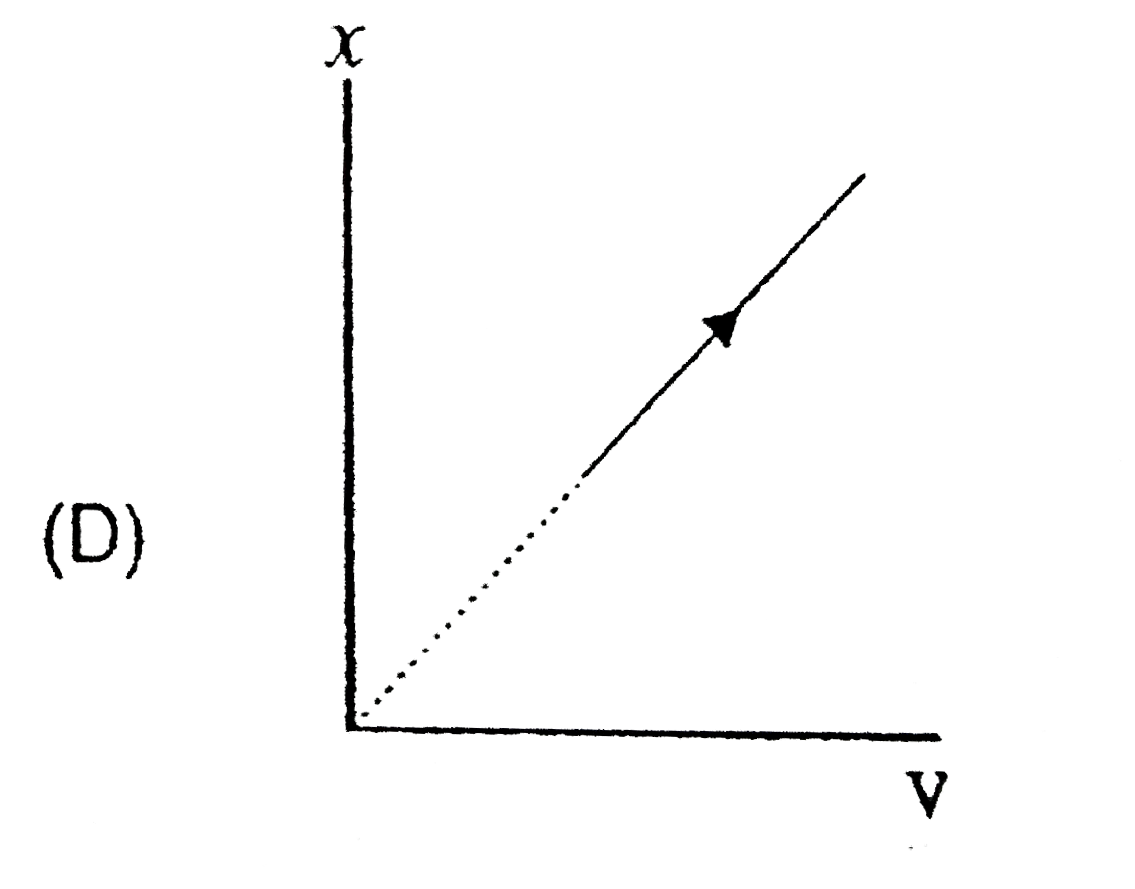
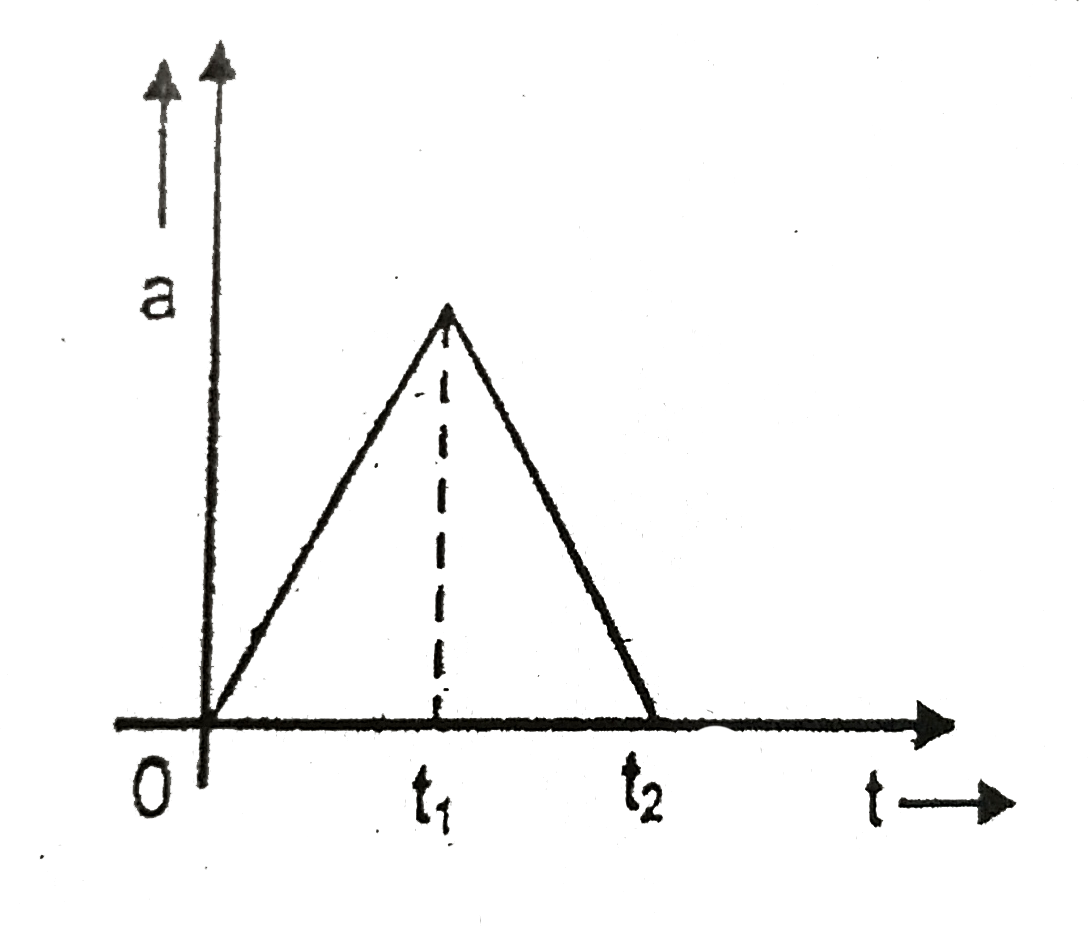
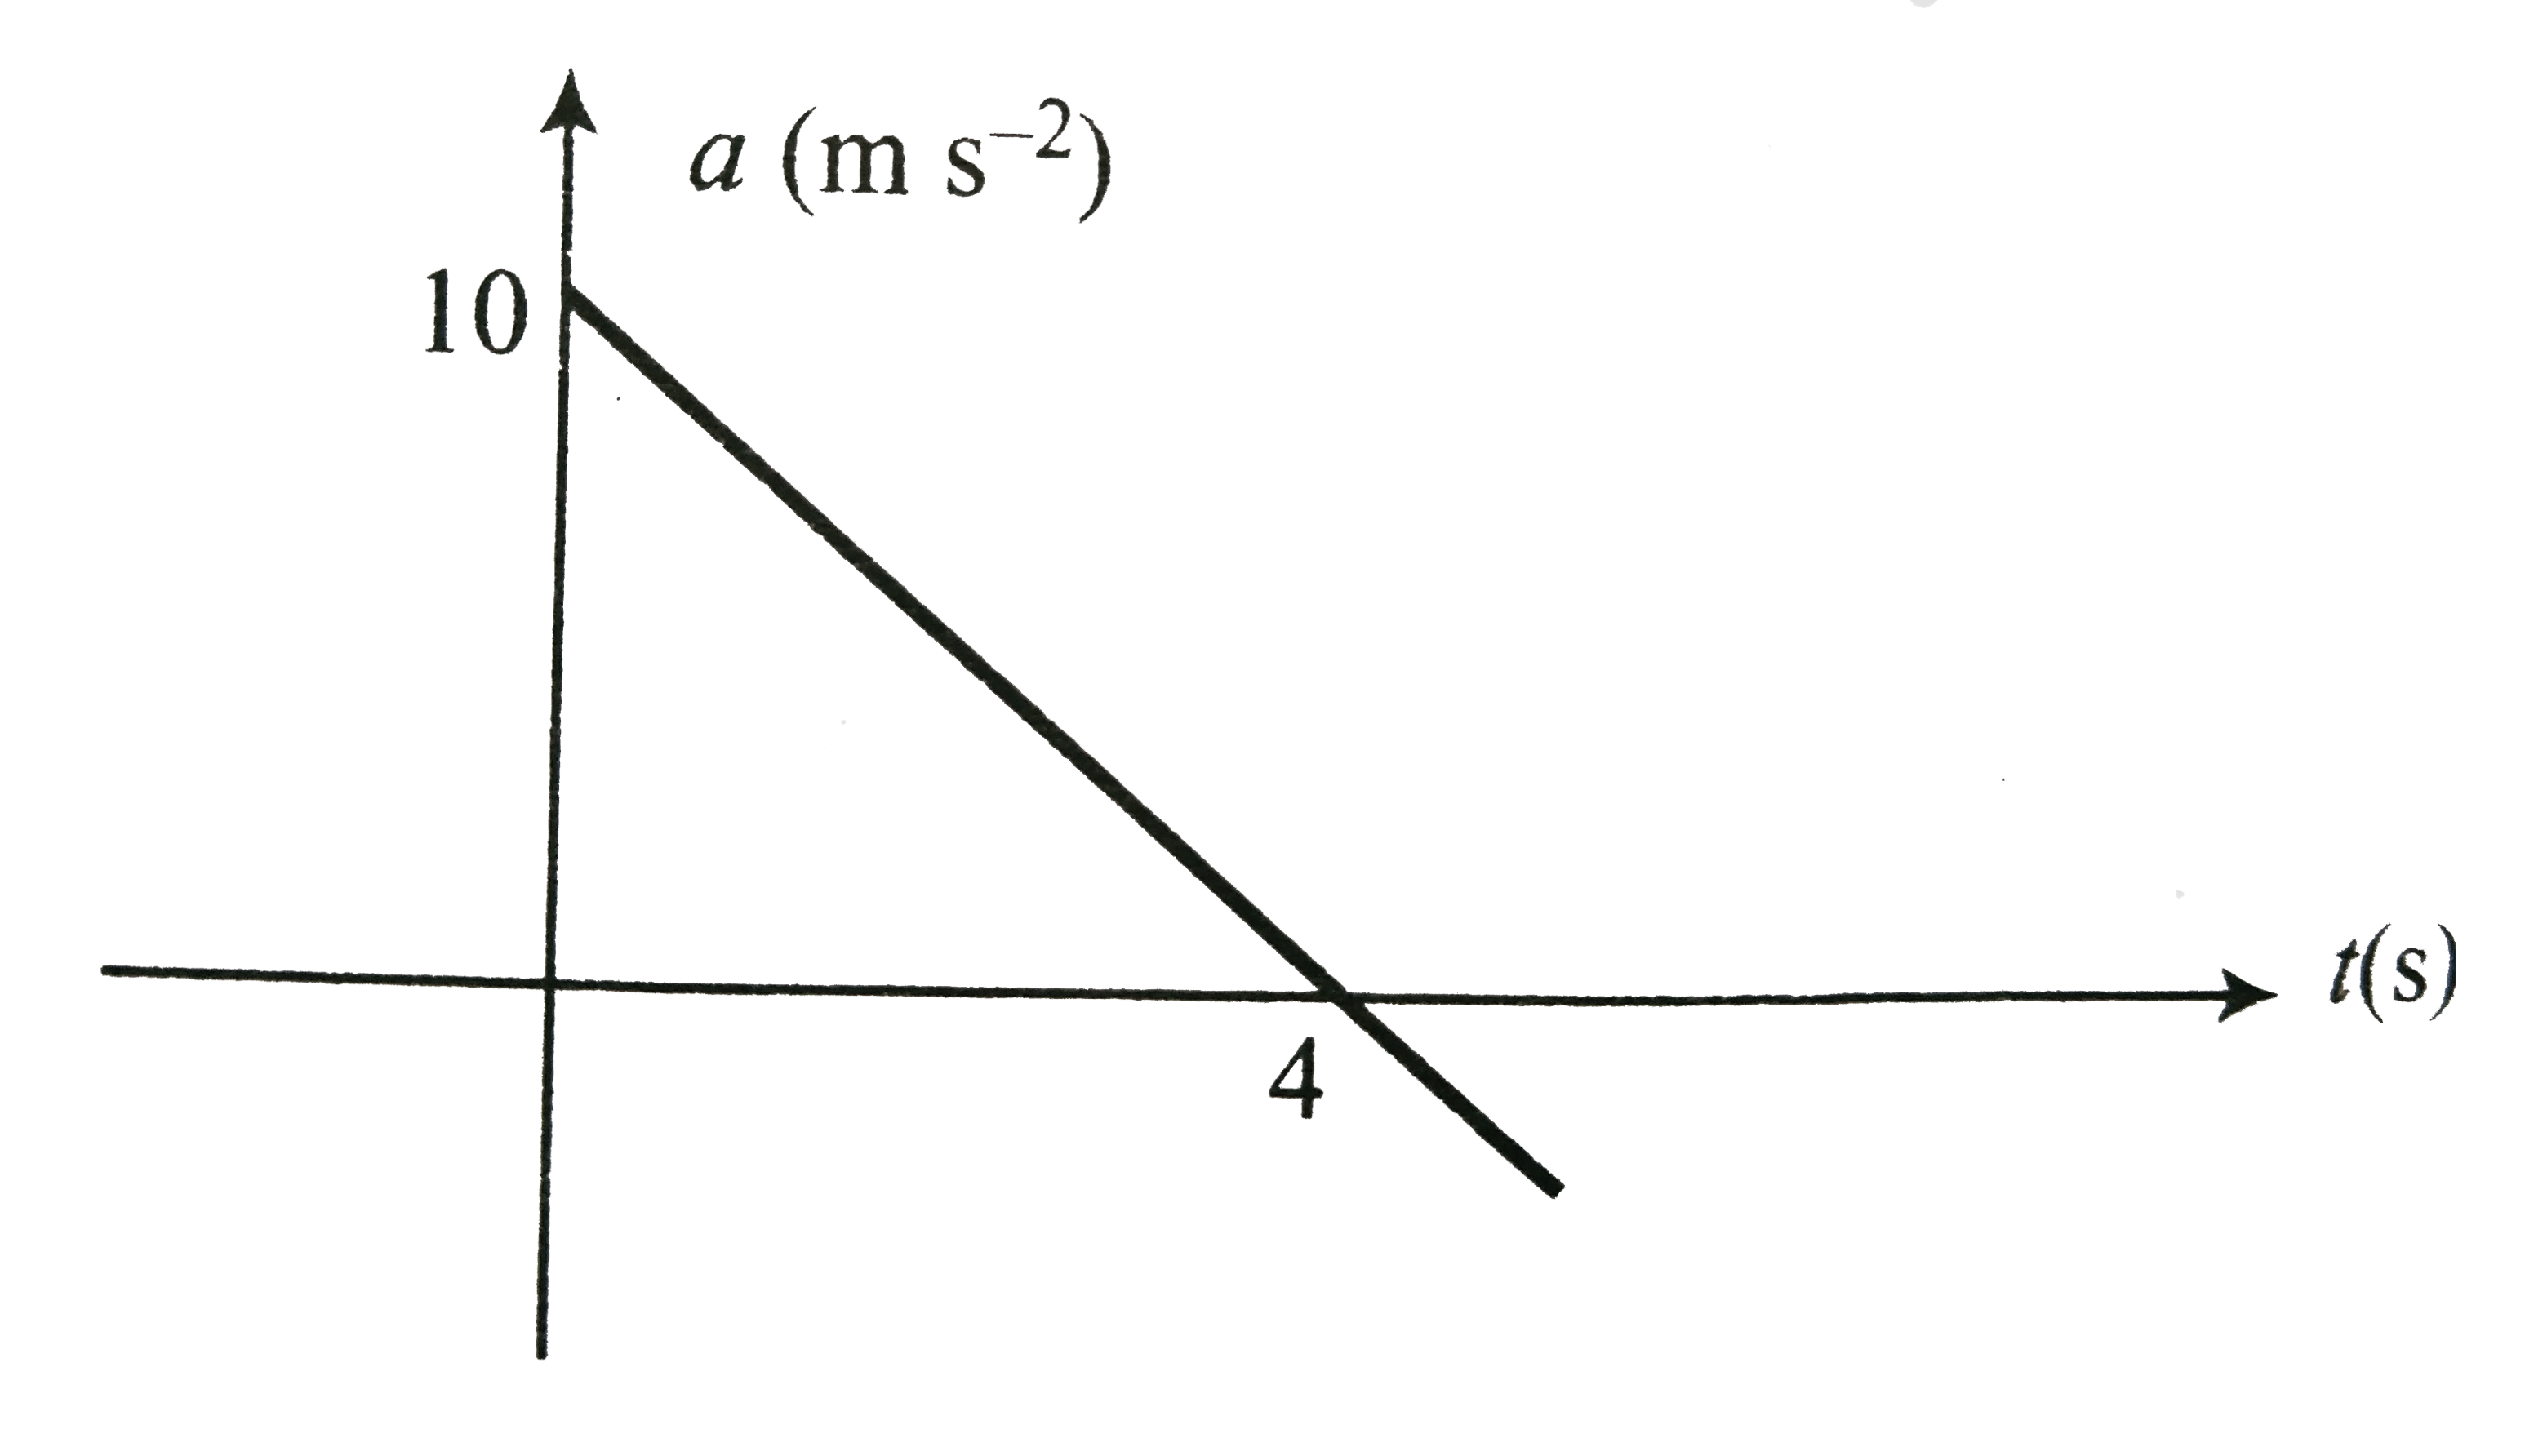
A particle starts to move along a straight line. The acceleration versus time graph of particle is as shown in figure. The correct velocity versus time graph is :
 A
A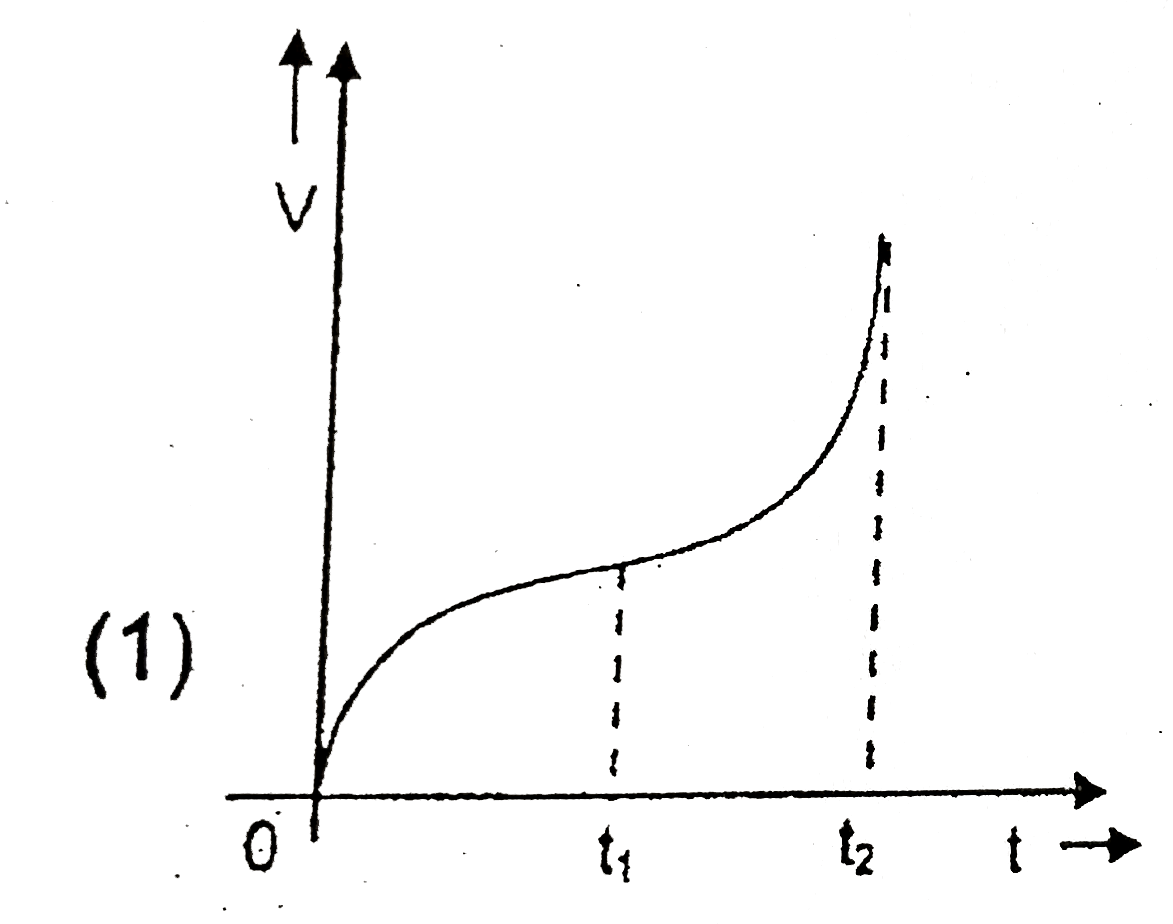 B
B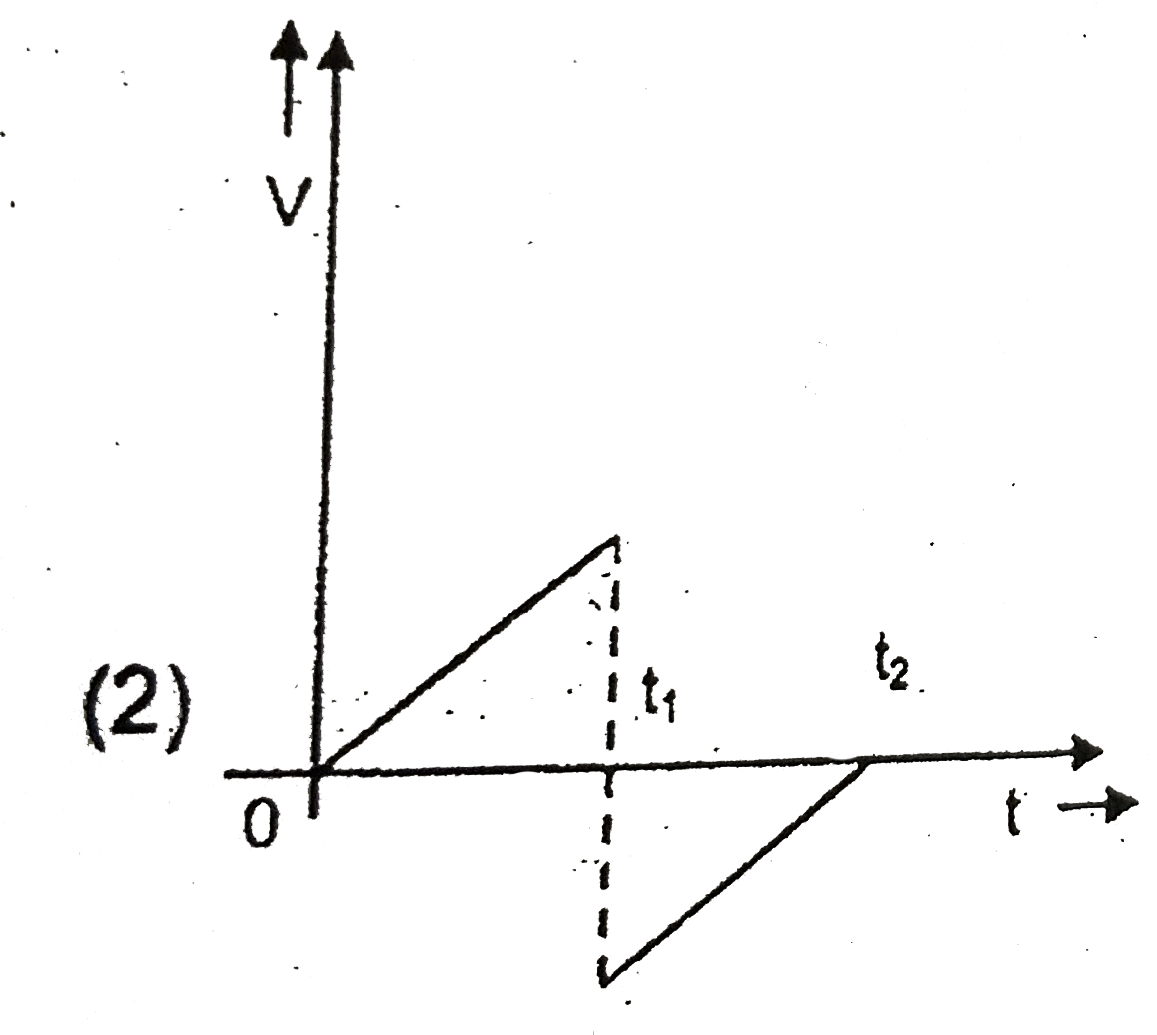 C
C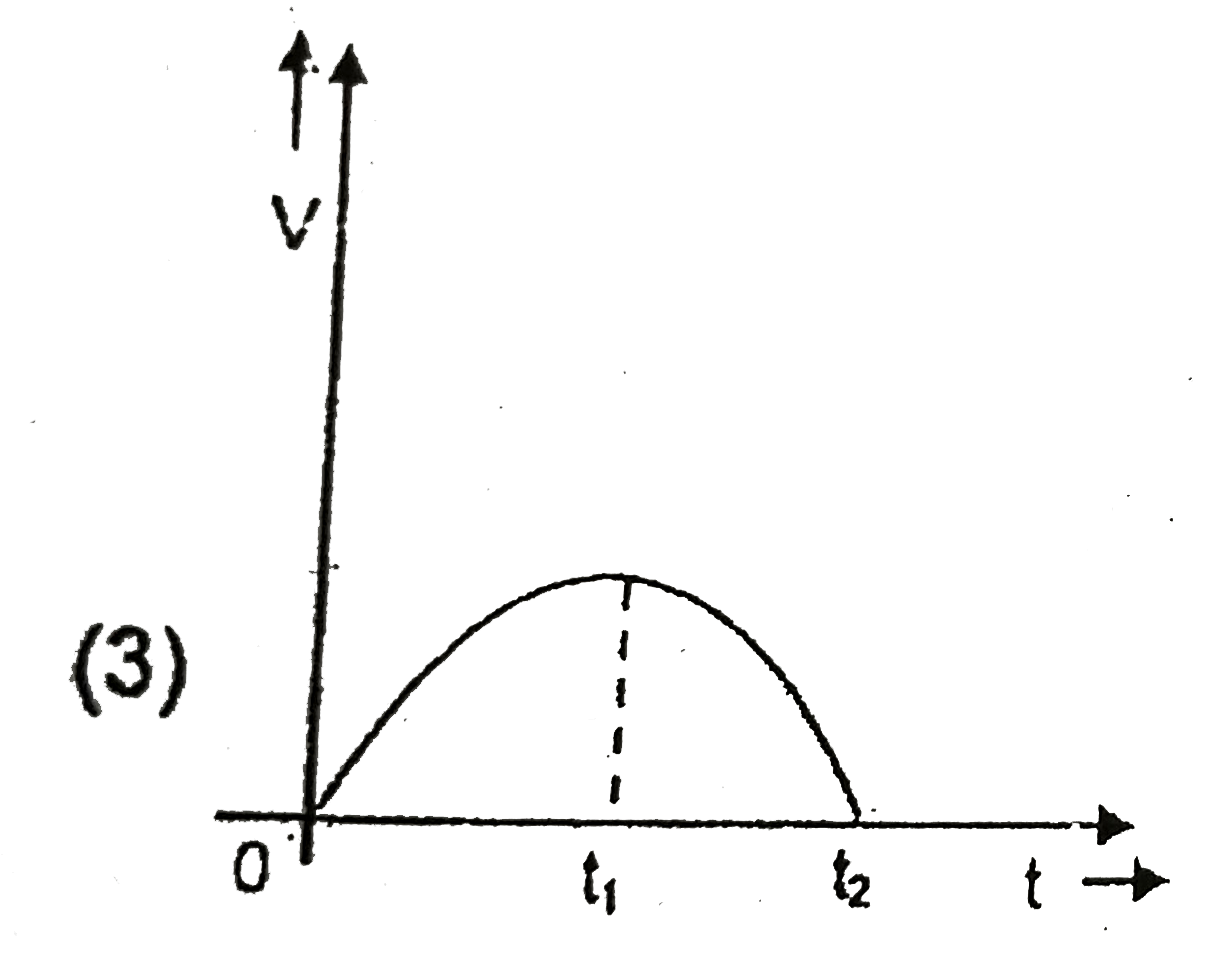 D
D
If average velocity of particle moving on a straight line is zero in a time interval, then
AAcceleration of particle may be zeroBVelocity of particle must be zero at an instantCVelocity of particle may be never zero in the intervalDAverage speed of particle may be zero in the interval
A particle move with a velocity v=αt3 along a straight line.The average velocity in time interval t=0 to t=T is
View SolutionThe acceleration-time graph of a particle moving along a straight line is as shown in figure. At what time the particle acquires its initial velocity ?

View SolutionThe force acting on a particle moving along a straight line varies with time as shown in diagram.
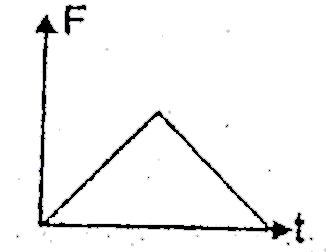
Which of the following graphs is best representative of its speed and time graphs. Initial velocity the particle is zero.
View SolutionThe acceleration-time graph of a particle moving along a straight line is as shown in figure. At what time the particle acquires its initial velcoity ?
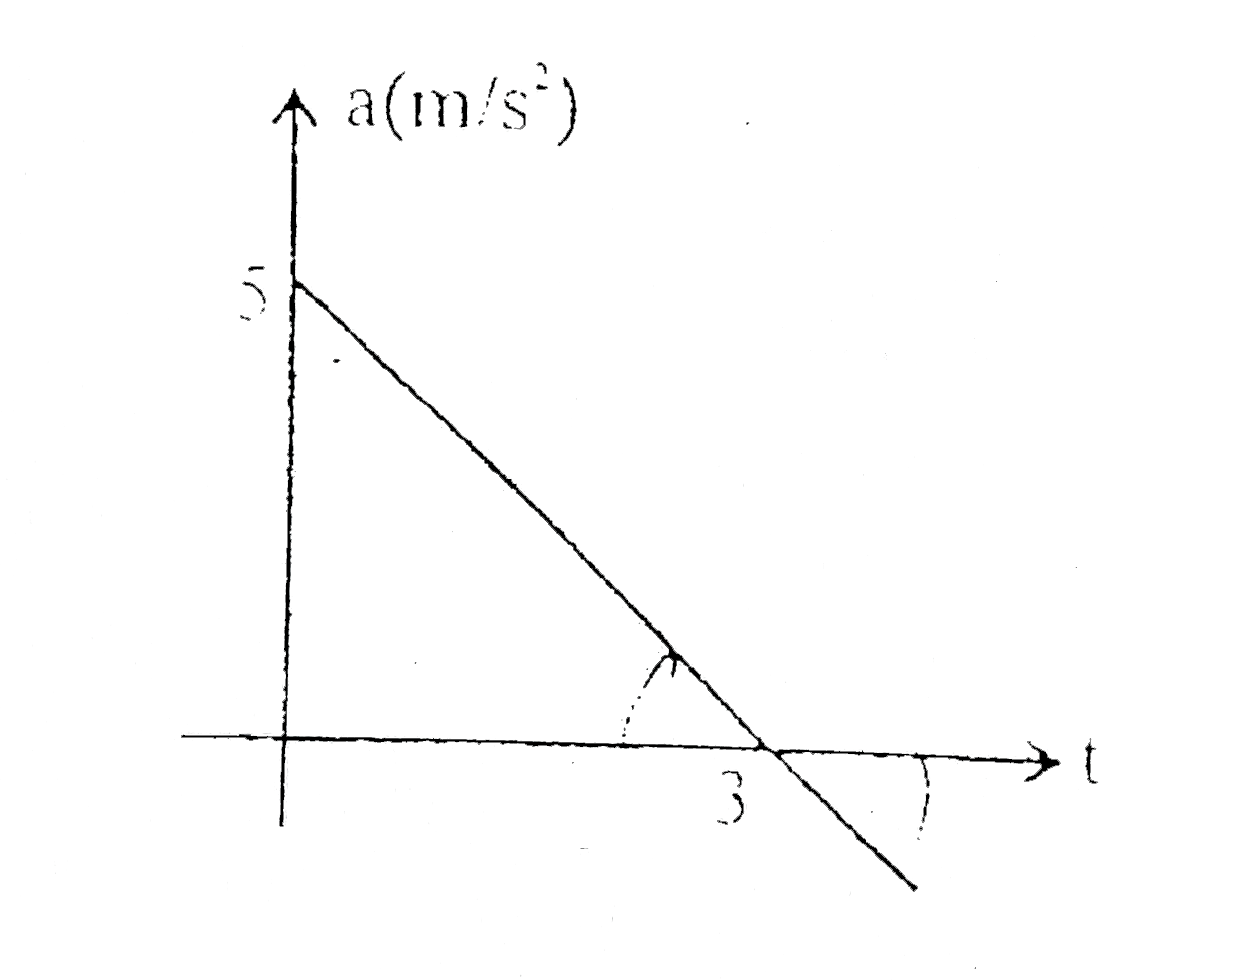
View SolutionThe acceleration-time graph of a particle moving along a straight line is as shown in. At what time the particle acquires its initial velocity?
 .
.
View Solution
