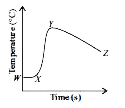
A solid is melted and allowed to cool and solidify again. The temperature is measured at equal intervals of time. The graph below shows the change of temperature with time.
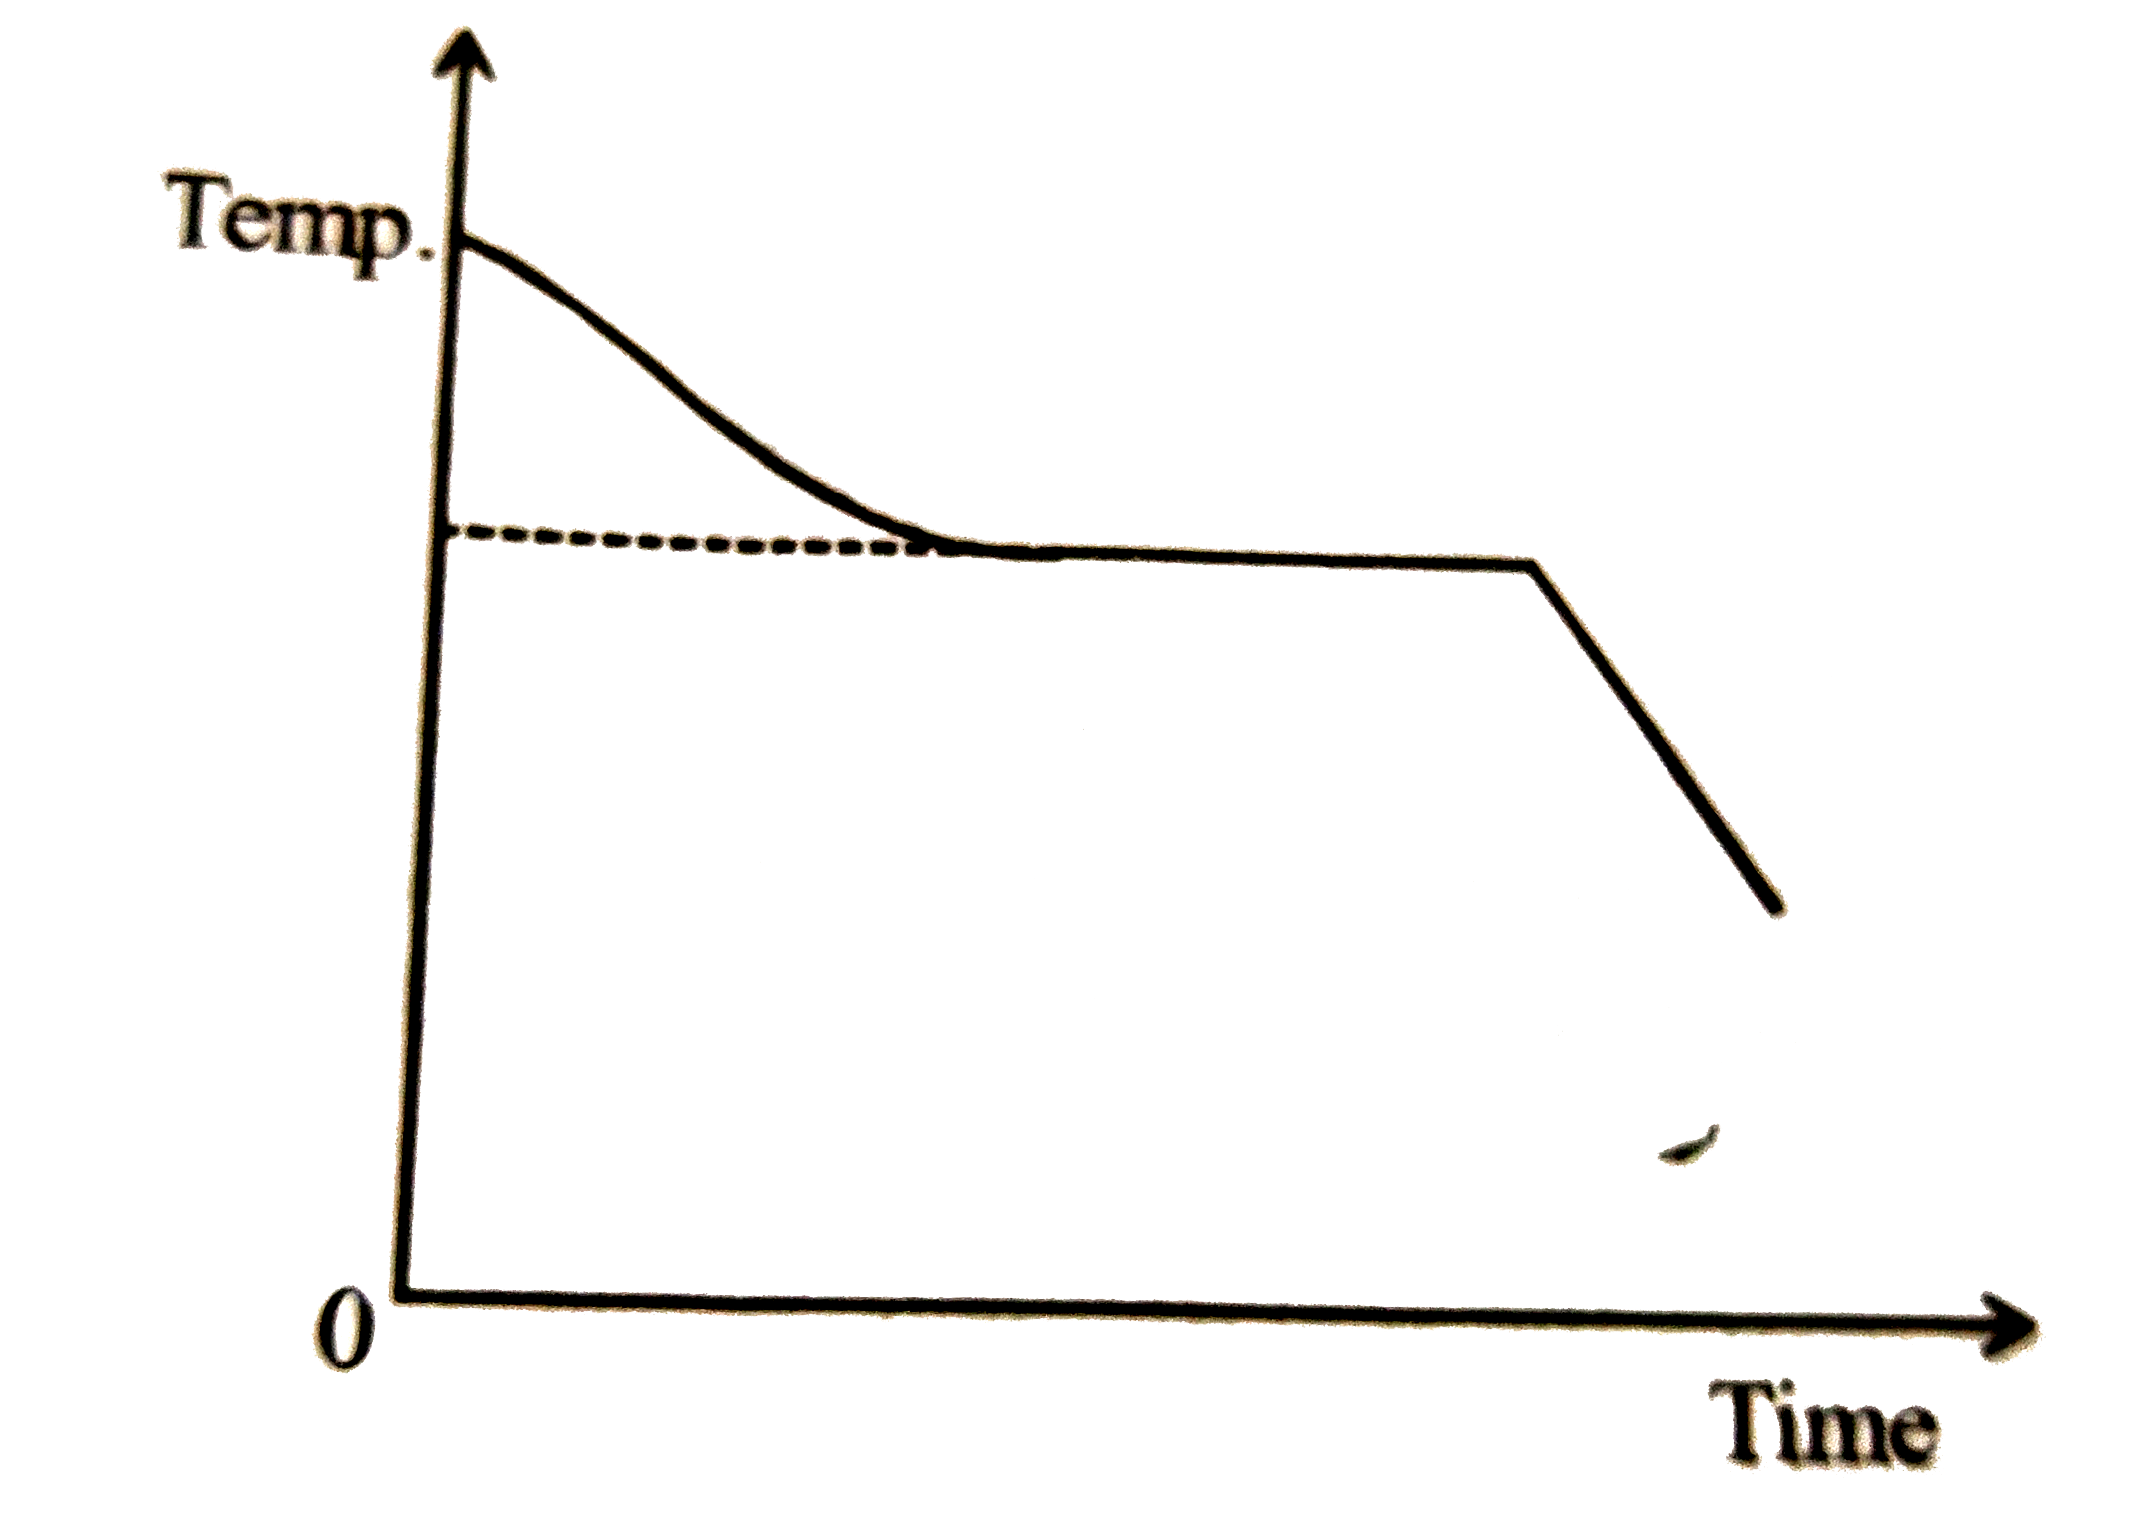
The part of the curve that is practically horizontal due to
latent heat given away by the liquid
specific heat given away by the liquid
thermal capacity changes with time keeping temperature constant
change in density during transformation
The correct Answer is:A
Latent heat -is the energy absorbed or released at constant temperature per unit mass for change of state
Topper's Solved these Questions
Similar Questions
Knowledge Check
For the following temperature-time graph, in which region the state of material changes
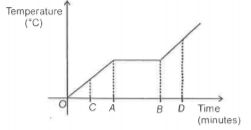 AOCBABCBODCA
If a piece of metal is heated to temperature θ and the allowed to cool in a room which is at temperature θ0, the graph between the temperature T of the metal and time t will be closet to
A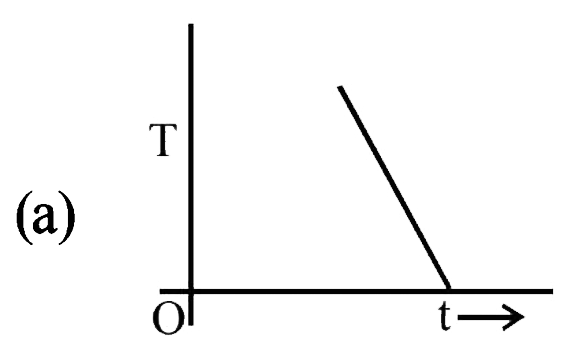 B
B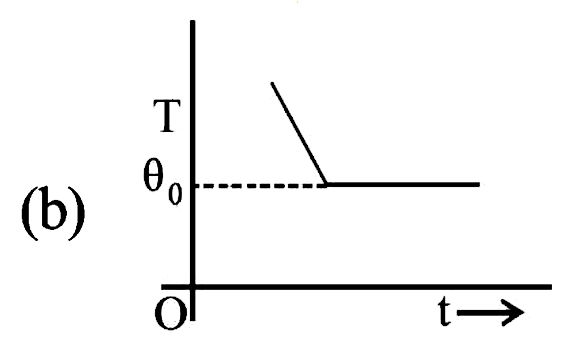 C
C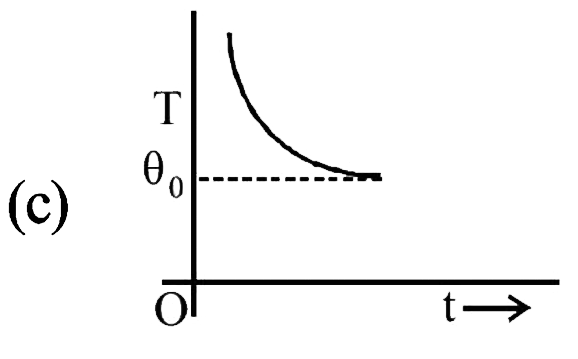 D
D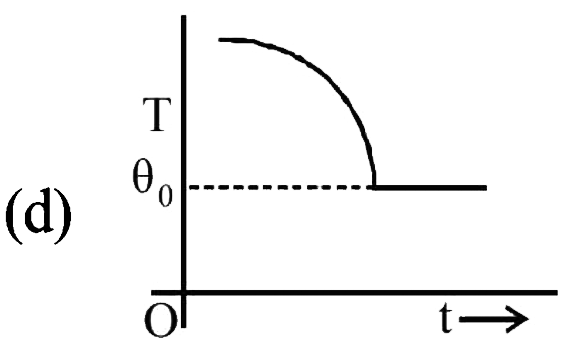
The temperature-time graph obtained when hot water is allowed to cool resembles the graph given in one of the following figures. The correct figure is:
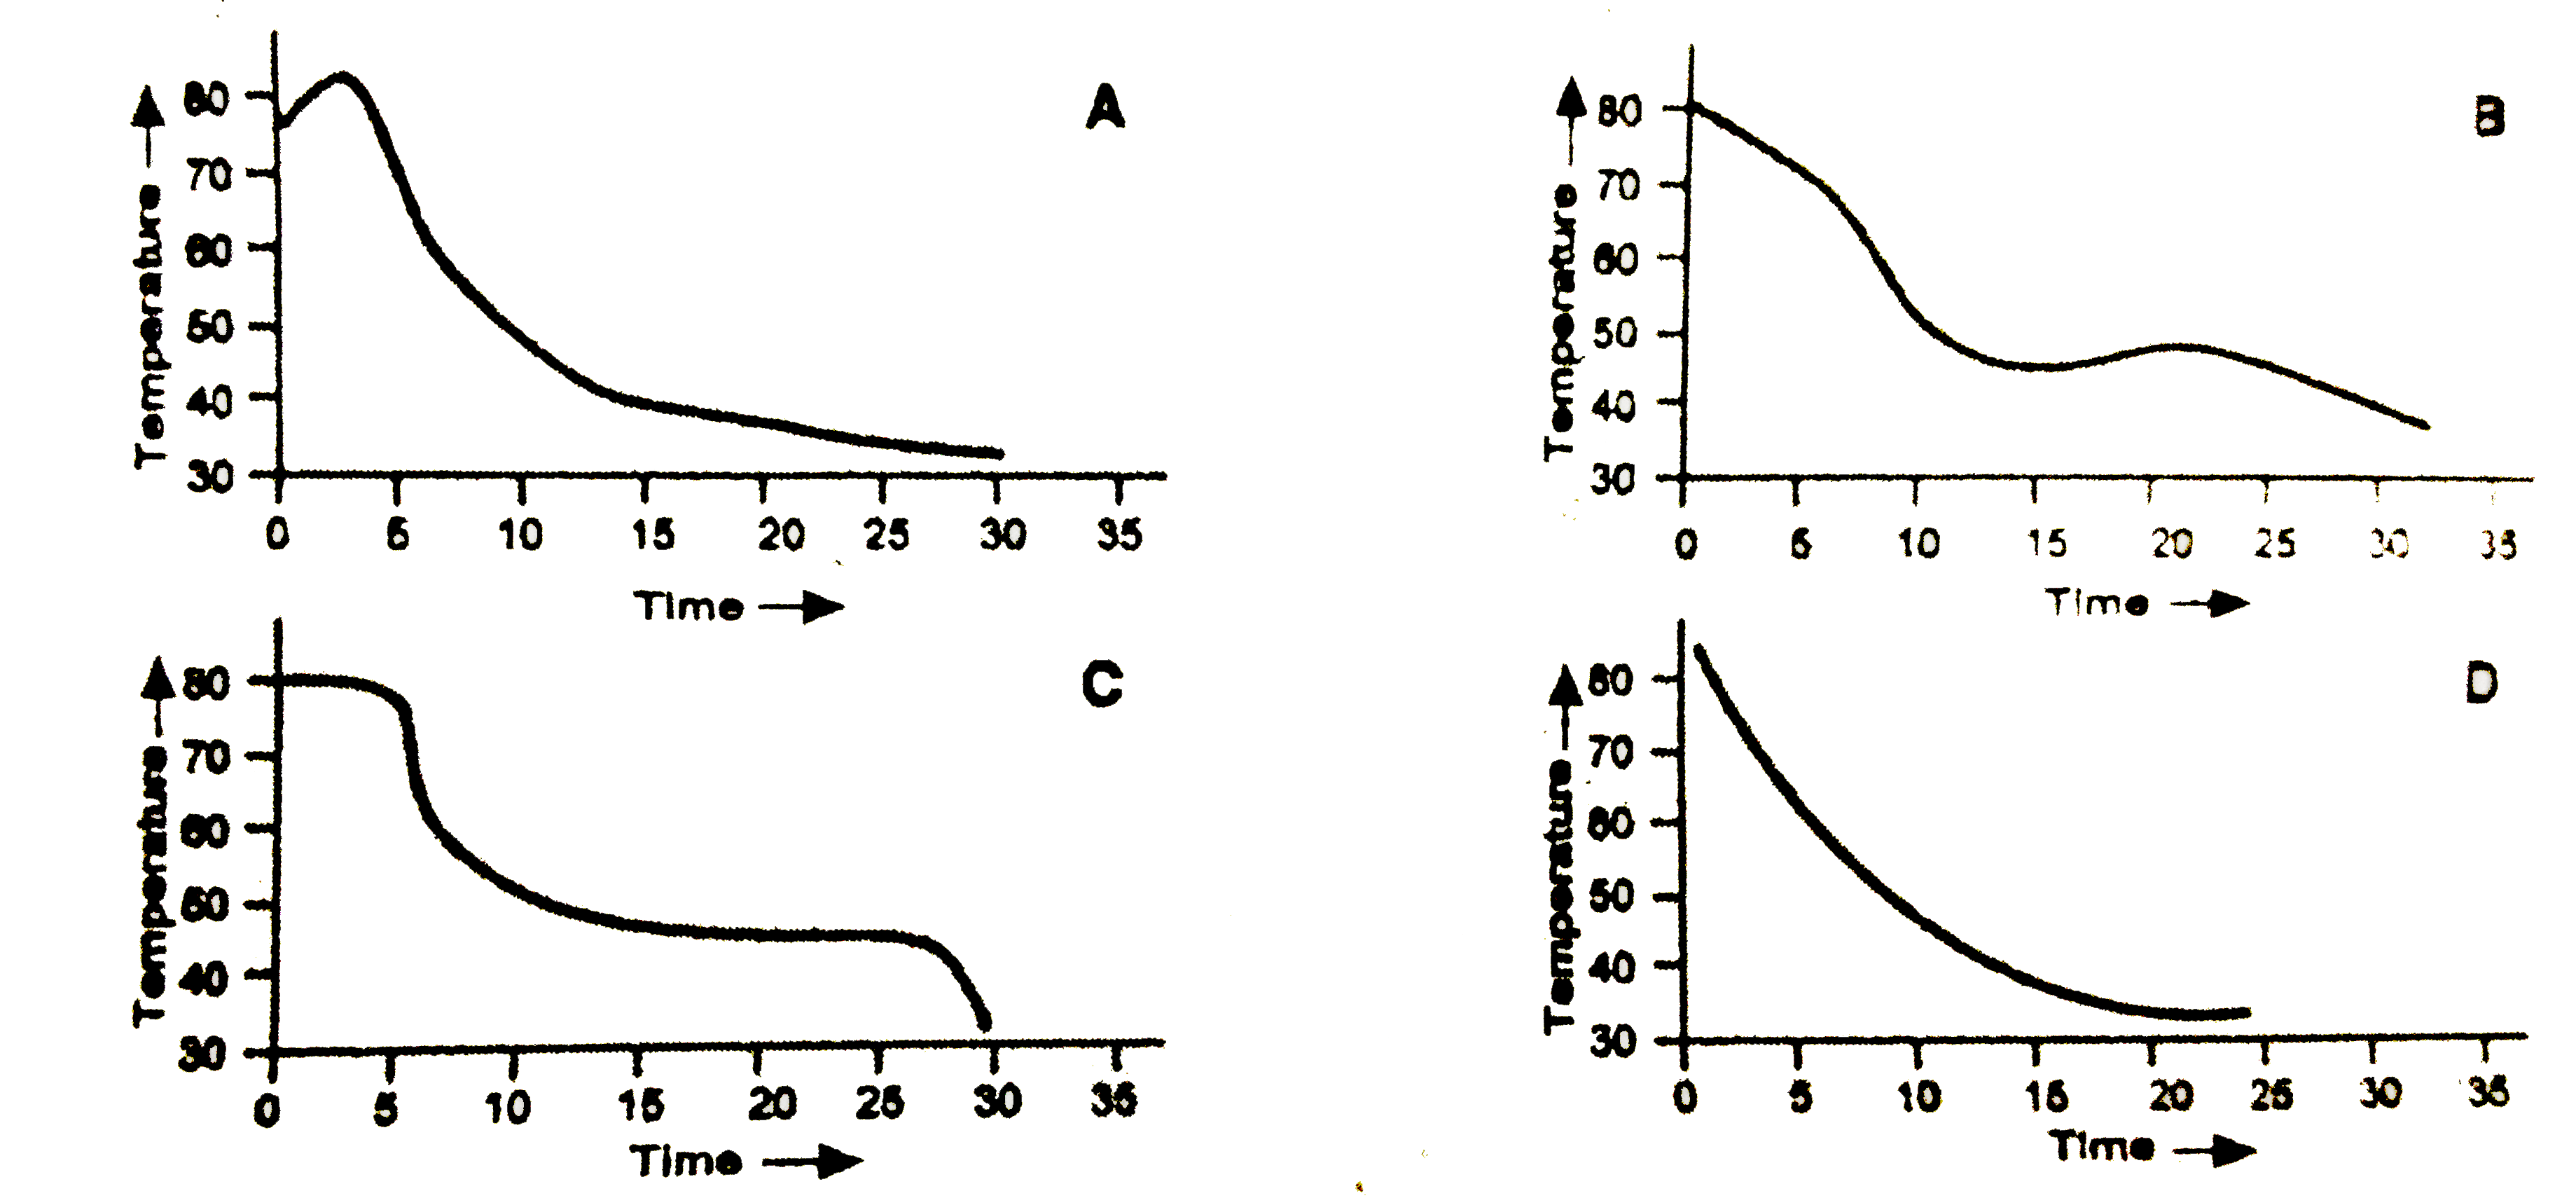 AABBCCDD
Excess of sodium hydroxide pellets are added to dilute hydrochloric acid and the temperature change of the mixture was measured over a period of time. The given graph shows the temperature change Time (s) with time.
What can be inferred from the graph?
View SolutionFor the following temperature-time graph, in which region the state of material changes

View SolutionIf a piece of metal is heated to temperature θ and the allowed to cool in a room which is at temperature θ0, the graph between the temperature T of the metal and time t will be closet to
View SolutionA piece of ice at 0∘C is heated at a constant rate and its temperature recorded at regular intervals till steam is formed at 100∘C. Draw a temperature-time graph to represent the change in phase. Label the different parts of your graph.
View SolutionIf the temperature of the body θ and time of cooling 't' and room temperature of the surrounding θ0. The cooling curve is
View Solution

