A spherical ball is dropped in a long column of viscous liquid. Which of the following graphs represent the variation of
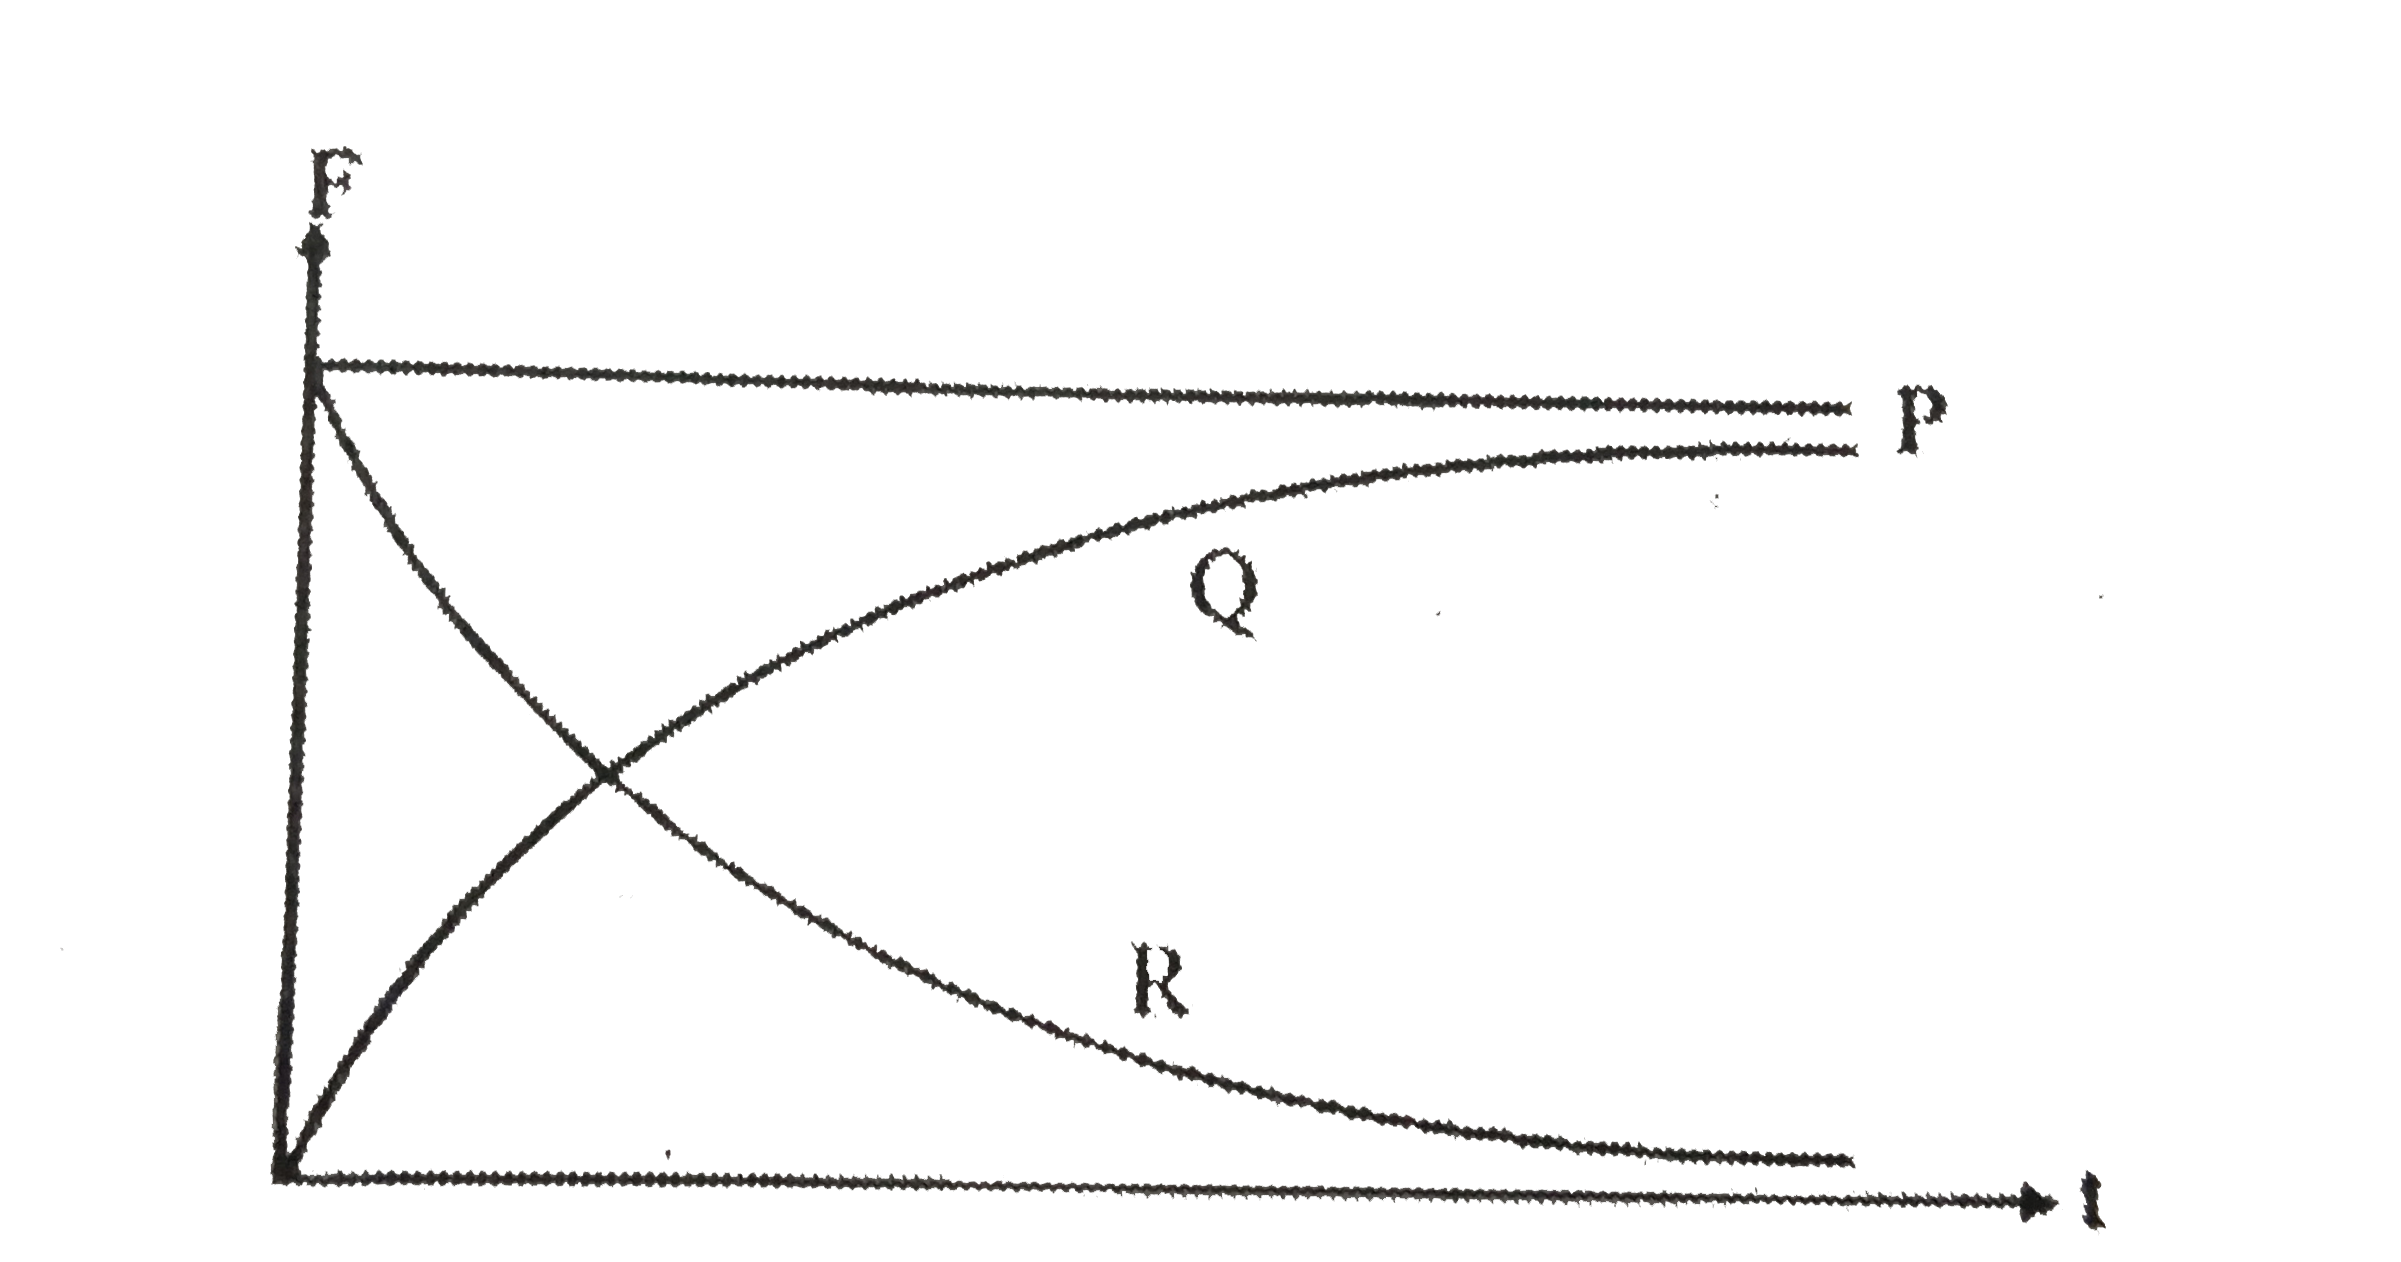
(l) gravitational force with time
(ii) viscous force with time
(iii) net force acting on the ball with time
Q,R,P
R,Q,P
P,Q,R
P,R,Q
The correct Answer is:C
Gravitational force remains constant on the falling spherical ball. It is represented by straight line P. The viscuos force increases as the velocity increases with time. Hence, it is represented by curve Q. Net force= Gravitational force- viscous force. As viscous force increases, net force decreases and finally become zero. Then the body falls with a constant terminal velocity. It is thus represented by curve R.
Topper's Solved these Questions
- FORCE AND LAWS OF MOTIONBOOK - MTG IIT JEE FOUNDATIONCHAPTER - FORCE AND LAWS OF MOTIONEXERCISE - EXERCISE (MATCH THE FOLLOWING )
2 Videos
- FORCE AND LAWS OF MOTIONBOOK - MTG IIT JEE FOUNDATIONCHAPTER - FORCE AND LAWS OF MOTIONEXERCISE - EXERCISE (ASSERTION AND REASON )
10 Videos
- FORCE AND LAWS OF MOTIONBOOK - MTG IIT JEE FOUNDATIONCHAPTER - FORCE AND LAWS OF MOTIONEXERCISE - EXERCISE MULTIPLE CHOICE QUESTIONS
1 Videos
- FOOTSTEPS TOWARDS NEETBOOK - MTG IIT JEE FOUNDATIONCHAPTER - FOOTSTEPS TOWARDS NEETEXERCISE - Multiple Choice Question
45 Videos
- GRAVITATION BOOK - MTG IIT JEE FOUNDATIONCHAPTER - GRAVITATION EXERCISE - Olympiad/HOTS Corner
20 Videos
Similar Questions
A spherical bal is dropped in a long column of a viscous liquid. The speed of the ball as a function of time may be best represented by the graph

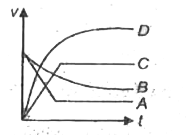
View SolutionA ball is thrown downward with some velocity into a.viscous liquid. Which of the following curves represents correct variation for velocity versus time?
View Solution
Knowledge Check
_E01_122_Q01.png)
A spherical ball is dropped in a long column of viscous liquid. Which of the following graphs represents the variation of-
(i). Gravitaional force with time
(ii). Viscous force with time
(iii). Net force acting on the ball with timeAQ, R, PBR, Q, PCP, Q, RDR, P, QA spherical ball is dropped in a long column of viscous liquid. Which of the following graphs represent the variation of

(l) gravitational force with time
(ii) viscous force with time
(iii) net force acting on the ball with timeAQ,R,PBR,Q,PCP,Q,RDP,R,QWhich of the following graphs represents the variation of activity (A) of a radioactive substance with time (t).
A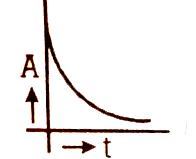 B
B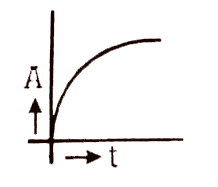 C
C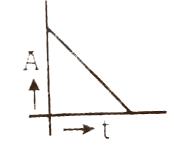 D
D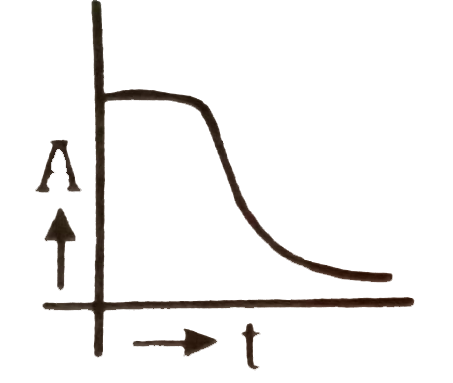
A small spherical solid balls is dropped in a viscous liquid. Its journey in the liquid is best described in the figure by
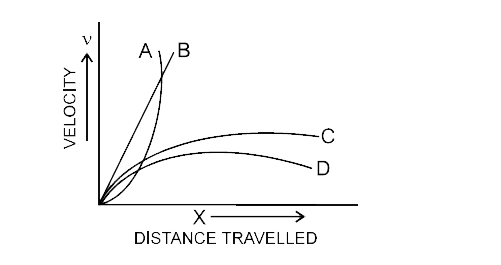
View SolutionA small spherical solid ball is dropped from a great height in a viscous liquid . Its journey in the liquid is best described in the diagram given below by the
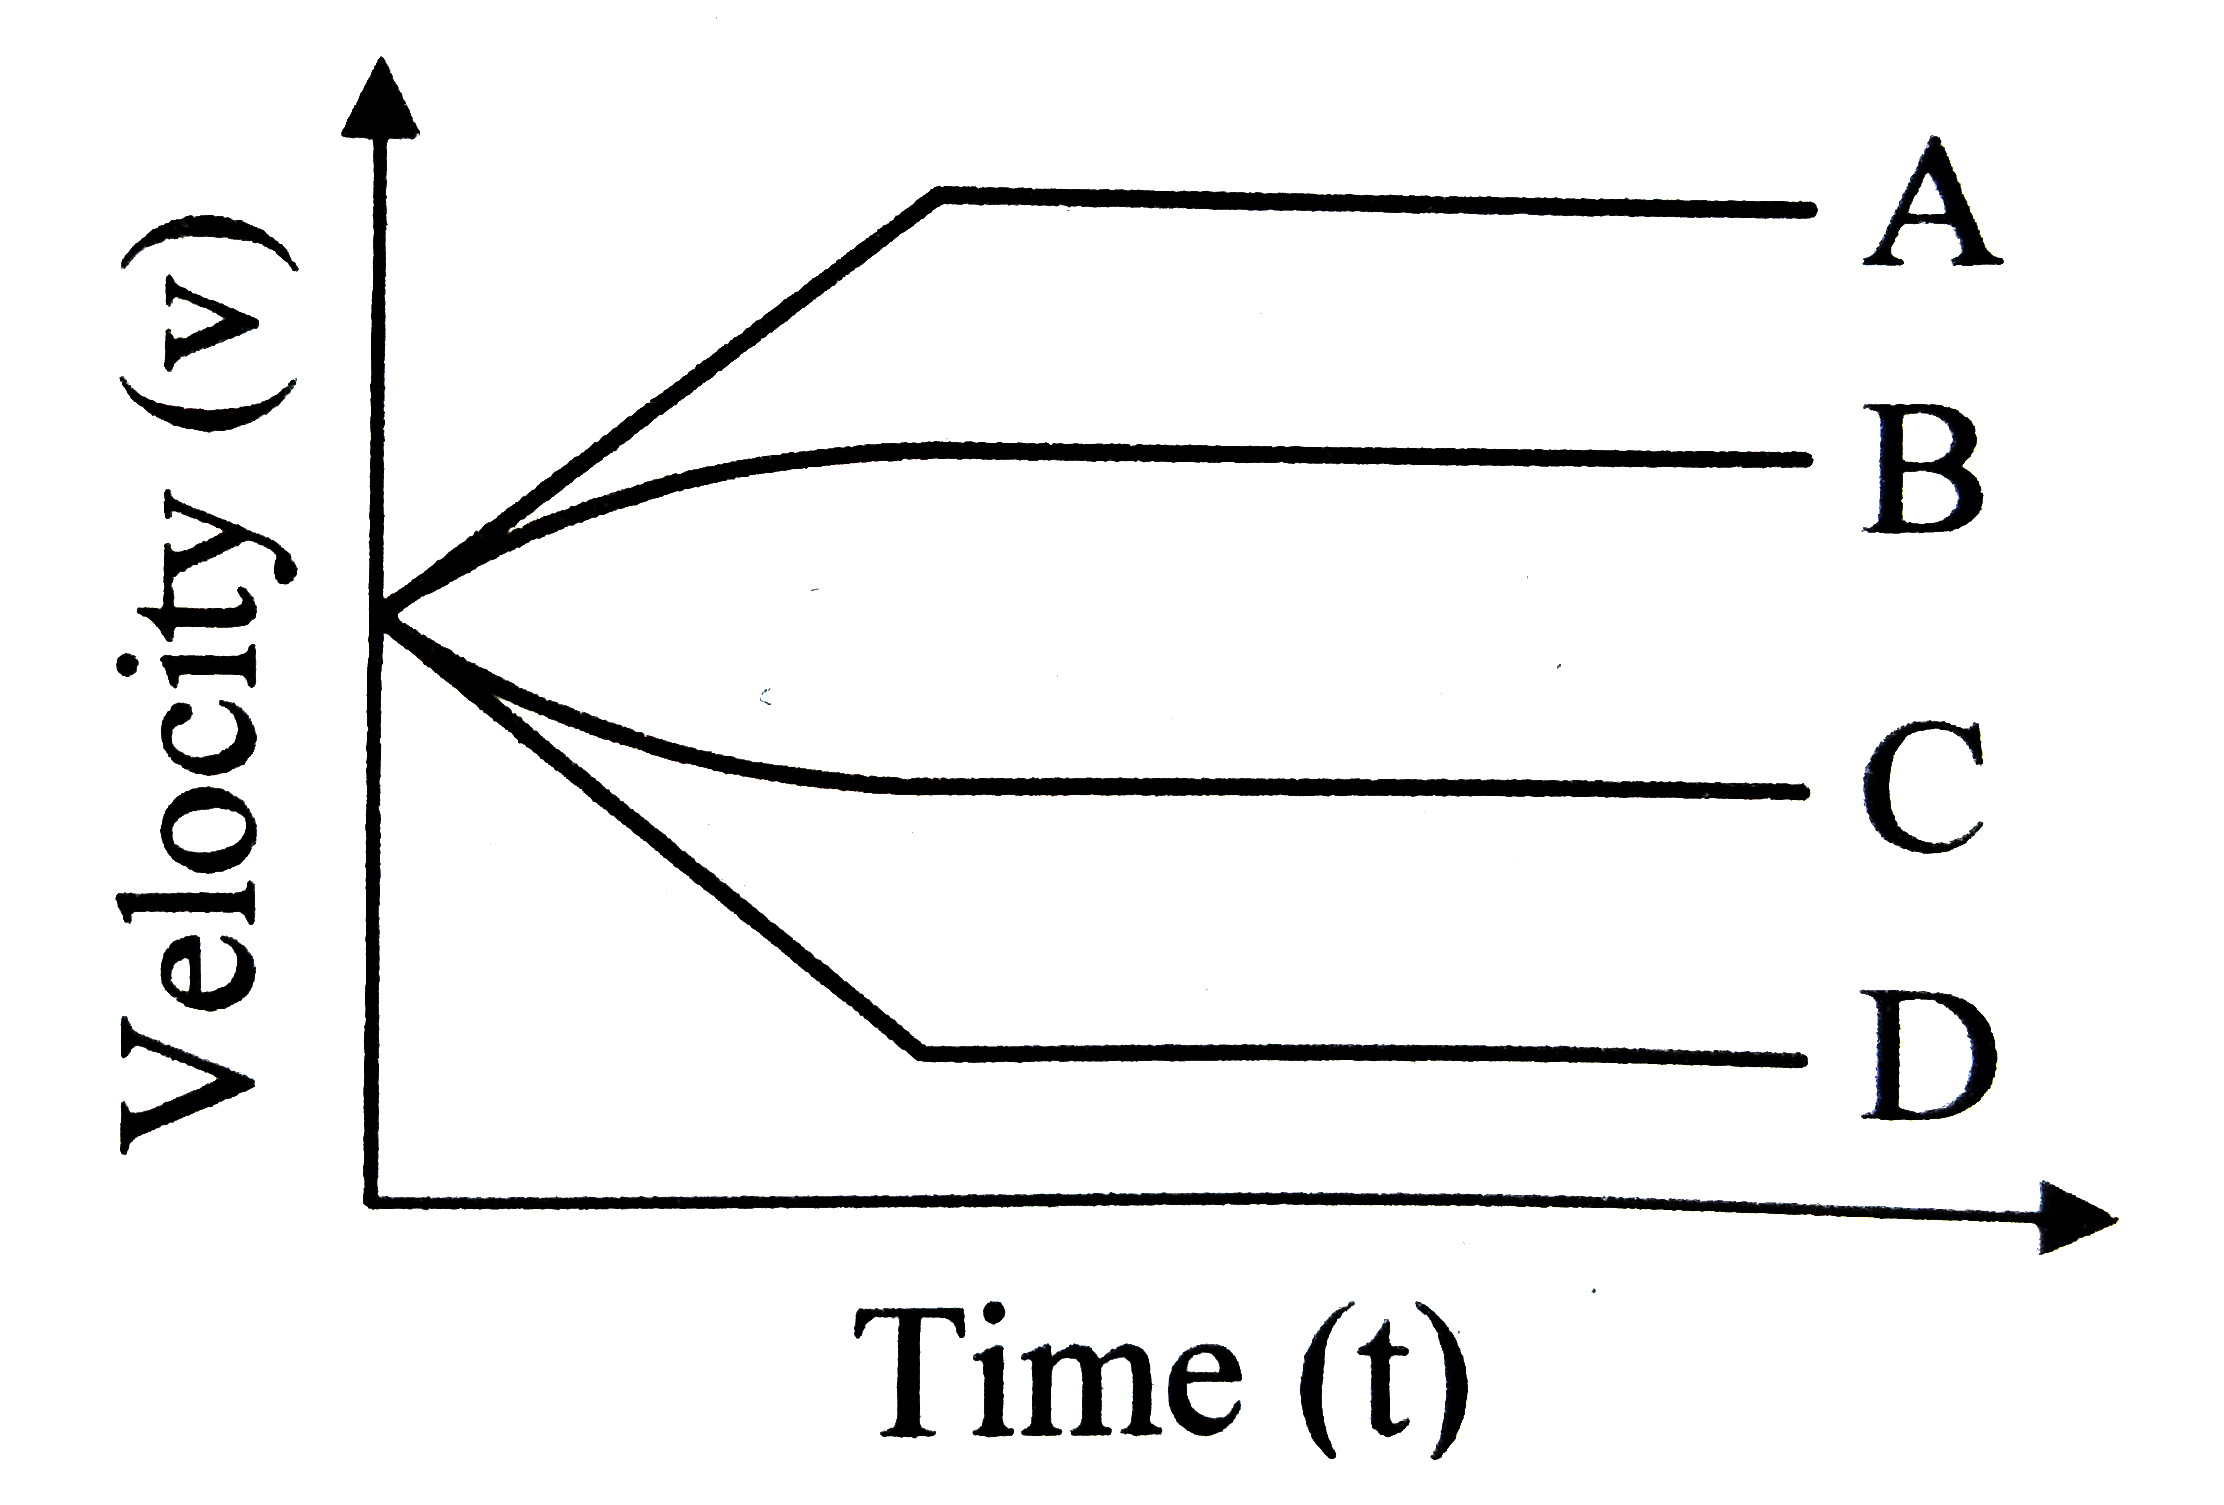
View SolutionThe graph shown the variation with times t of the velocity v of an object . Which one of the following graphs best represents the variation of acceleration a of the object with time t?

View SolutionWhich of the following is the graph between the time and the velocity of a body moving in a viscous fluid?
View SolutionA ball thrown vertically upward with initial velocity u. Which of the following graphs represent the velocity of ball correctly as function of time?
(Take upward direction as positive)
View Solution
