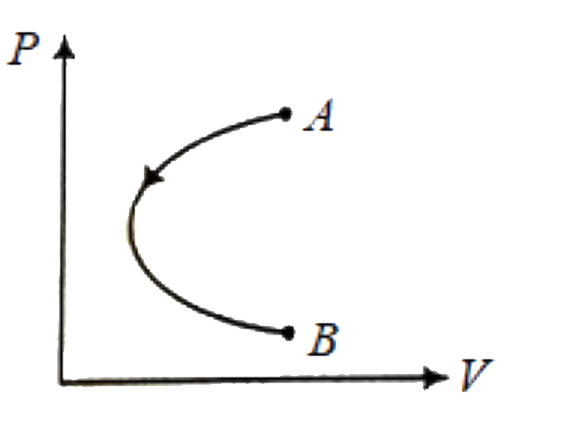
An ideal gas is taken from the state A (pressure p, volume V) to the state B (pressure p2, volume 2V) along a straight line path in the p-V diagram. Select the correct statement(s) from the following.
(a) The work done by the gas in the process A to B is negative
(b) In the T-V diagram, the path AB becomes a part of parabola
(c) In the p-T diagram, the path AB becomes a part of a hyperbola
(d) In going from A to B, the temperature T of the gas first increases to a maximum value and then decreases.
The correct Answer is:B, D
To solve the problem, we need to analyze the transition of an ideal gas from state A to state B in a p-V diagram, where state A has pressure p and volume V, and state B has pressure p2 and volume 2V. We will examine the work done, the relationship between pressure and volume, and the behavior of temperature during this process.
1. Identify the Initial and Final States:
- Initial state (A): PA=p, VA=V
- Final state (B): PB=p2, VB=2V
2. Calculate the Work Done:
- The work done by the gas during an expansion from state A to state B along a straight line in the p-V diagram can be calculated using the formula for work done in a p-V process:
W=∫VBVAPdV
- Since the path is a straight line, we can express pressure P as a linear function of volume V. The equation of the line connecting points A and B can be derived from the two points:
P=mV+c
- The slope m can be calculated as:
m=PB−PAVB−VA=p2−p2V−V=−p2V=−p2V
- The y-intercept c is equal to the pressure at point A, which is p.
- Thus, the equation of the line is:
P=−p2VV+p
3. Integrate to Find Work Done:
- Substitute the equation of the line into the work done formula:
W=∫2VV(−p2VV+p)dV
- Simplifying gives:
W=∫2VV(−p2+p)dV=∫2VV(p2)dV
- Evaluating the integral:
W=p2(V)2VV=p2(2V−V)=pV2
4. Analyze Temperature Change:
- The ideal gas law states that PV=nRT. We can express temperature in terms of pressure and volume:
T=PVnR
- At state A:
TA=pVnR
- At state B:
TB=(p2)(2V)nR=pVnR
- As the gas moves from A to B, the pressure decreases while the volume increases. The relationship between pressure and volume will create a parabolic path in the T-V diagram, indicating that temperature will first increase to a maximum and then decrease.
5. Conclusion:
- The correct statements based on the analysis are:
- The work done by the gas is positive, as the volume increases.
- The relationship between temperature and volume follows a parabolic path, indicating that temperature first increases to a maximum value and then decreases.
Correct Options:
- Option B: The relationship between T and V is a parabola.
- Option D: In going from A to B, the temperature T of the gas first increases to a maximum value and then decreases.
- Initial state (A): PA=p, VA=V
- Final state (B): PB=p2, VB=2V
- The work done by the gas during an expansion from state A to state B along a straight line in the p-V diagram can be calculated using the formula for work done in a p-V process:
W=∫VBVAPdV
- Since the path is a straight line, we can express pressure P as a linear function of volume V. The equation of the line connecting points A and B can be derived from the two points:
P=mV+c
- The slope m can be calculated as:
m=PB−PAVB−VA=p2−p2V−V=−p2V=−p2V
- The y-intercept c is equal to the pressure at point A, which is p.
- Thus, the equation of the line is:
P=−p2VV+p
- Substitute the equation of the line into the work done formula:
W=∫2VV(−p2VV+p)dV
- Simplifying gives:
W=∫2VV(−p2+p)dV=∫2VV(p2)dV
- Evaluating the integral:
W=p2(V)2VV=p2(2V−V)=pV2
- The ideal gas law states that PV=nRT. We can express temperature in terms of pressure and volume:
T=PVnR
- At state A:
TA=pVnR
- At state B:
TB=(p2)(2V)nR=pVnR
- As the gas moves from A to B, the pressure decreases while the volume increases. The relationship between pressure and volume will create a parabolic path in the T-V diagram, indicating that temperature will first increase to a maximum and then decrease.
- The correct statements based on the analysis are:
- The work done by the gas is positive, as the volume increases.
- The relationship between temperature and volume follows a parabolic path, indicating that temperature first increases to a maximum value and then decreases.
- Option B: The relationship between T and V is a parabola.
- Option D: In going from A to B, the temperature T of the gas first increases to a maximum value and then decreases.
Topper's Solved these Questions
- LAWS OF THERMODYNAMICSBOOK - DC PANDEY ENGLISHCHAPTER - LAWS OF THERMODYNAMICSEXERCISE - Level 2 Passage I
2 Videos
- LAWS OF THERMODYNAMICSBOOK - DC PANDEY ENGLISHCHAPTER - LAWS OF THERMODYNAMICSEXERCISE - Level 2 Passage II
3 Videos
- LAWS OF THERMODYNAMICSBOOK - DC PANDEY ENGLISHCHAPTER - LAWS OF THERMODYNAMICSEXERCISE - Level 2 Single Correct
27 Videos
- LAWS OF MOTIONBOOK - DC PANDEY ENGLISHCHAPTER - LAWS OF MOTIONEXERCISE - Medical entrances gallery
39 Videos
- MAGNETIC EFFECT OF CURRENT AND MAGNETISMBOOK - DC PANDEY ENGLISHCHAPTER - MAGNETIC EFFECT OF CURRENT AND MAGNETISMEXERCISE - Integer type Questions
10 Videos
Similar Questions
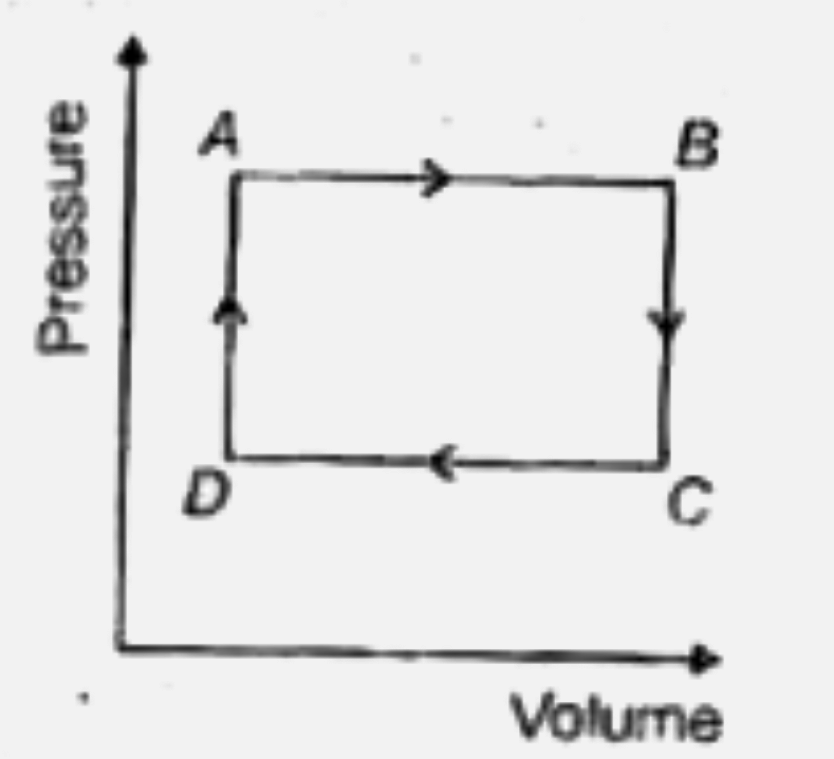
The pressure and volume of a gas are changed as shown in the p-V diagram in the figrue ahead. The thmperature of the gas
View SolutionThe pressure p and volume V of an ideal gas both increase in a process.
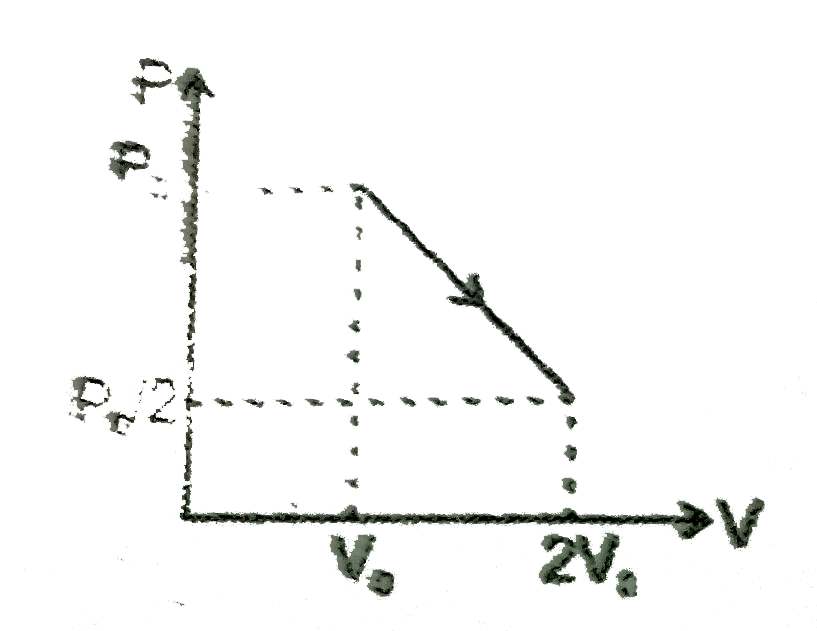
View SolutionAn ideal monatomic gas is at P0,V0. It is taken to final volume 2V0 when pressure is P0/2 in a process which is straight line on P−V diagram. Then
View SolutionAn ideal gas has pressure P, volume V and temperature T. Select the correct option.
View SolutionThe pressure P and volume V of an ideal gas both decreases in a process.
View SolutionOne mole of an ideal gas is taken from state A to state B by three different processes (a) ACB, (b) ADB and (c ) AEB as shown in the P−V diagram. The heat absorbed by the gas is
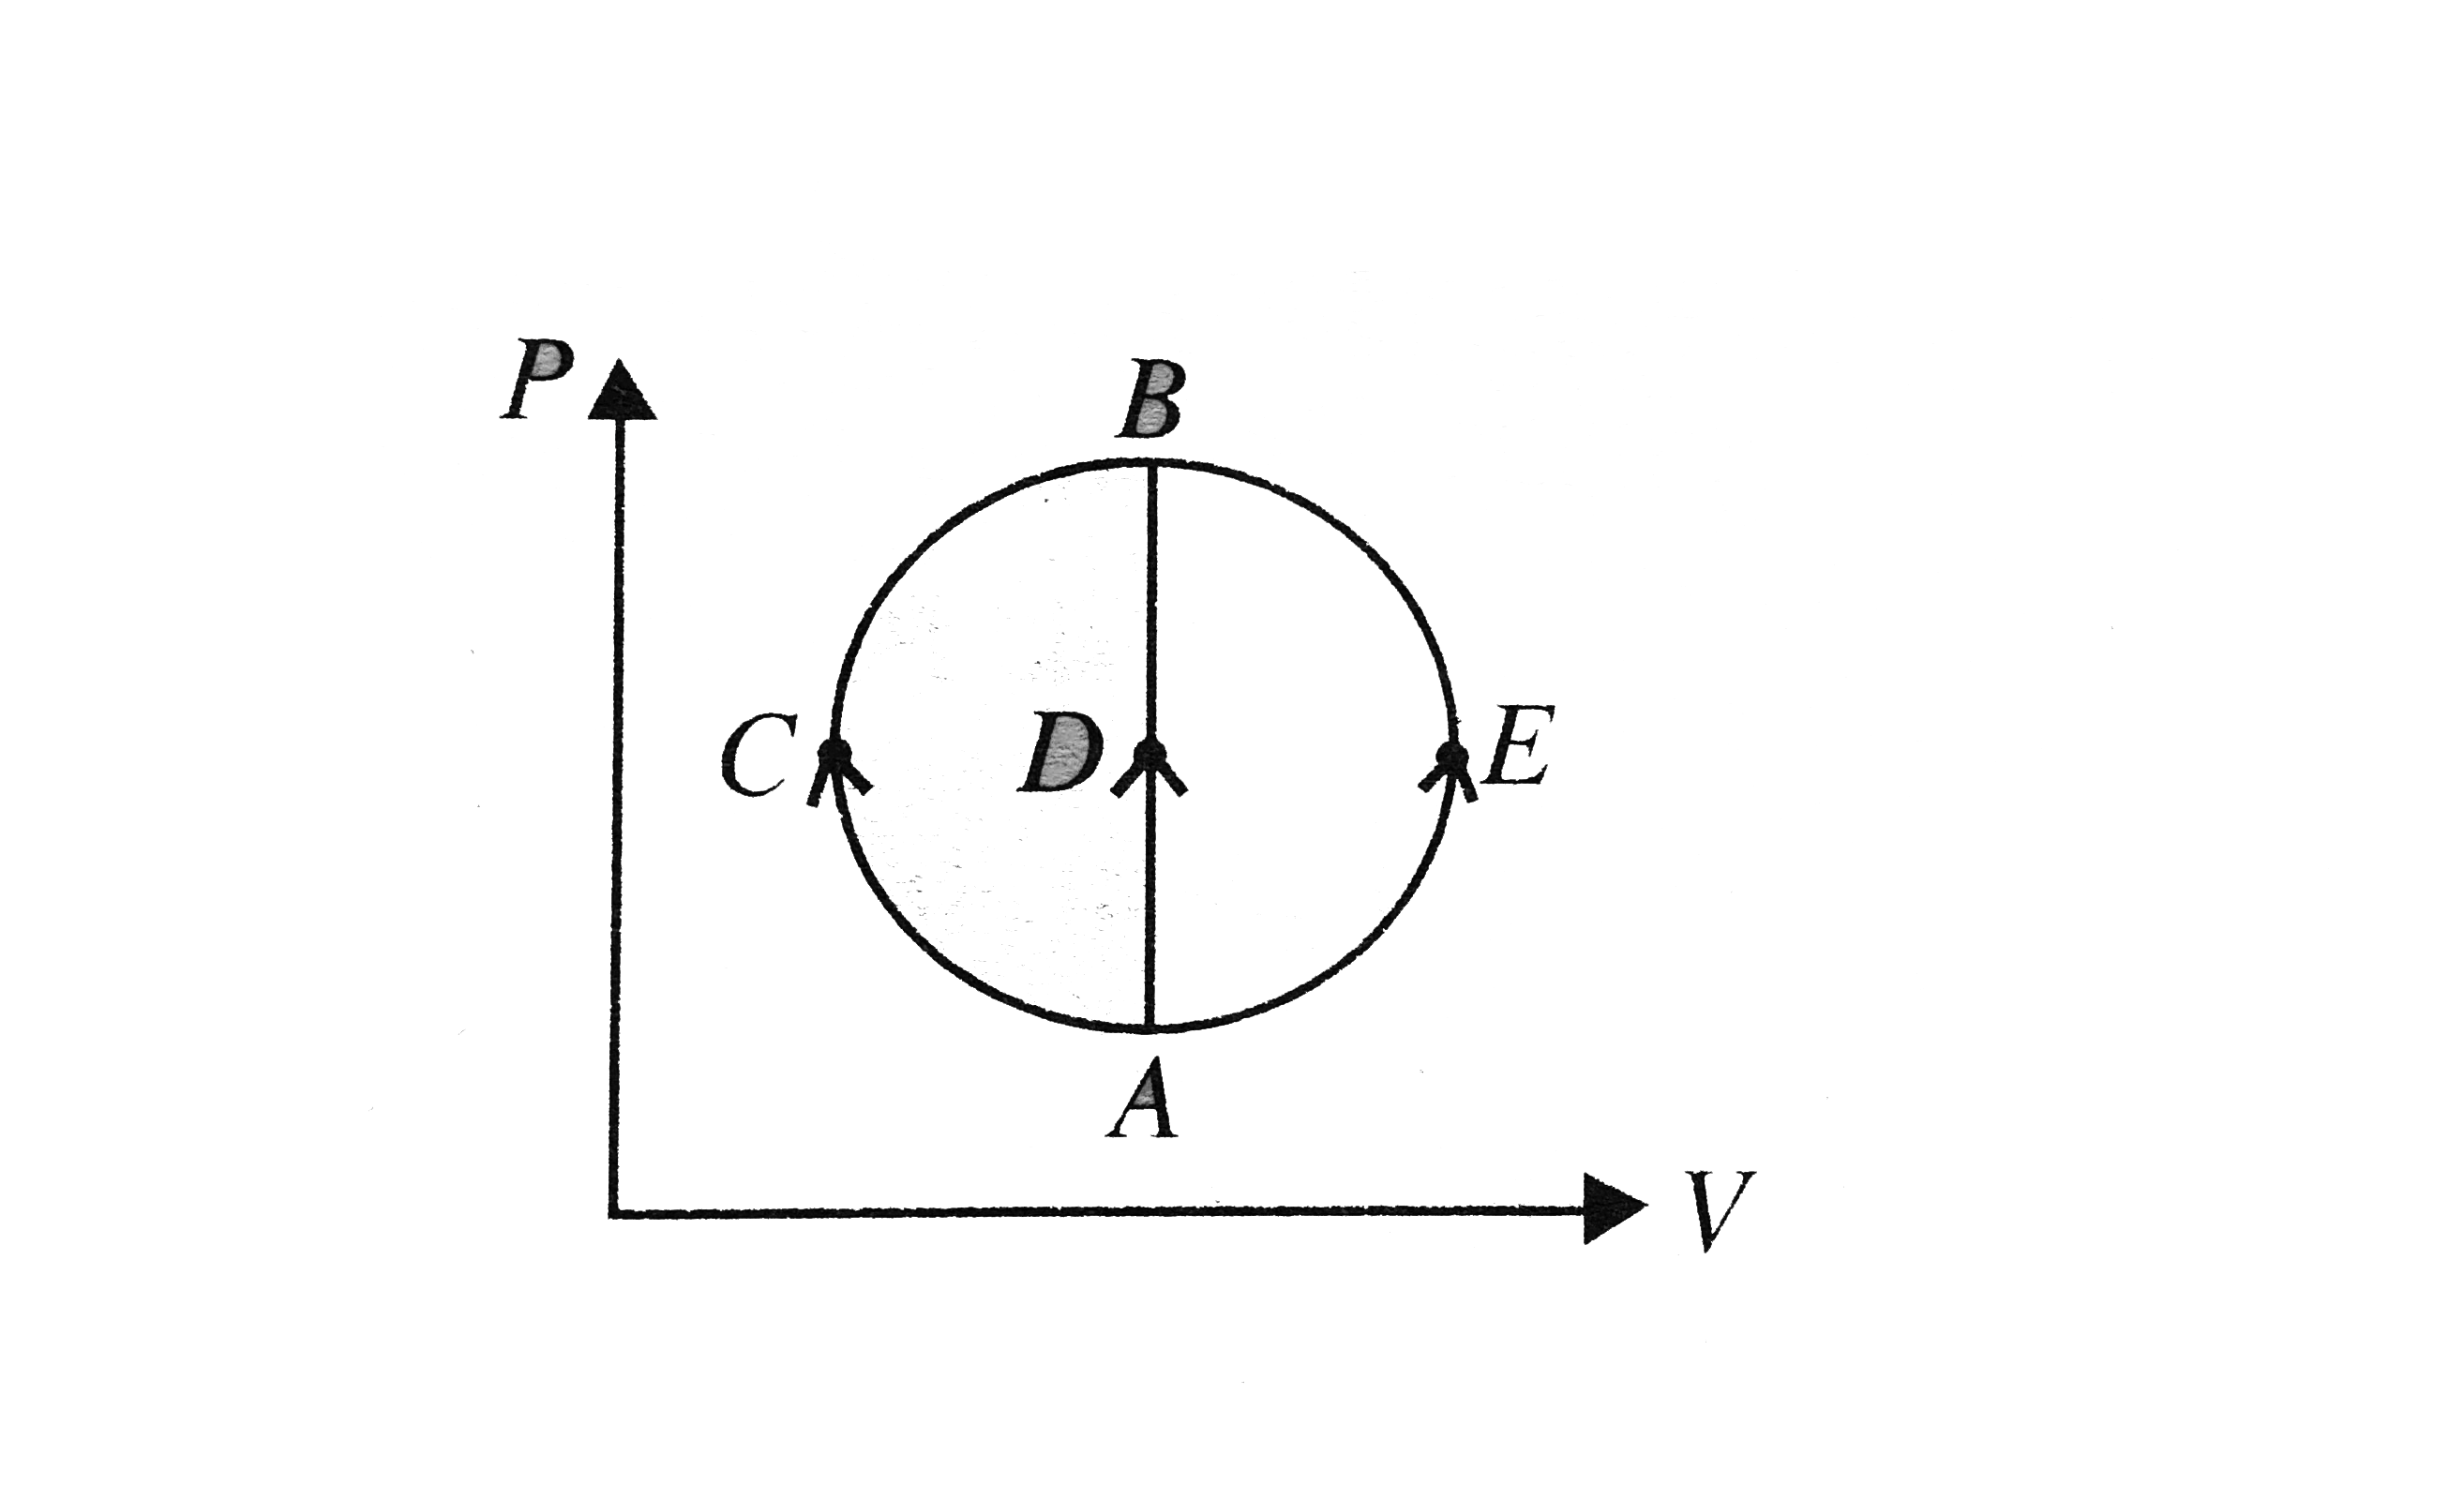
View SolutionOne mole of an ideal gas is taken from state A to state B by three different processes (a) ACB, (b) ADB and (c ) AEB as shown in the P−V diagram. The heat absorbed by the gas is

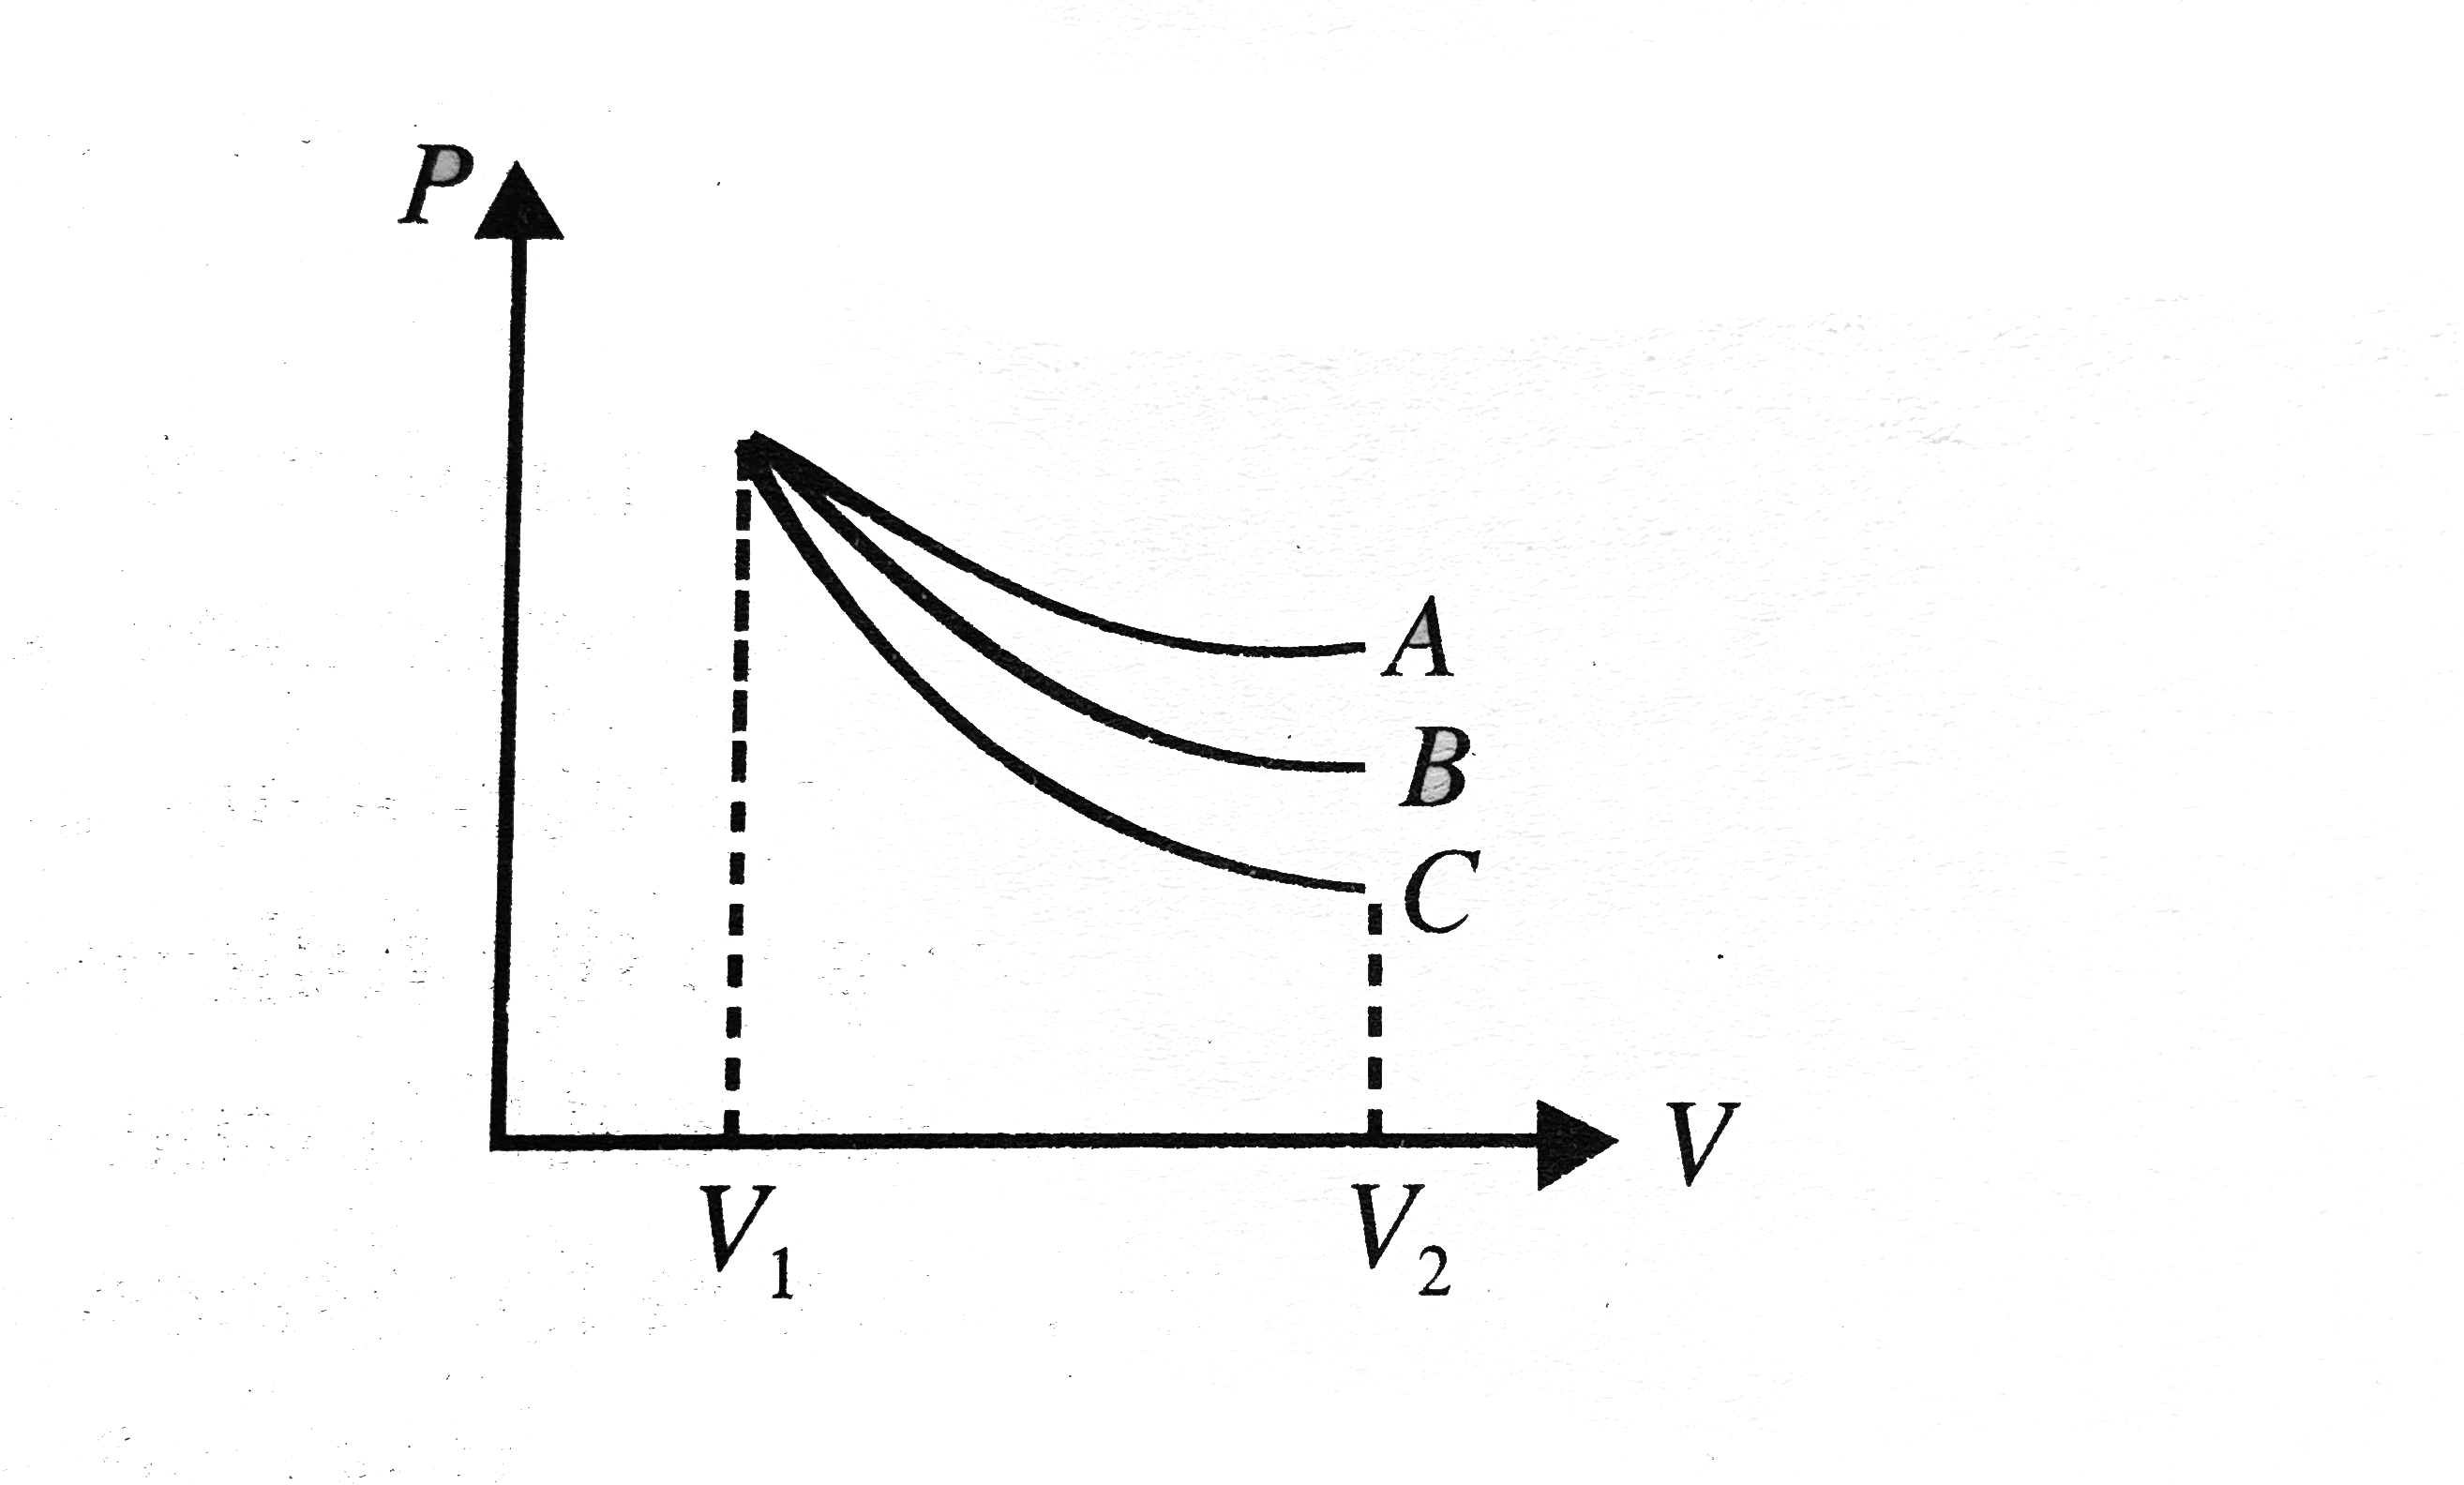
View SolutionAn ideal gas undergoes an expansion from a state with temperature T1 and volume V1 through three different polytropic processes A,B and C as shown in the P−V diagram. If |ΔEA|,|ΔEB| and |ΔEC| be the magnitude of changes in internal energy along the three paths respectively, then :
View SolutionP - V diagram of an ideal gas is shown. The gas undergoes from initial state A to final state B such that initial and final volumes are same. Select the correct alternative for given process AB.
View SolutionThe state of a mole of an ideal gas changed from state A at pressure 2P and volume V follows four different processes and finally returns to initial state A reversibly as shown below in the graph. By interpreting the graph, answer the following questions.
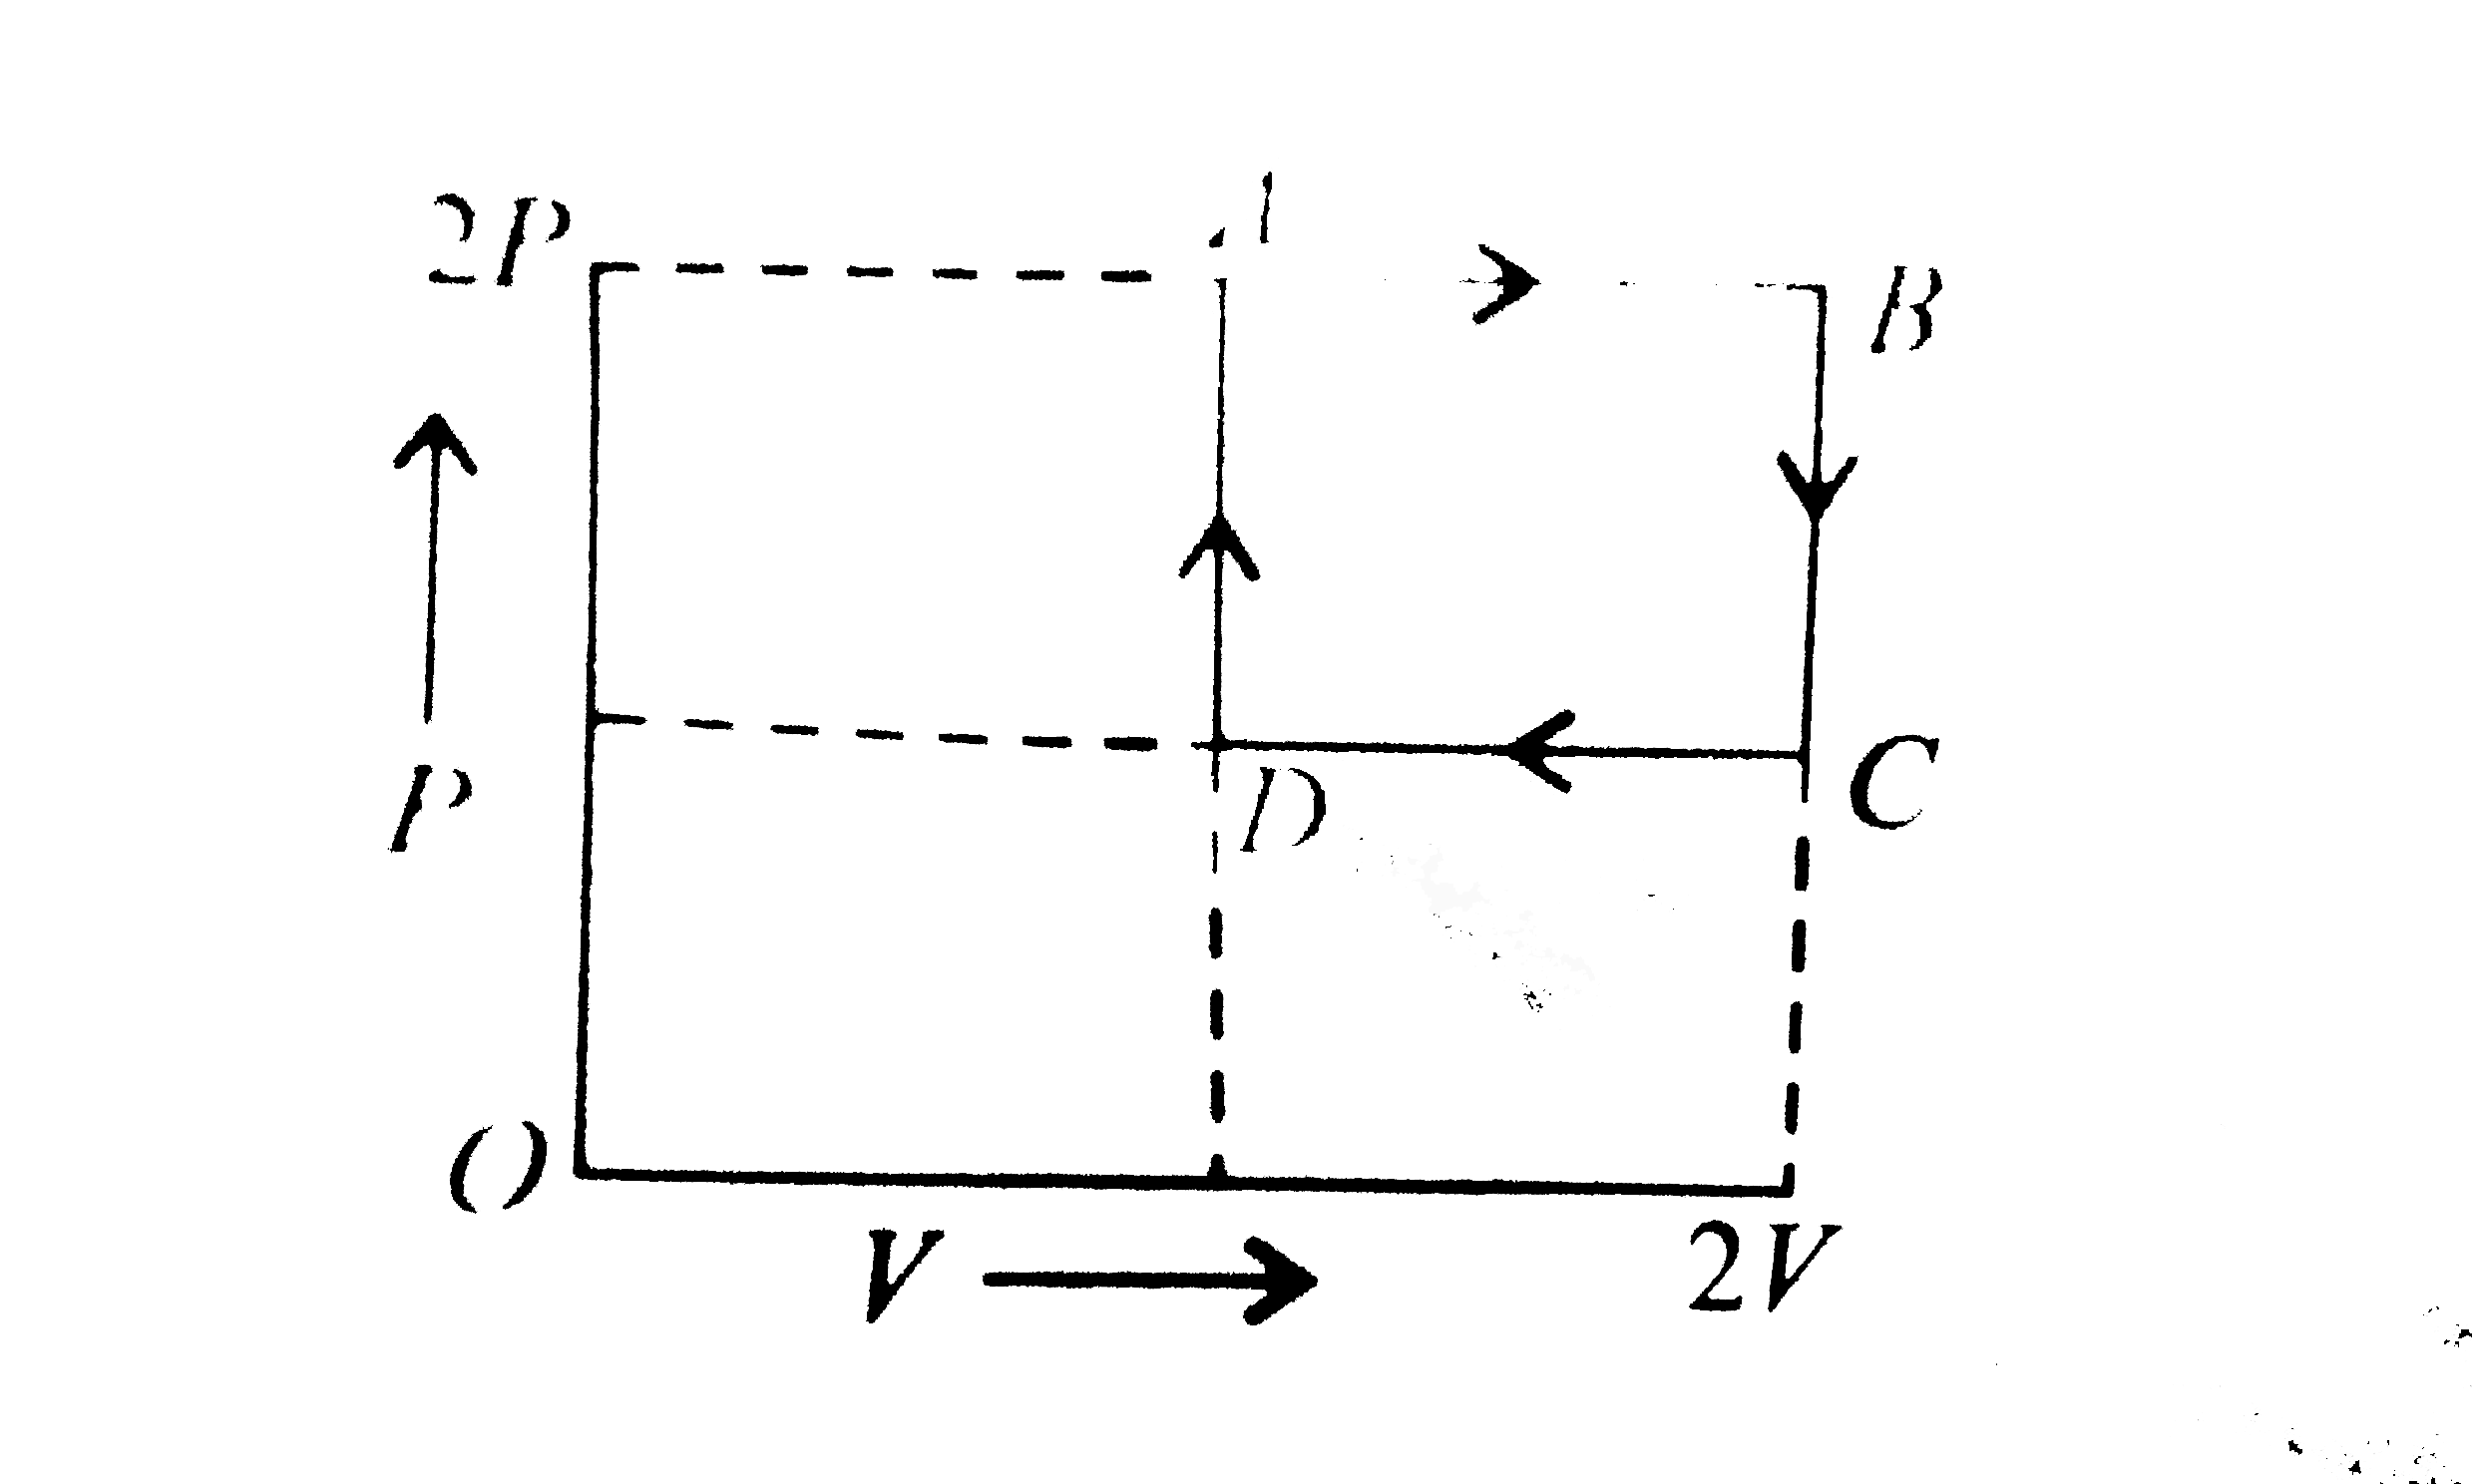
Which is the kind of process followed from state A to state, B?
View Solution
