An ideal gas is taken from the state A (pressure p, volume V) to the state B (pressure p2, volume 2V) along a straight line path in the p-V diagram. Select the correct statement(s) from the following.
The work done by the gas in the process A to B exceeds the work that would be done by it if the system were taken from A to B along an isotherm
In the T-V diagram, the path AB becomes a part of a parabola
In the p-T diageam, the AB becomes a part of a hyperbola
In going from A to B, the temperature T of the gas decreases
The correct Answer is:A, B, D
To solve the problem, we need to analyze the transition of an ideal gas from state A (pressure P, volume V) to state B (pressure P/2, volume 2V) along a straight line in the p-V diagram. We will evaluate the statements given in the question based on our analysis.
1. Identify the States:
- State A: P=P, V=V
- State B: P=P2, V=2V
2. Draw the p-V Diagram:
- Plot point A at coordinates (V, P) and point B at (2V, P/2).
- Connect these two points with a straight line, representing the path taken by the gas.
3. Calculate Work Done:
- The work done by the gas during the transition from A to B can be calculated as the area under the p-V curve.
- For a straight line, the work done W can be expressed as:
W=Area of trapezoid=12×(P+P2)×(2V−V)=12×3P2×V=3PV4
4. Compare with Isothermal Process:
- For an isothermal process between the same points, the work done can be calculated using the formula:
Wisothermal=nRTln(VfVi)
- Since both states A and B have the same temperature (as derived from the ideal gas law), the work done in the isothermal process will be less than the work done along the straight line path.
5. Evaluate Temperature Change:
- The temperature at state A can be calculated as:
TA=PVnR
- The temperature at state B is:
TB=(P2)(2V)nR=PVnR
- Thus, TA=TB, indicating that the temperatures at both states are equal.
6. Determine the Shape of the T-V Graph:
- The relationship between temperature and volume can be derived from the ideal gas law. The path taken is linear in the p-V diagram, which implies a parabolic relationship in the T-V diagram.
7. Determine the Shape of the P-T Graph:
- By manipulating the ideal gas law, we can derive the relationship between pressure and temperature, which also results in a parabolic equation.
Conclusion:
Based on the analysis, we can conclude:
- The work done by the gas from A to B exceeds the work done during an isothermal process.
- The T-V graph is parabolic.
- The P-T graph is not a hyperbola but also follows a parabolic relationship.
Correct Statements:
1. The work done by the gas in the process A to B exceeds the work done during an isothermal process.
2. The T-V graph is a parabola.
- State A: P=P, V=V
- State B: P=P2, V=2V
- Plot point A at coordinates (V, P) and point B at (2V, P/2).
- Connect these two points with a straight line, representing the path taken by the gas.
- The work done by the gas during the transition from A to B can be calculated as the area under the p-V curve.
- For a straight line, the work done W can be expressed as:
W=Area of trapezoid=12×(P+P2)×(2V−V)=12×3P2×V=3PV4
- For an isothermal process between the same points, the work done can be calculated using the formula:
Wisothermal=nRTln(VfVi)
- Since both states A and B have the same temperature (as derived from the ideal gas law), the work done in the isothermal process will be less than the work done along the straight line path.
- The temperature at state A can be calculated as:
TA=PVnR
- The temperature at state B is:
TB=(P2)(2V)nR=PVnR
- Thus, TA=TB, indicating that the temperatures at both states are equal.
- The relationship between temperature and volume can be derived from the ideal gas law. The path taken is linear in the p-V diagram, which implies a parabolic relationship in the T-V diagram.
- By manipulating the ideal gas law, we can derive the relationship between pressure and temperature, which also results in a parabolic equation.
Based on the analysis, we can conclude:
- The work done by the gas from A to B exceeds the work done during an isothermal process.
- The T-V graph is parabolic.
- The P-T graph is not a hyperbola but also follows a parabolic relationship.
1. The work done by the gas in the process A to B exceeds the work done during an isothermal process.
2. The T-V graph is a parabola.
Topper's Solved these Questions
Similar Questions
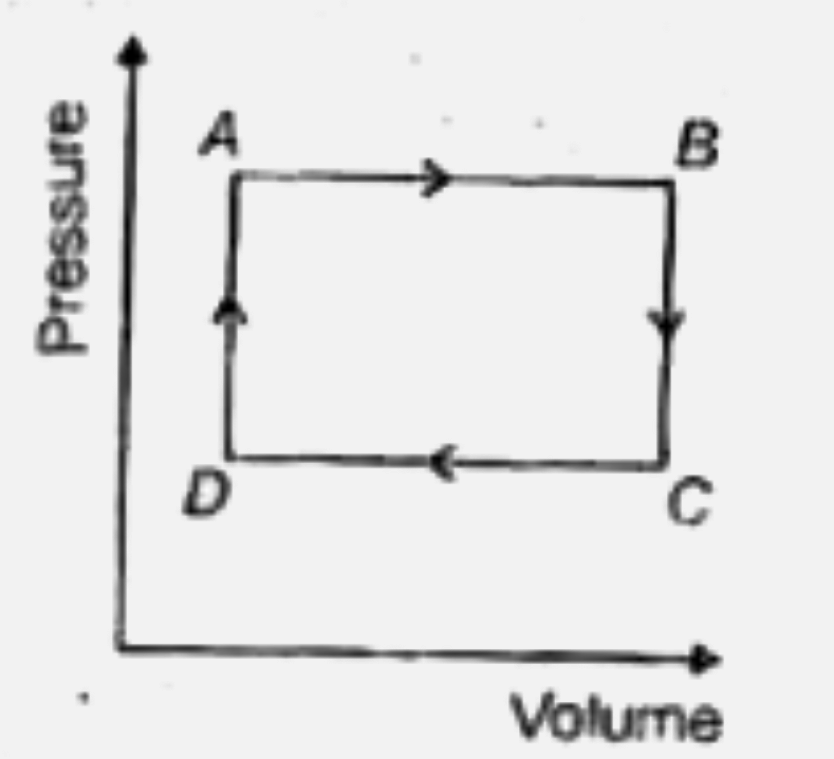
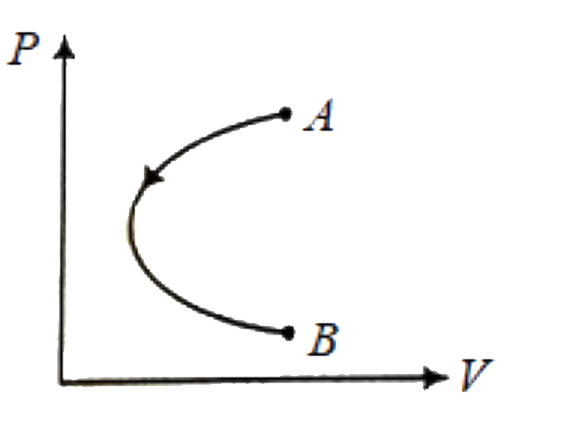
The pressure and volume of a gas are changed as shown in the p-V diagram in the figrue ahead. The thmperature of the gas
View SolutionThe pressure p and volume V of an ideal gas both increase in a process.
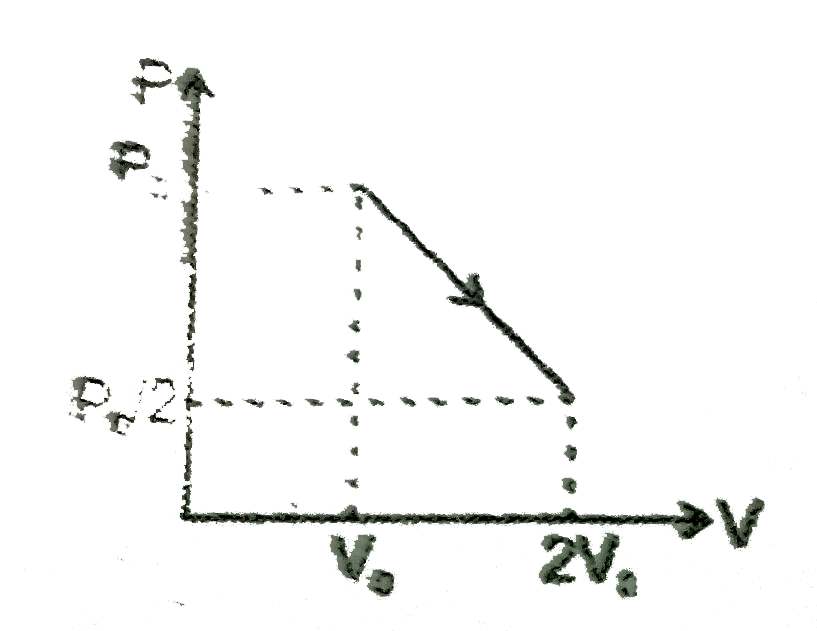
View SolutionAn ideal monatomic gas is at P0,V0. It is taken to final volume 2V0 when pressure is P0/2 in a process which is straight line on P−V diagram. Then
View SolutionAn ideal gas has pressure P, volume V and temperature T. Select the correct option.
View SolutionThe pressure P and volume V of an ideal gas both decreases in a process.
View SolutionOne mole of an ideal gas is taken from state A to state B by three different processes (a) ACB, (b) ADB and (c ) AEB as shown in the P−V diagram. The heat absorbed by the gas is
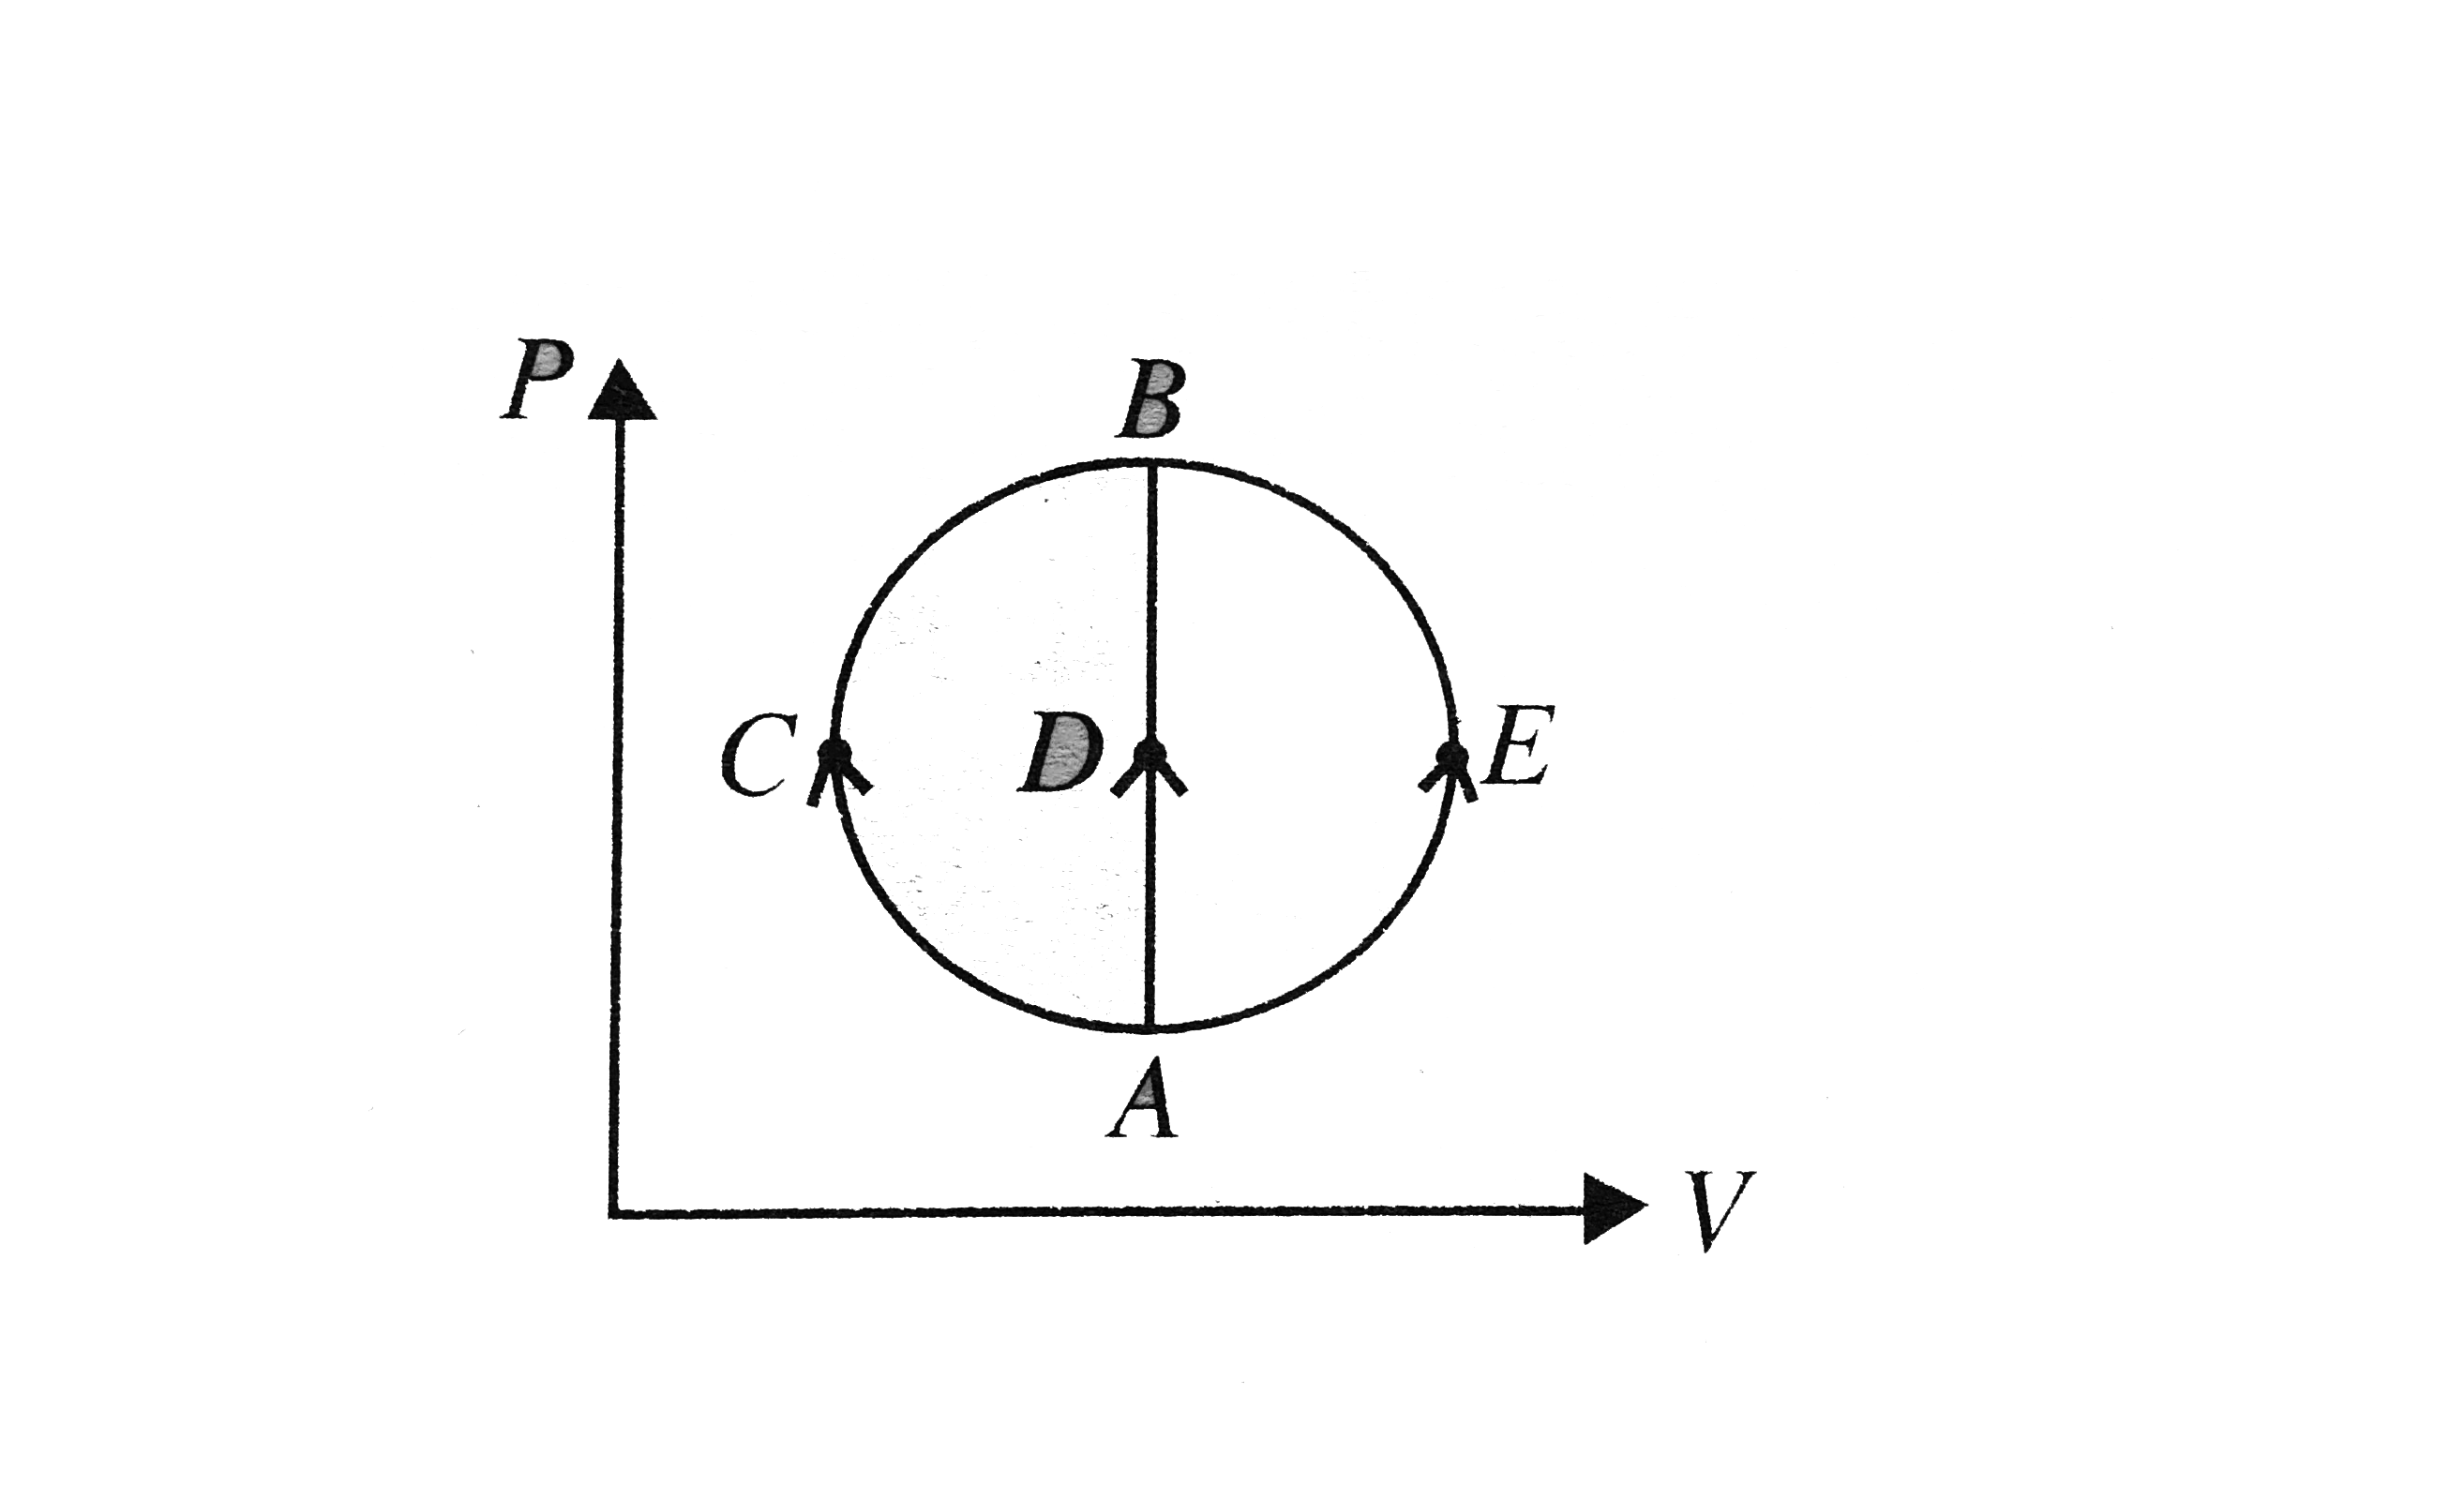
View SolutionOne mole of an ideal gas is taken from state A to state B by three different processes (a) ACB, (b) ADB and (c ) AEB as shown in the P−V diagram. The heat absorbed by the gas is

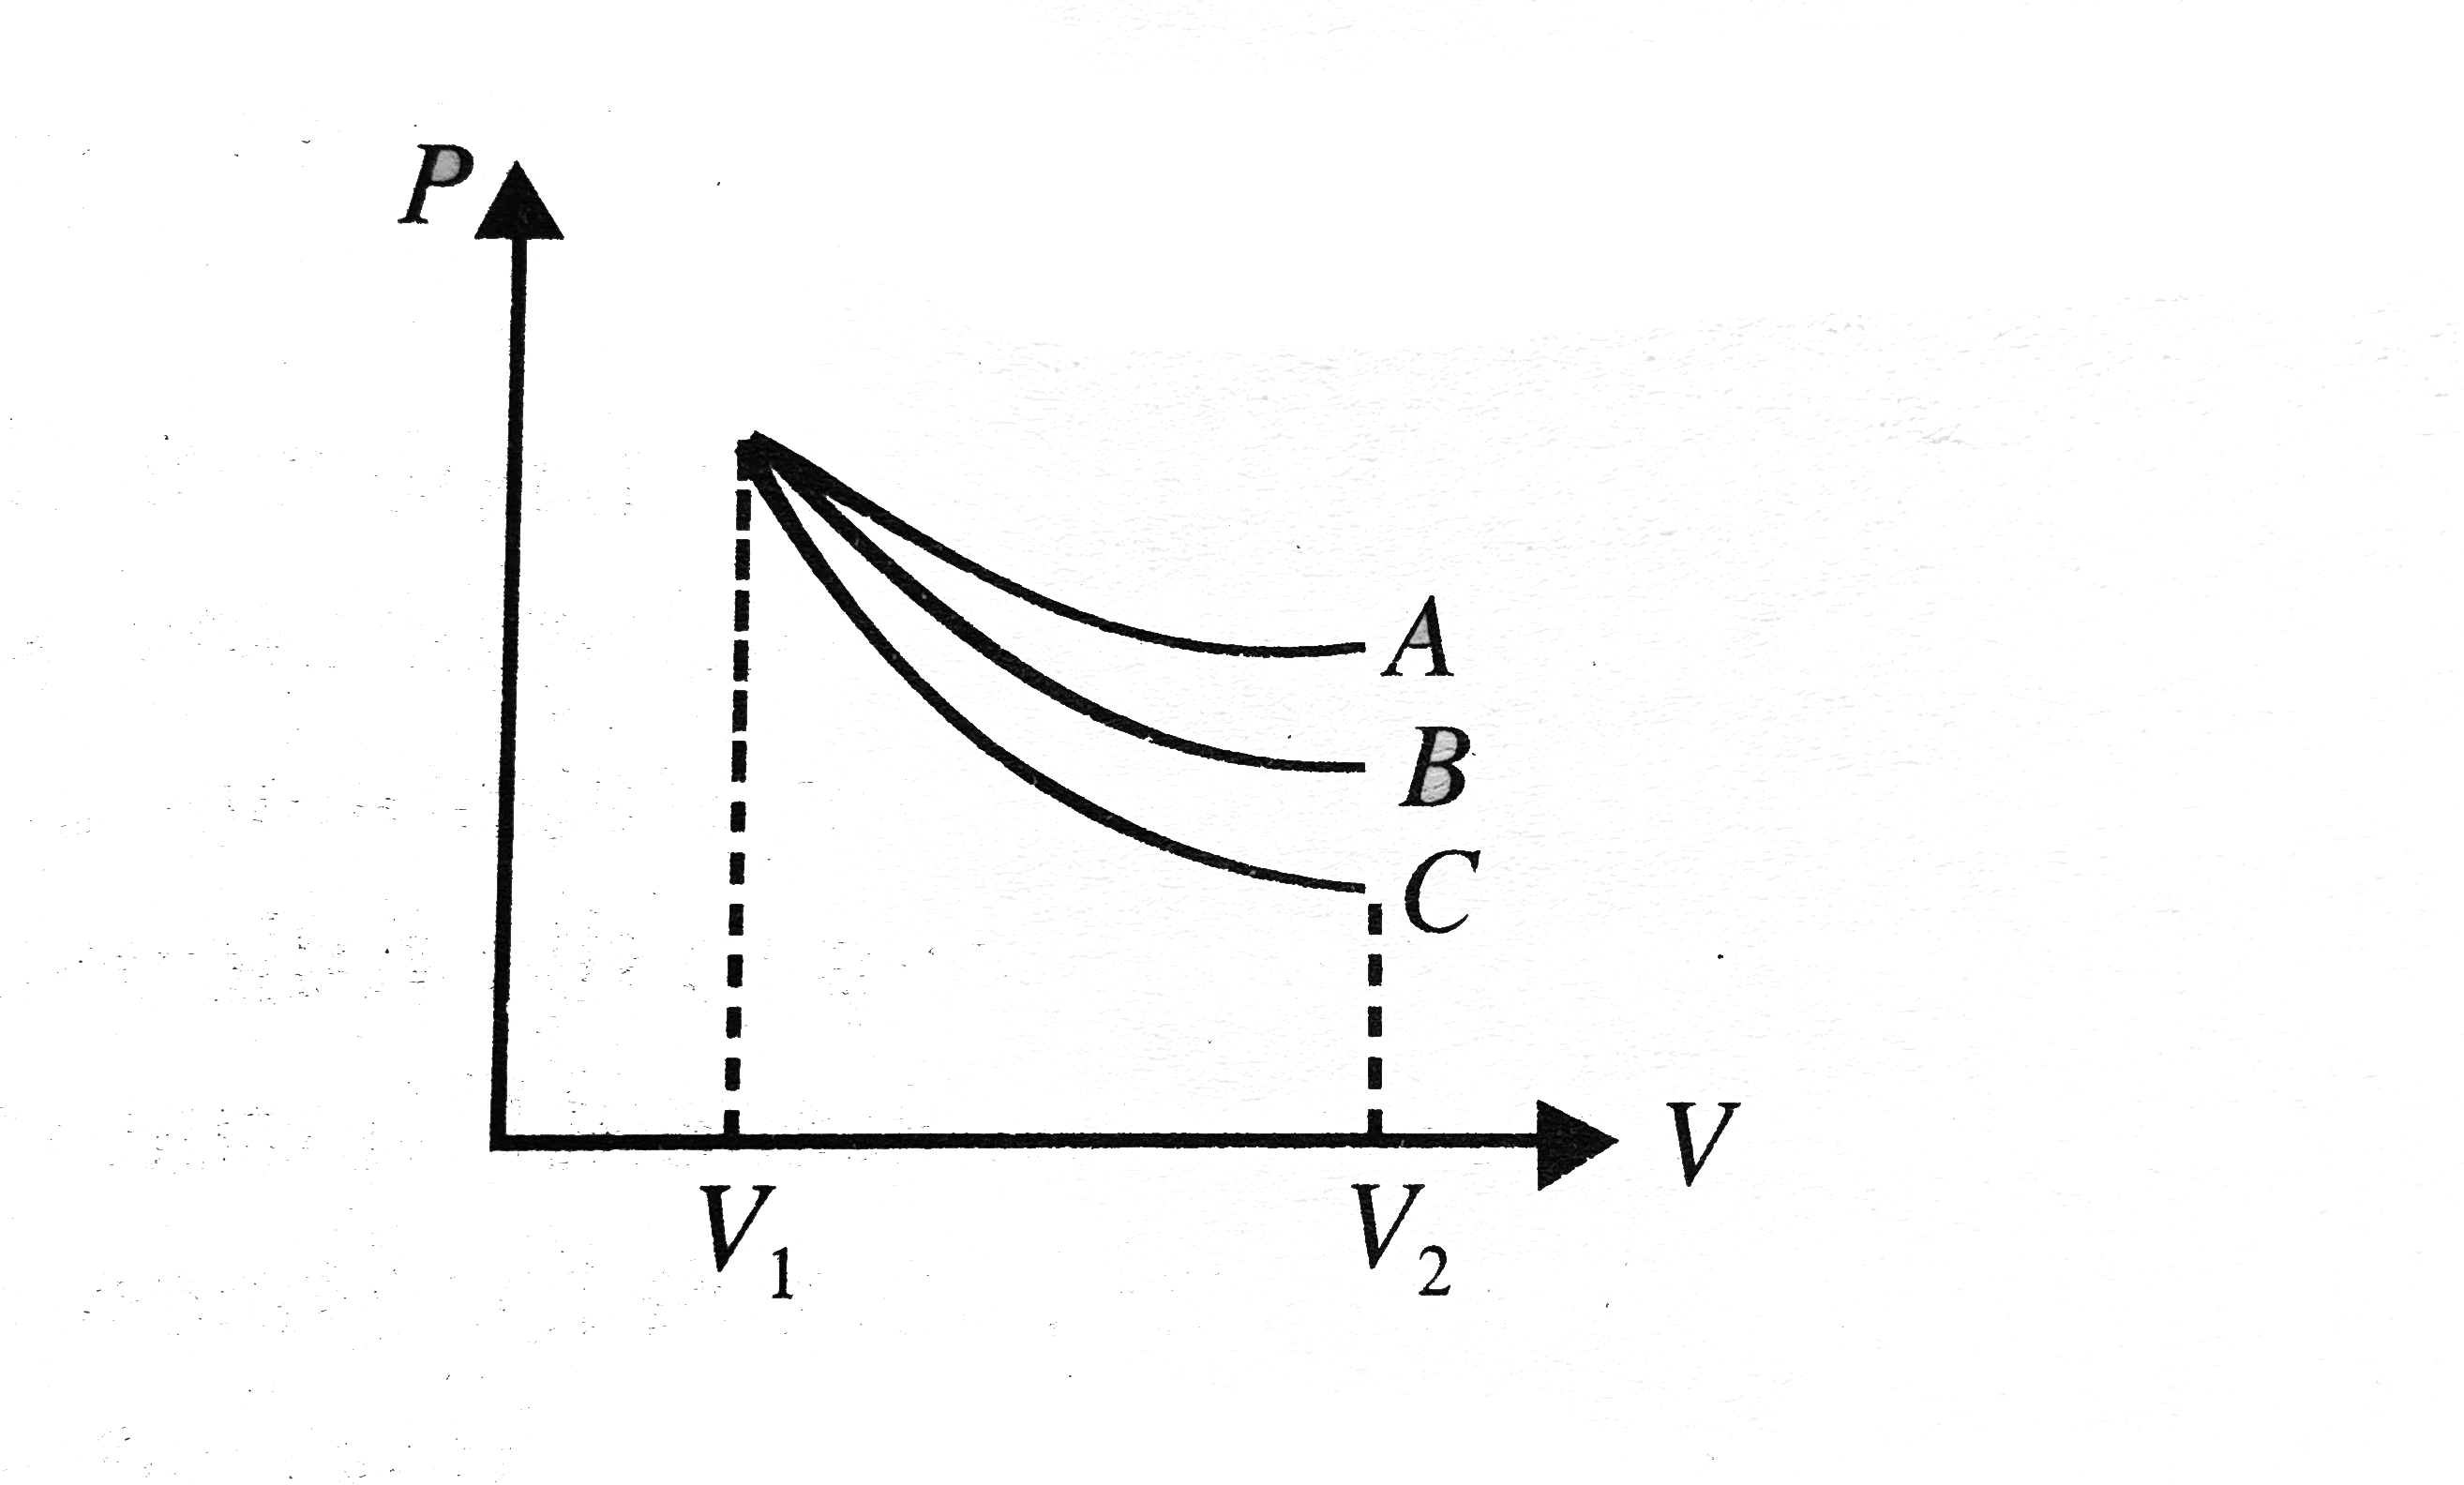
View SolutionAn ideal gas undergoes an expansion from a state with temperature T1 and volume V1 through three different polytropic processes A,B and C as shown in the P−V diagram. If |ΔEA|,|ΔEB| and |ΔEC| be the magnitude of changes in internal energy along the three paths respectively, then :
View SolutionP - V diagram of an ideal gas is shown. The gas undergoes from initial state A to final state B such that initial and final volumes are same. Select the correct alternative for given process AB.
View SolutionThe state of a mole of an ideal gas changed from state A at pressure 2P and volume V follows four different processes and finally returns to initial state A reversibly as shown below in the graph. By interpreting the graph, answer the following questions.
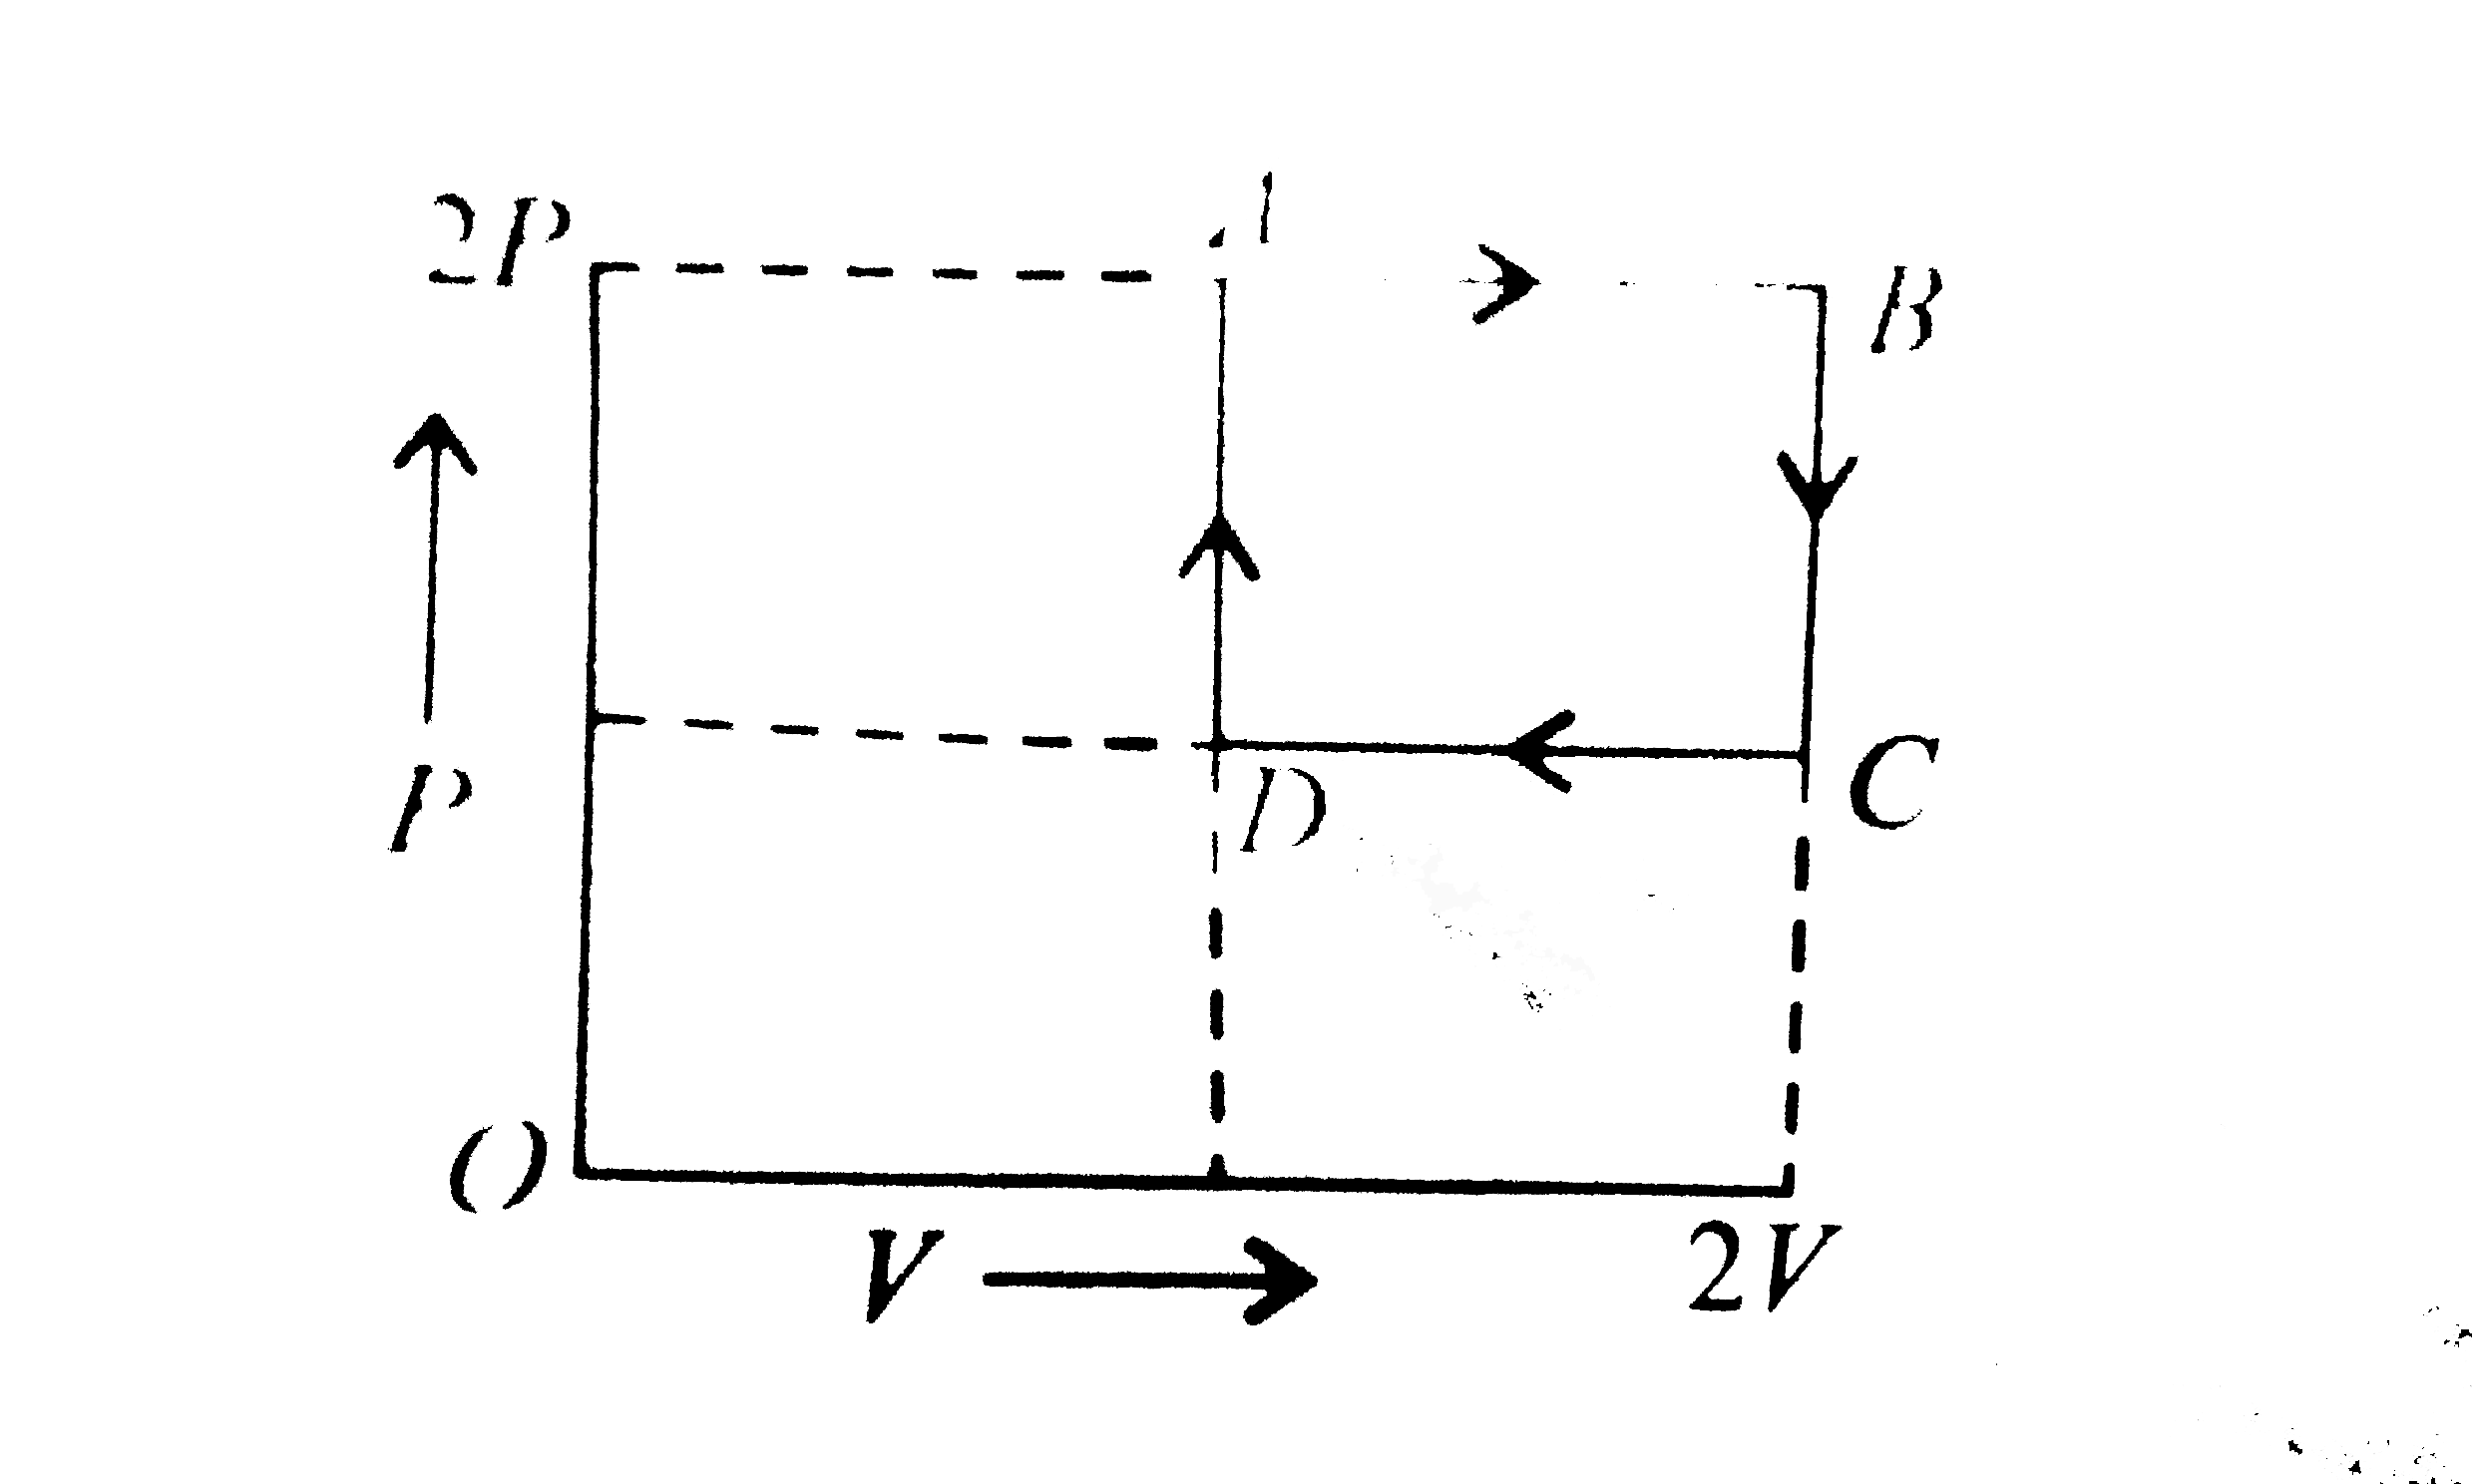
Which is the kind of process followed from state A to state, B?
View Solution
