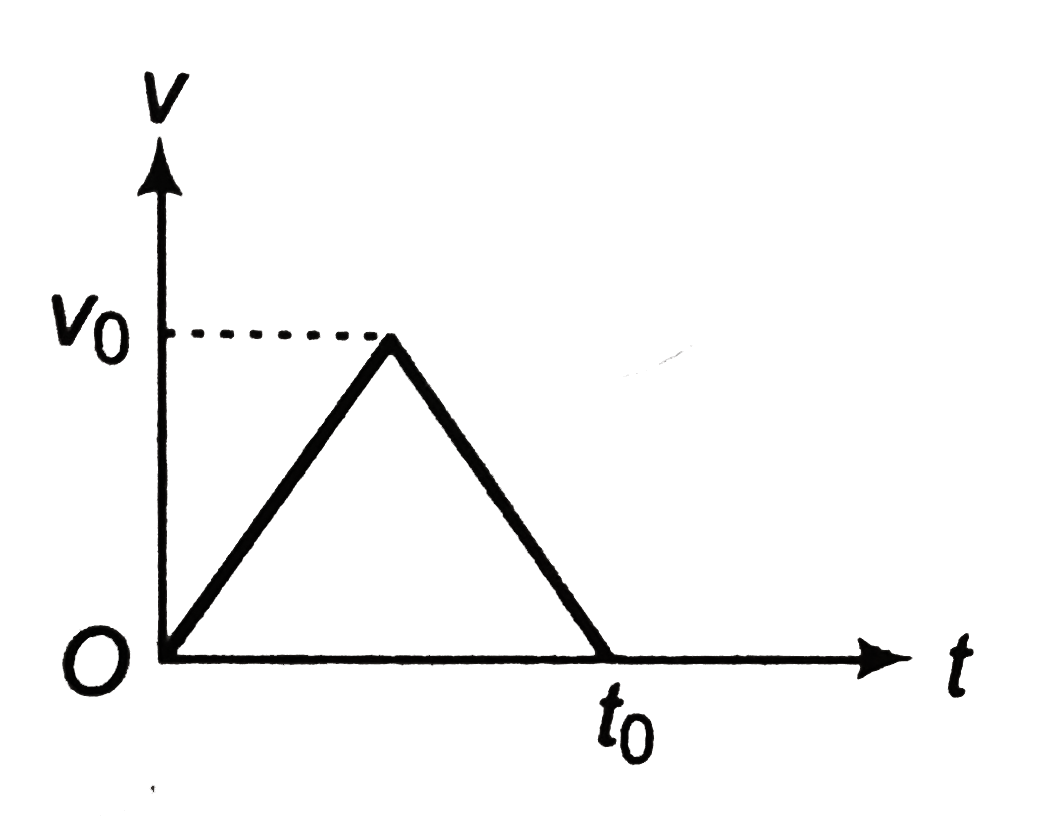
Assertion : In v-t graph shown in figure, average velocity in time interval from 0→t0 depends only on v0. It is independent of t0.
Reason : In the given time interval average velocity is v02.
If the both Assertion and Reason are true and the Reason is correct explanation of the Assertion.
If both Assertion and Reason are true but Reason is not the correct explanation of Assertion.
If Assertion is true, but the Reason is false.
If Assertion is false but the Reason is true.
The correct Answer is:A
Average velocity=st
=area of v-t grap h/t
=(12v0t0)t0=v02
Topper's Solved these Questions
- BOOK - DC PANDEYCHAPTER - KINEMATICSEXERCISE - Objective45videos
KINEMATICS
- BOOK - DC PANDEYCHAPTER - KINEMATICSEXERCISE - Subjective51videos
KINEMATICS
- BOOK - DC PANDEYCHAPTER - KINEMATICSEXERCISE - Exercise 6.96videos
KINEMATICS
- BOOK - DC PANDEYCHAPTER - GRAVITATIONEXERCISE - (C) Chapter Exercises45videos
GRAVITATION
- BOOK - DC PANDEYCHAPTER - KINEMATICS 1EXERCISE - INTEGER_TYPE15videos
KINEMATICS 1
Similar Questions
A particle move with a velocity v=αt3 along a straight line.The average velocity in time interval t=0 to t=T is
View SolutionThe v-t graph for a particle moving along x-axis is shown in the figure, find
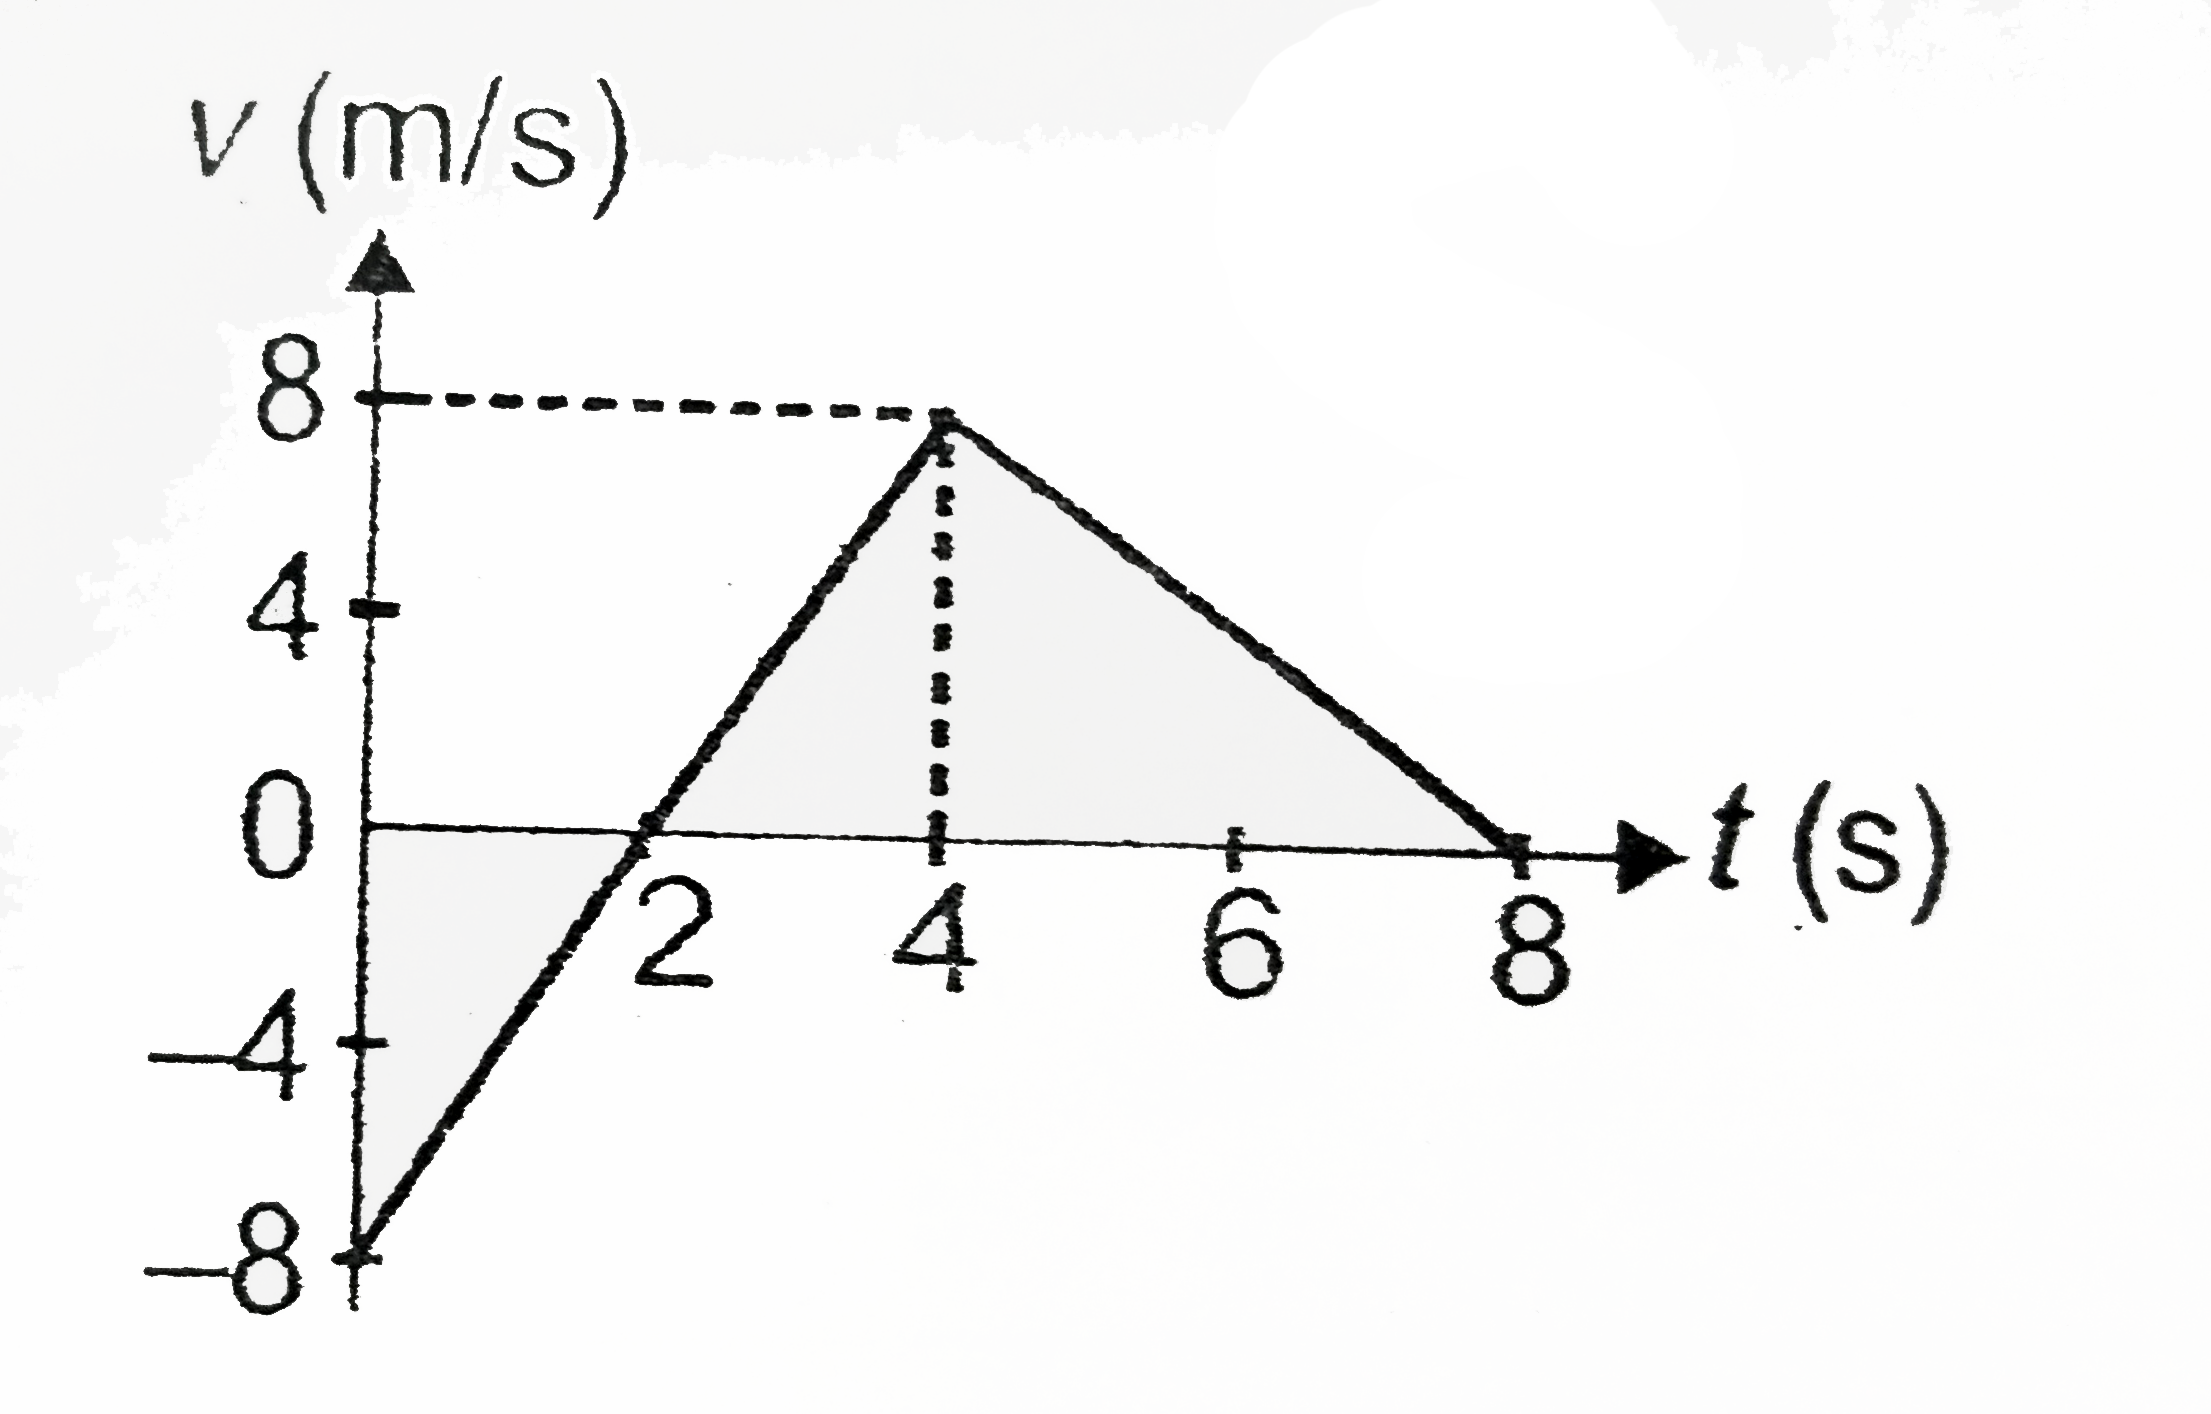
(a) Average velocity in the interval 0 to 8 s.
(b) Average speed in the interval 0 to 8 s.
(c) Average acceleration in the interval 0 to 4 s.
(d) Instantaneous acceleration at t = 2.5 s.View Solution
Knowledge Check
- Question 1 - Select One
Assertion : In the υ−t diagram as shown in figure, average velocity between the interval t = 0 and t=t0 is independent of t0
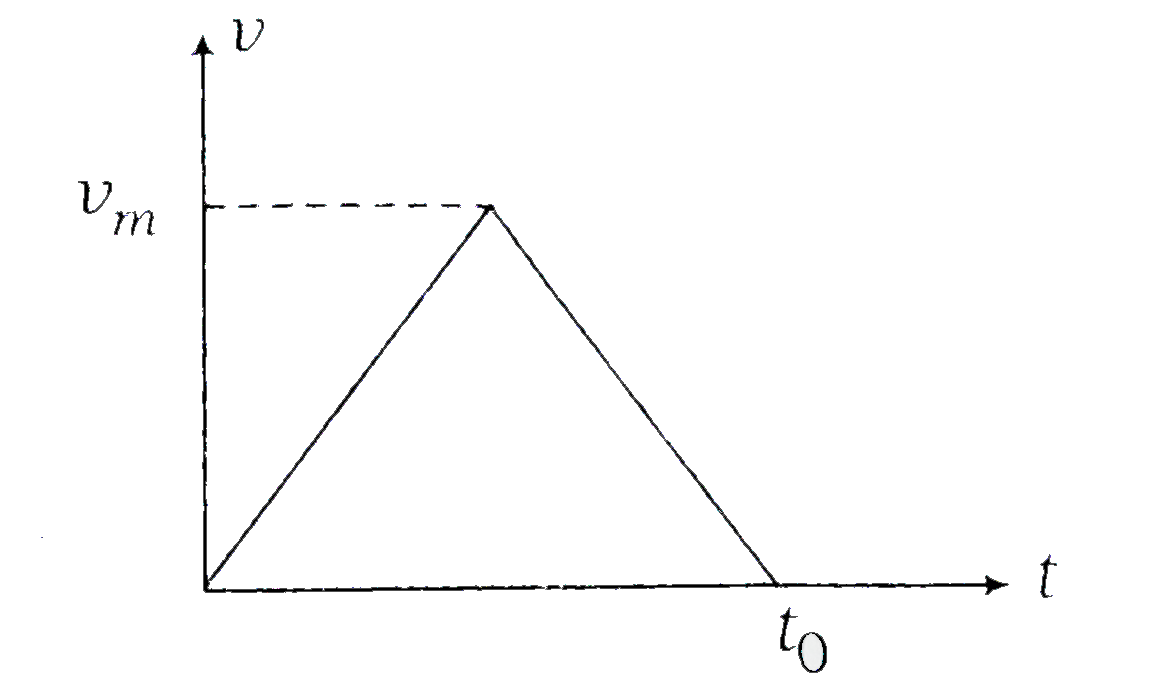
Reason : Average velocity in the given interval is 12υm.AIf both Assertion and Reason are correct and Reason is the correct explanation of assertion.BIf both Assertion and Reason are correct but Reason in not the correct explanation of Assertion.CIf Assertion is true but Reason is false.DIf Assertion is false but Reason is true. - Question 2 - Select One
For the acceleration - time (a - t) graph shown in figure, the change in velocity of particle from t = 0 to t = 6 s is
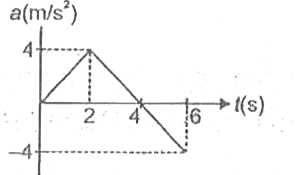 A10 m/sB4 m/sC12 m/sD8 m/s
 - Question 3 - Select One
The velocity-time plot is shown in figure. Find the average speed in time interval t=0 to t=40s during the period.
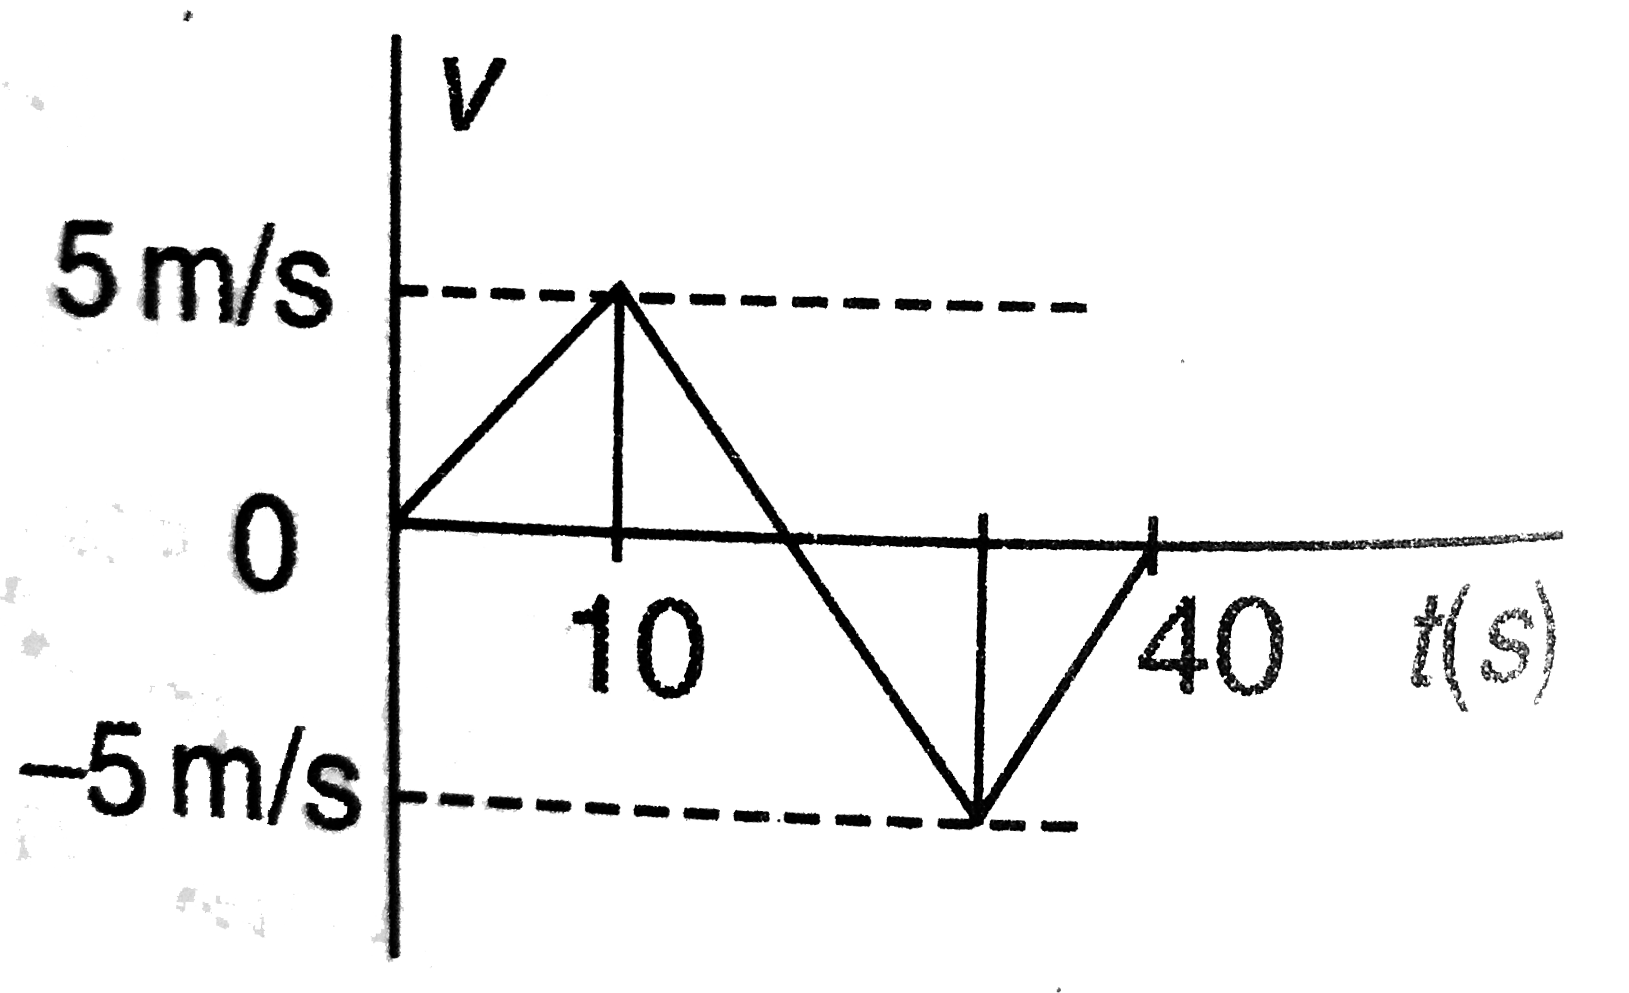 AzeroB2.5m/sC5m/sDnone
Velocity-time graph for a particle is shown in following figure for time interval 0 to 2T.
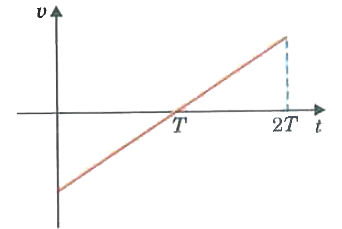 View Solution
Velocity-time graph of a particle moving in a straight line is shown in figure. In the time interval from t = 0 to t = 14 s, find:
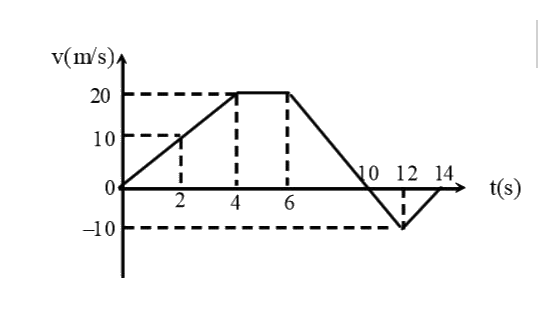
Q. average velocity andView SolutionThe velocity time graph of a particle moving along a straight line is shown in the figure. In the time interval from t=0 to t=8 second, answer the following three question.
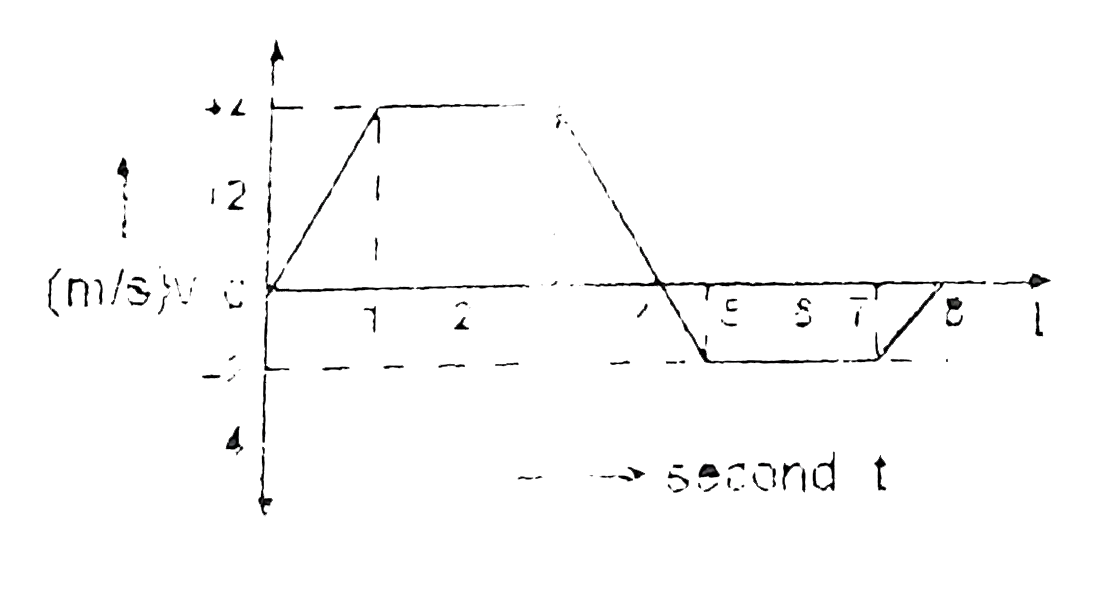
The value of magnitude of maximum velocitymagnitude of average velocity for the given time interval is :View SolutionThe velocity time graph of a particle moving along a straight line is shown in the figure. In the time interval from t=0 to t=8 second, answer the following three question.
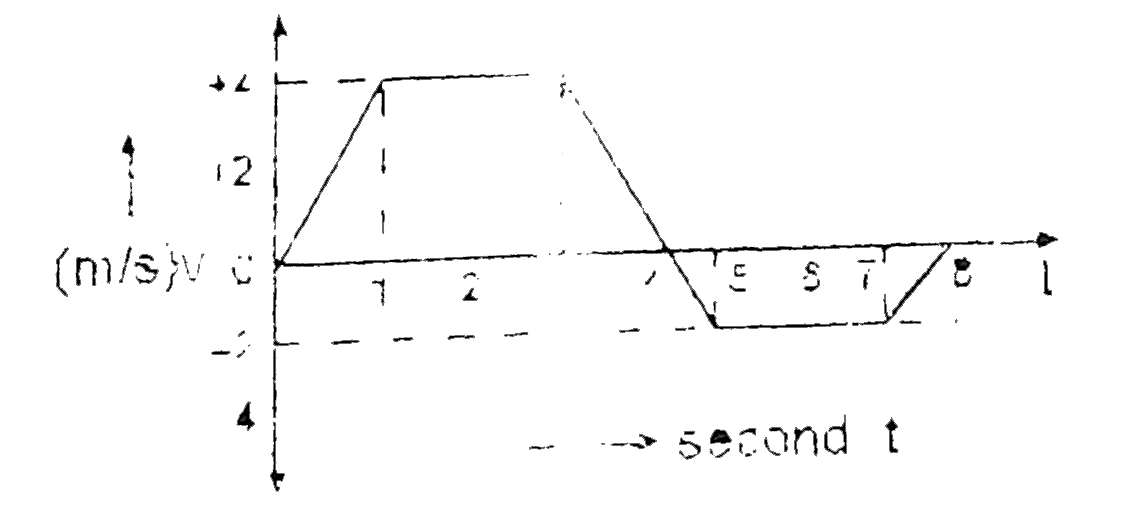
The value of maximum speedaverage speed for the given time interval is :View SolutionIf velocity of a particle is given by v=(2t+3)m/s. Then average velocity in interval 0≤t≤1 s is :
View Solution

