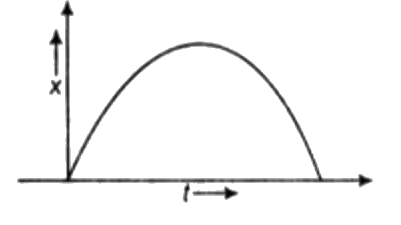
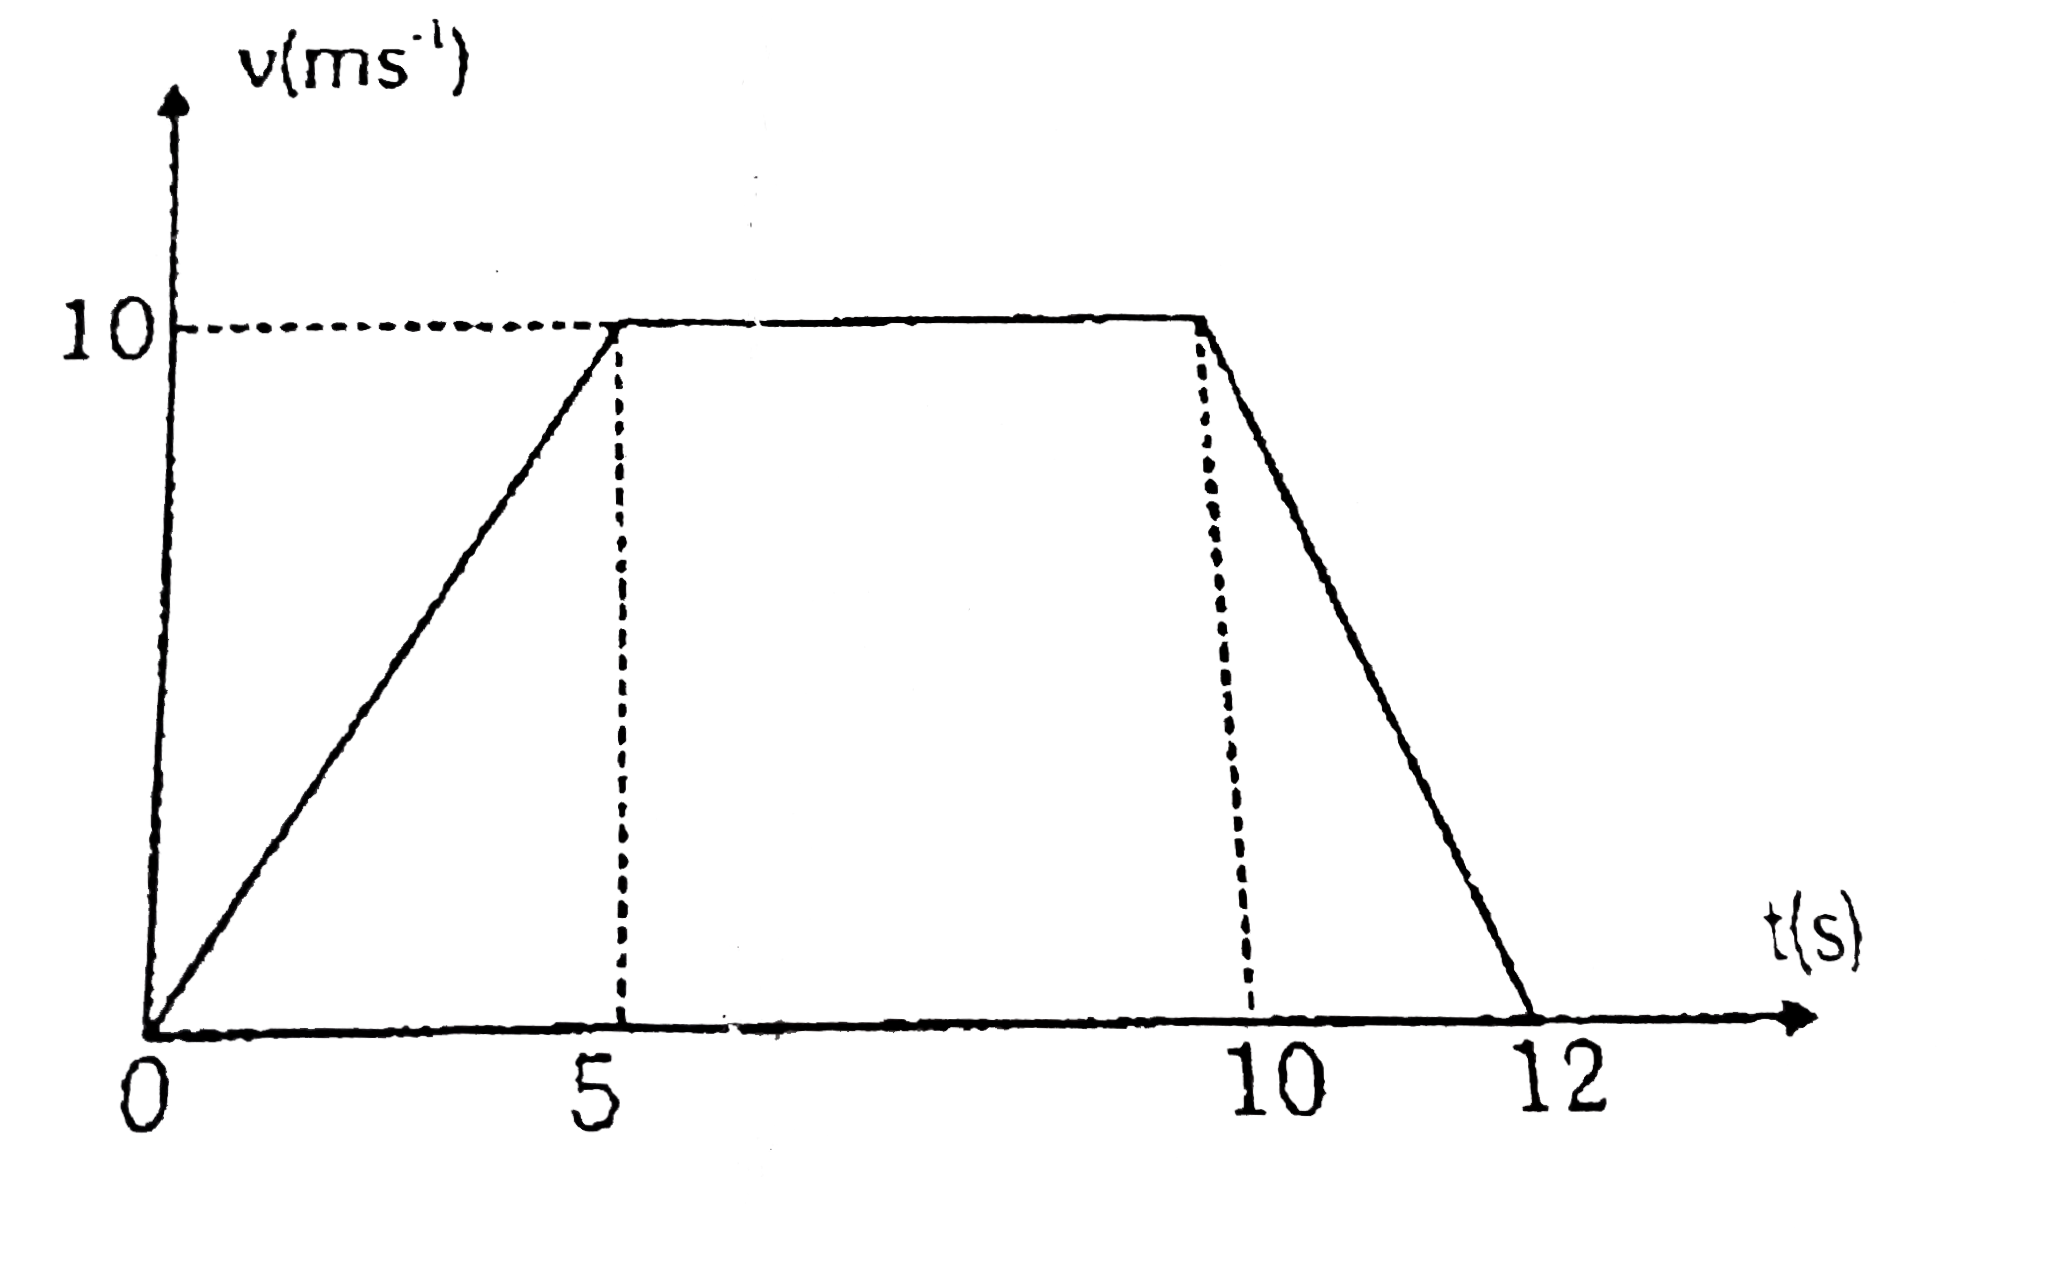
Assertion : Displacement-time graph is a parabola corresponding to straight line velocity-time graph.
Reason : lf v=u+at then s=ut+12at2
If the both Assertion and Reason are true and the Reason is correct explanation of the Assertion.
If both Assertion and Reason are true but Reason is not the correct explanation of Assertion.
If Assertion is true, but the Reason is false.
If Assertion is false but the Reason is true.
The correct Answer is:D
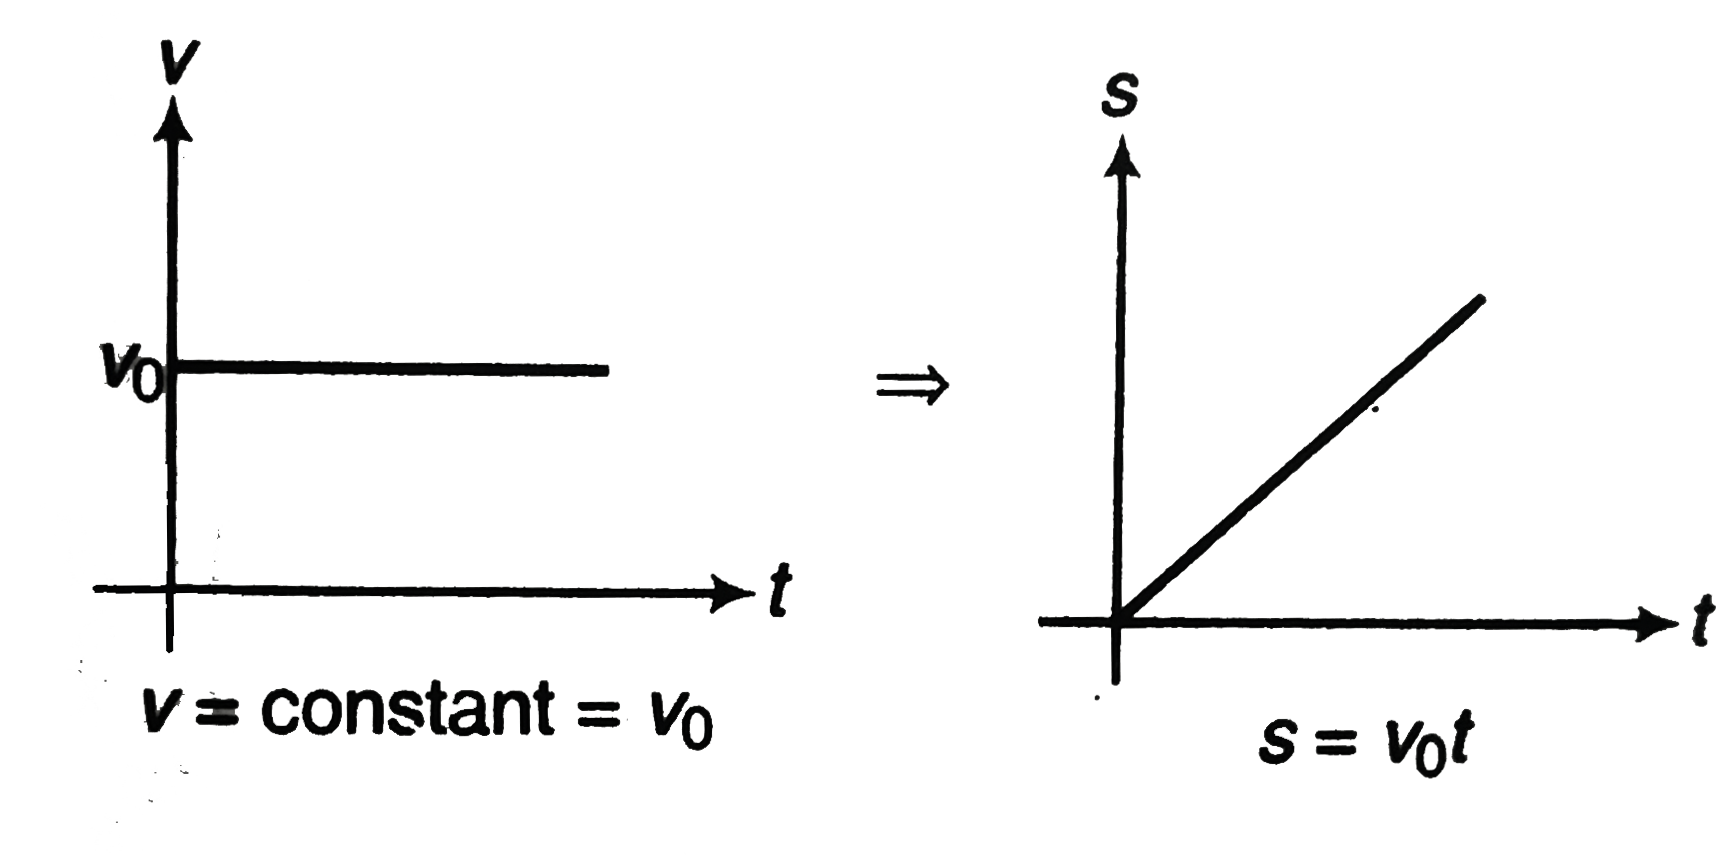
In the given situation, v-t graph is a straight line.
But s-t graph is also a straight line.
Topper's Solved these Questions
- KINEMATICSBook:DC PANDEYChapter:KINEMATICSExercise:Objective
Explore 45 Videos
- KINEMATICSBook:DC PANDEYChapter:KINEMATICSExercise:Subjective
Explore 51 Videos
- KINEMATICSBook:DC PANDEYChapter:KINEMATICSExercise:Exercise 6.9
Explore 6 Videos
- GRAVITATIONBook:DC PANDEYChapter:GRAVITATIONExercise:(C) Chapter Exercises
Explore 45 Videos
- KINEMATICS 1Book:DC PANDEYChapter:KINEMATICS 1Exercise:INTEGER_TYPE
Explore 15 Videos
Similar Questions
Knowledge Check
Displacement time graph of a particle moving in a straight line is a shown in figure.
 Ain region A acceleration is positiveBin region B acceleration is negativeCin region C acceleration is positiveDin region D acceleration is negative
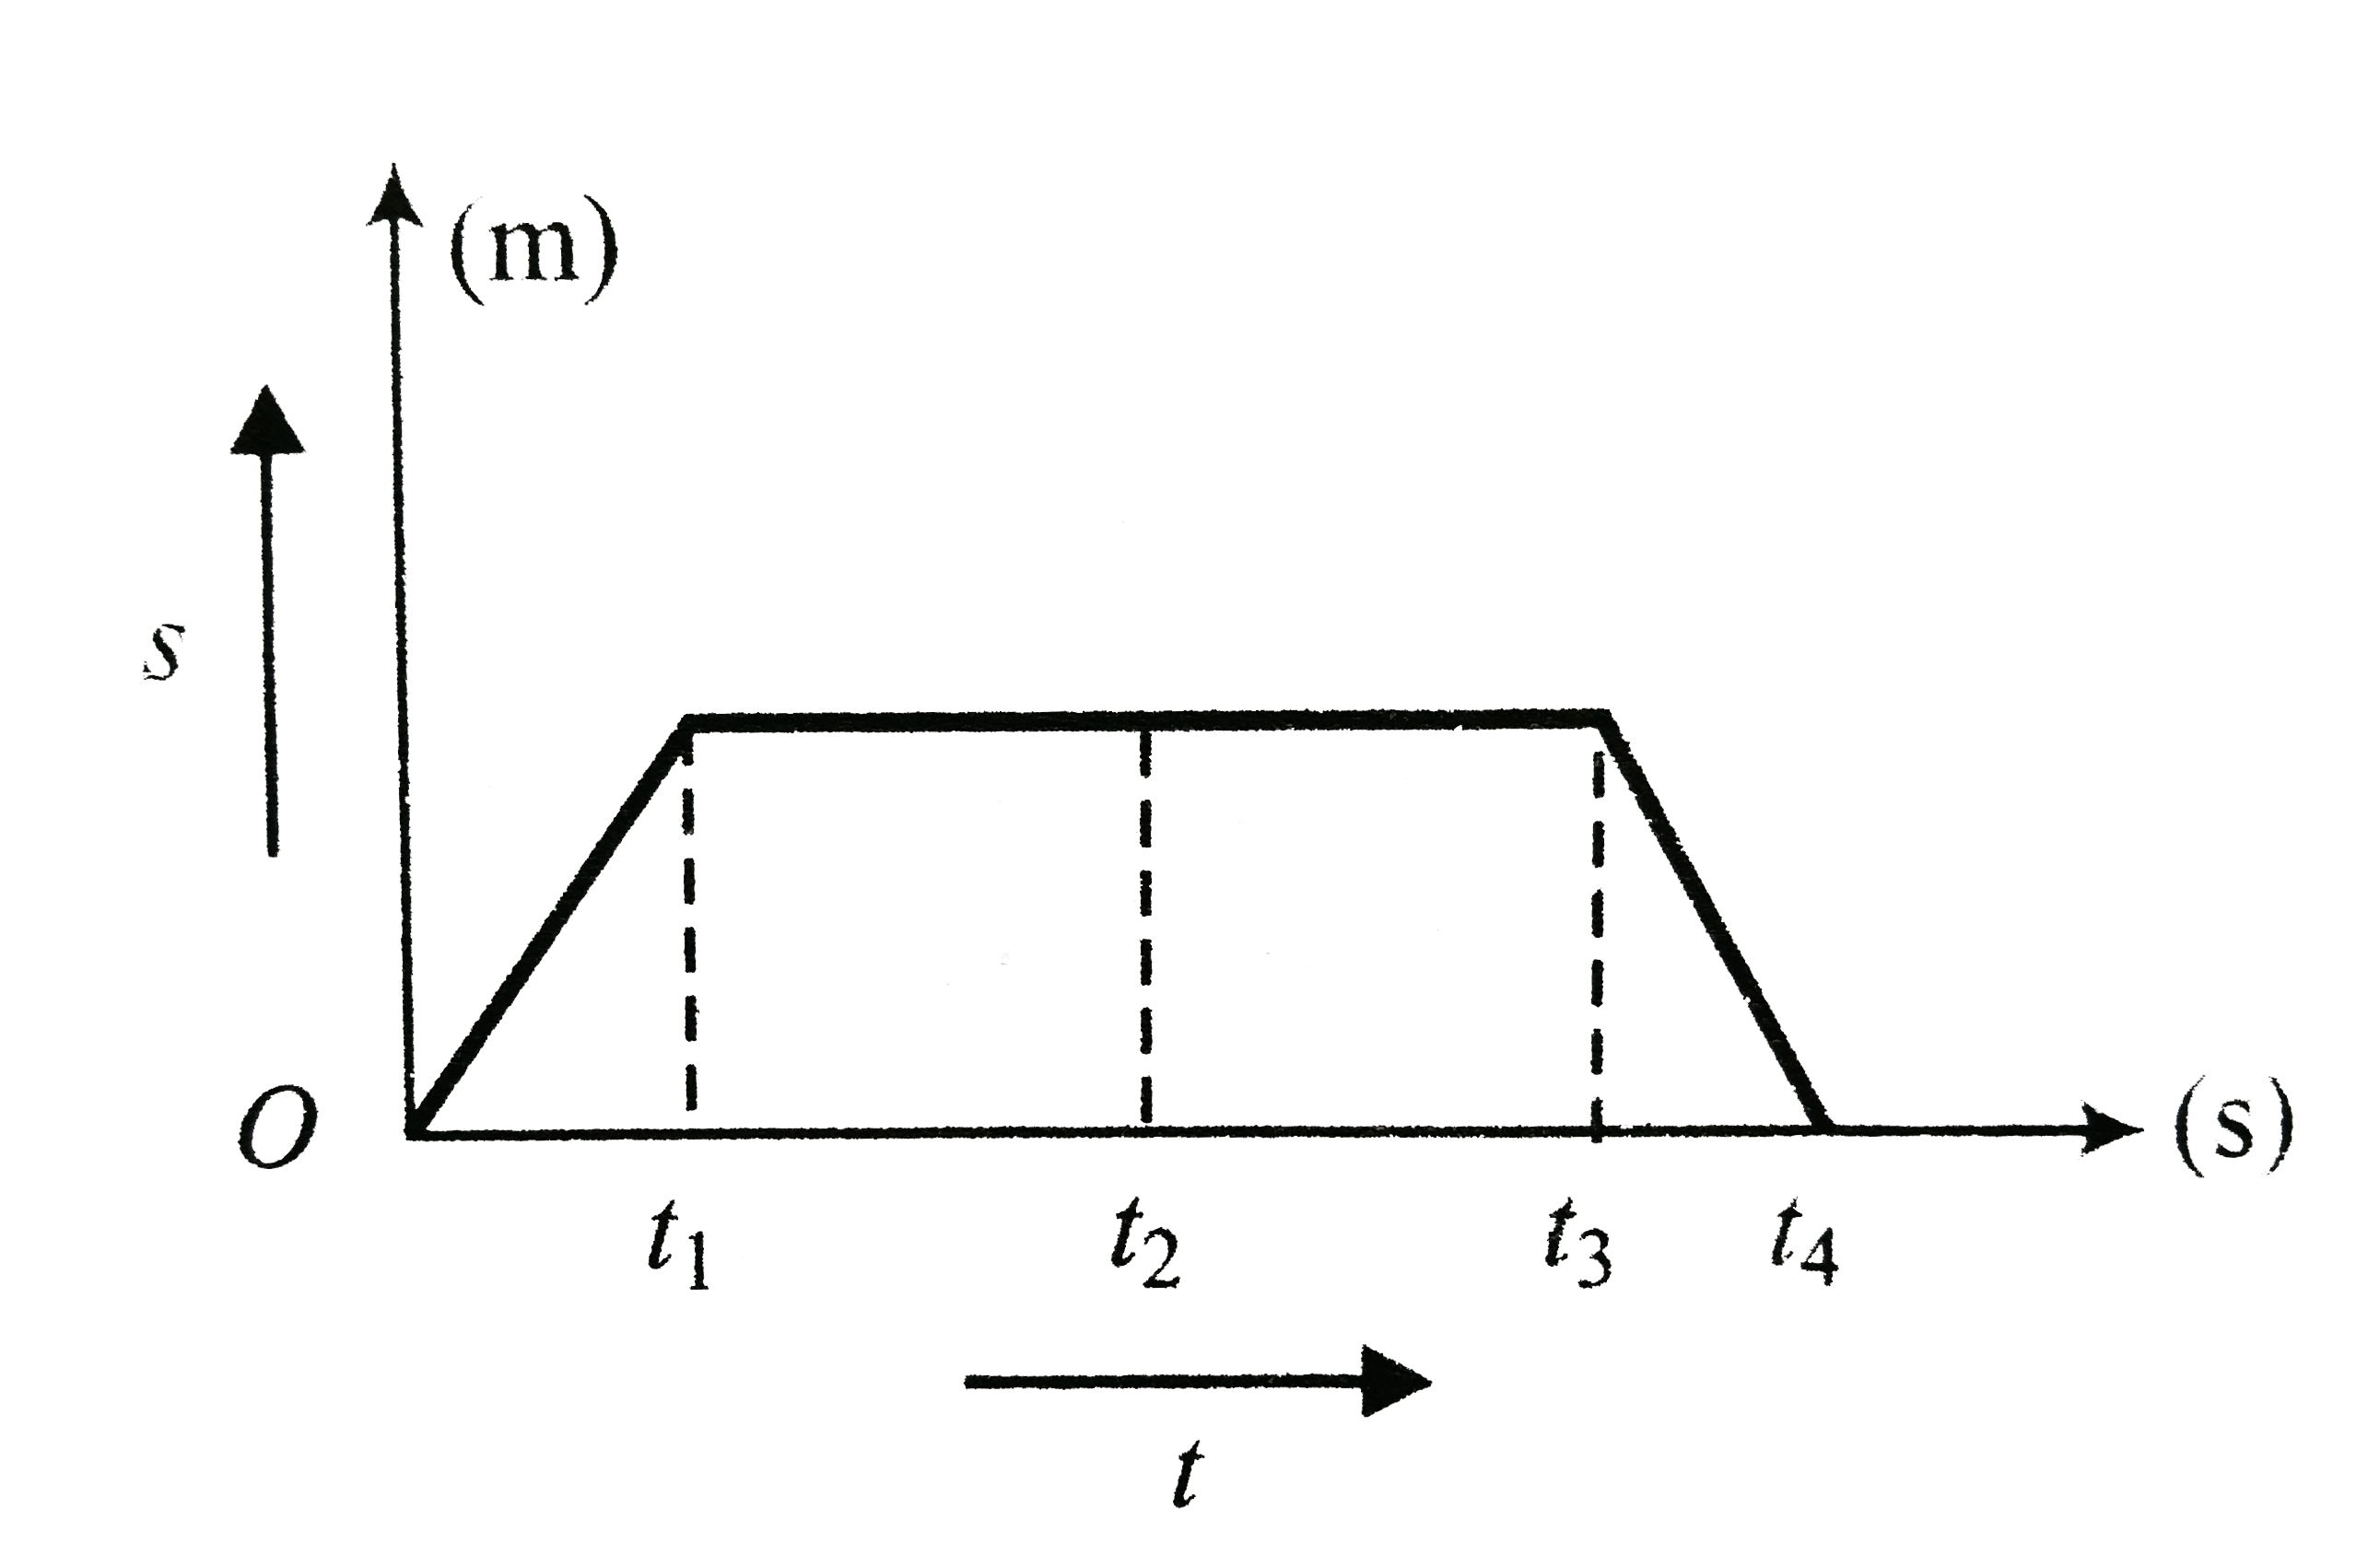
The displacement-time graph of a body is shown in.
 .
.
The velocity-time graph of the motion of the body will be .A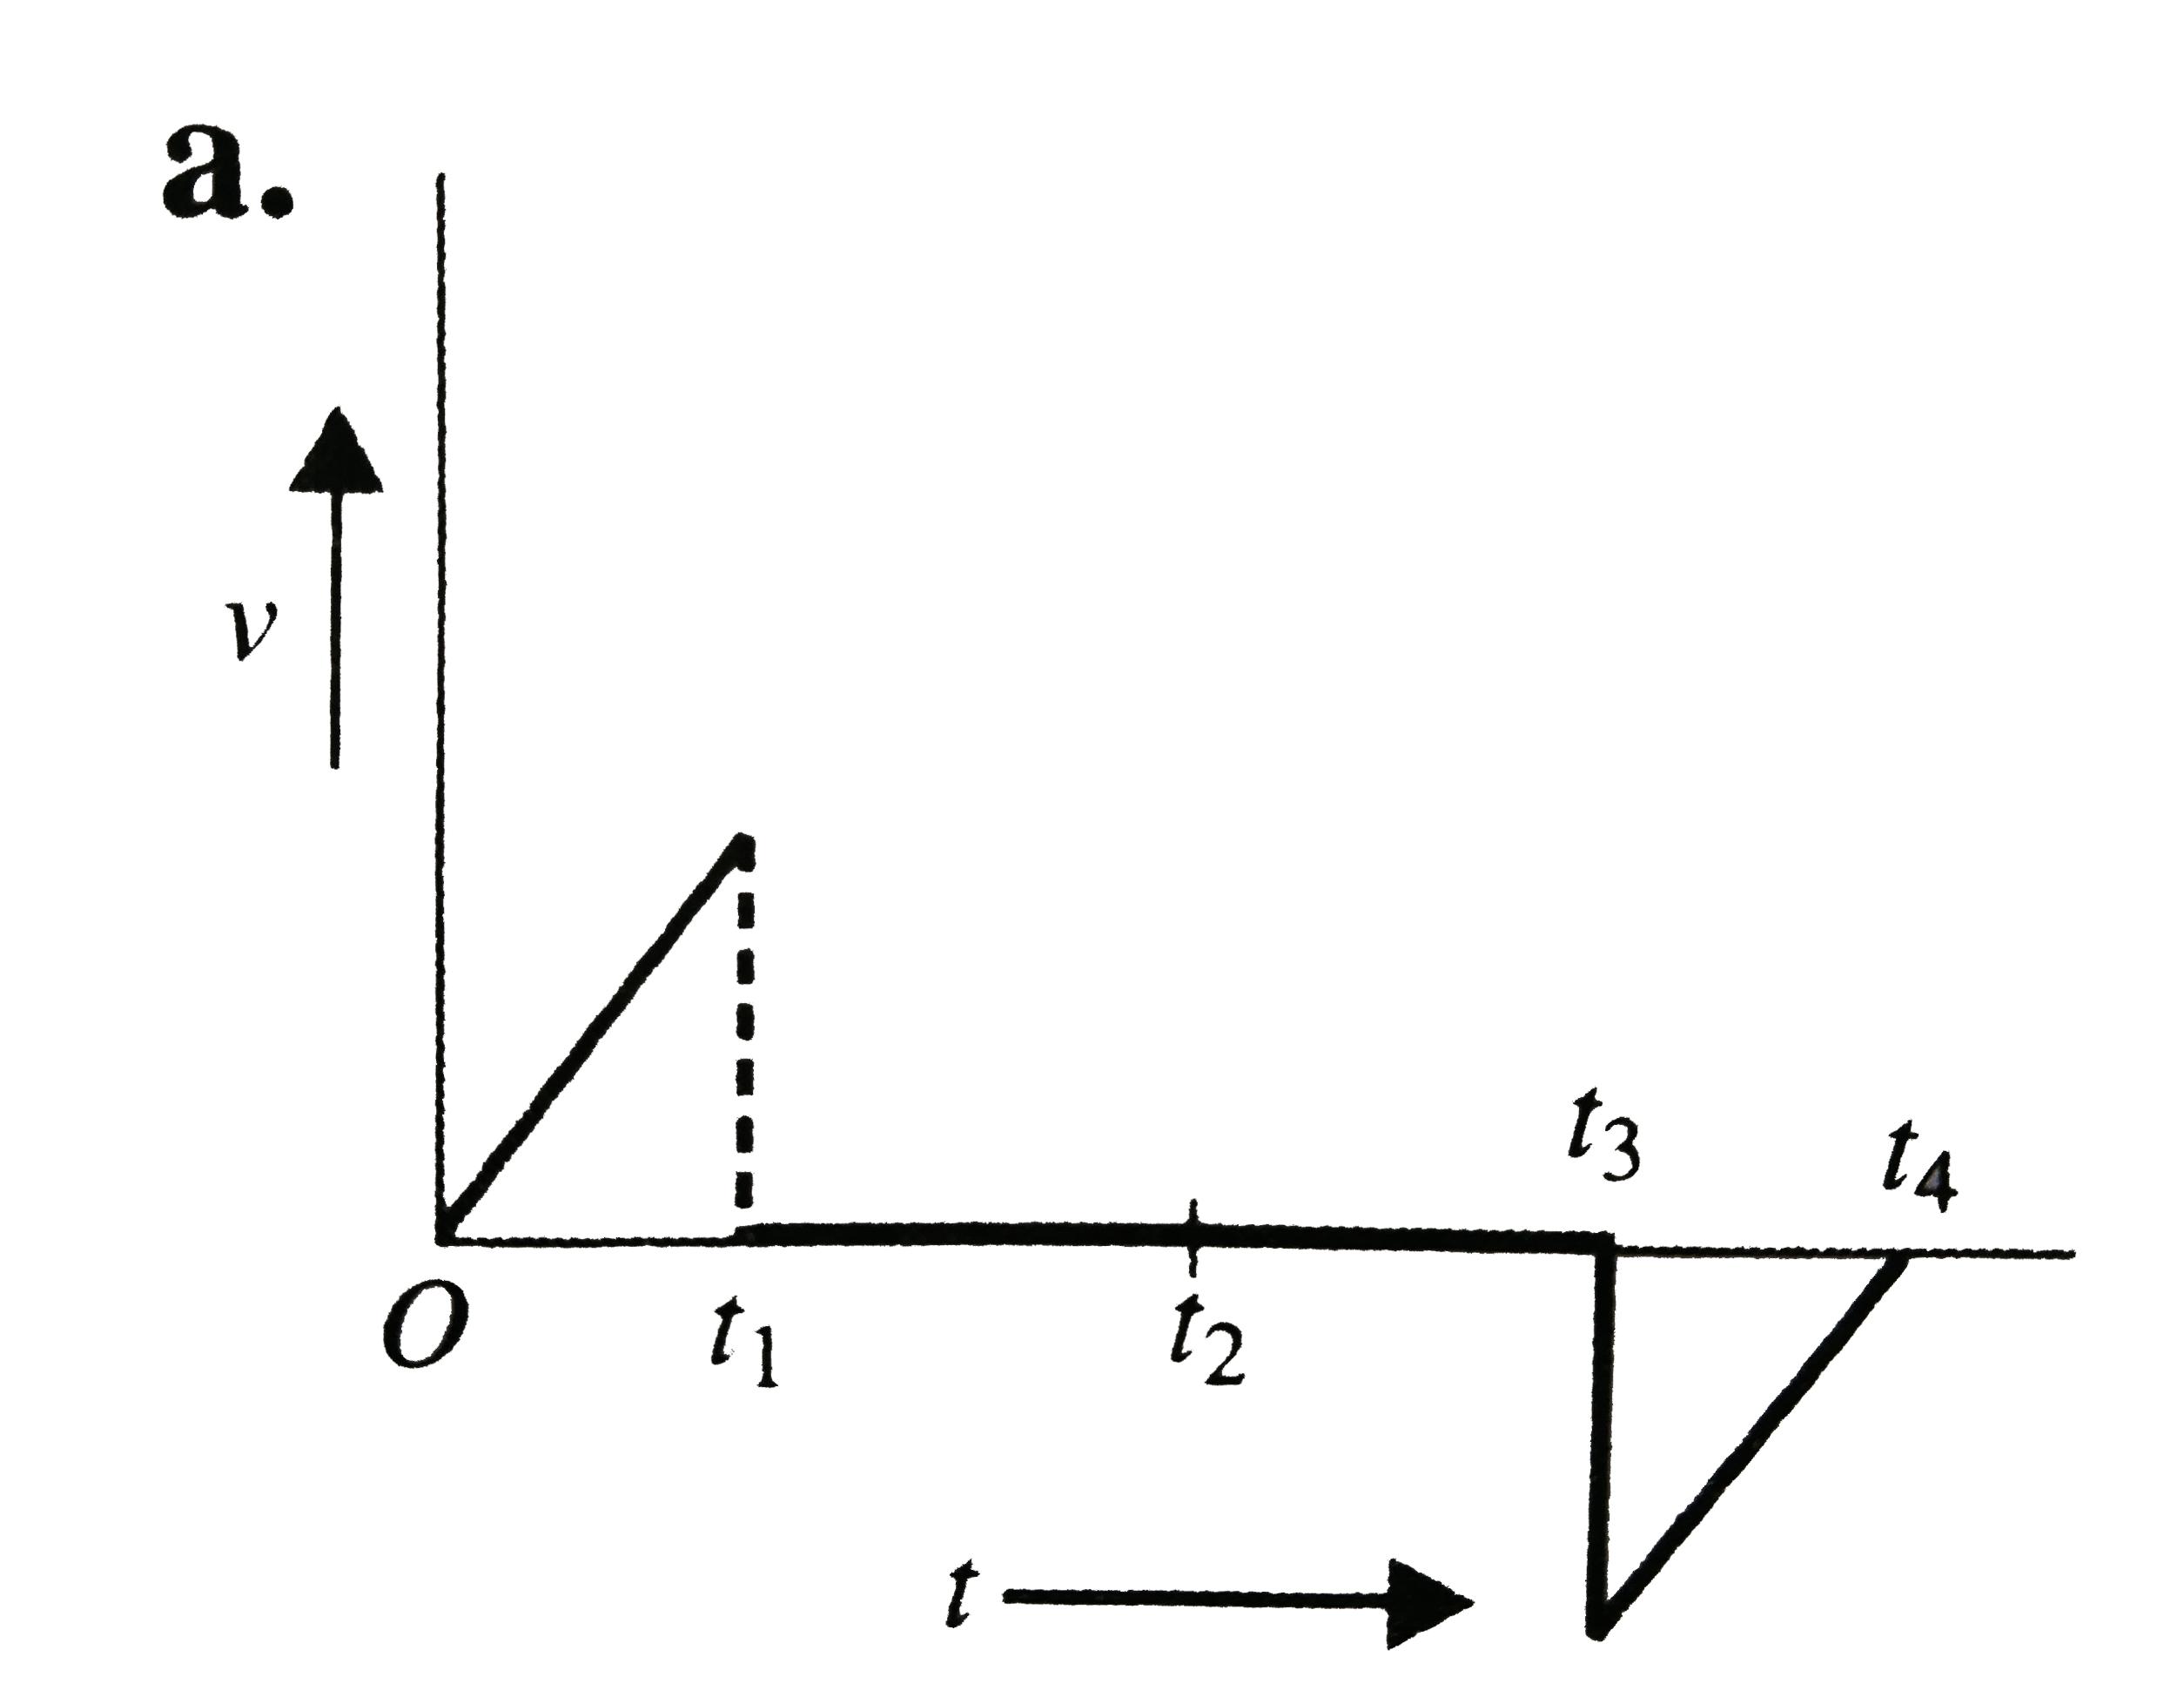 .B
.B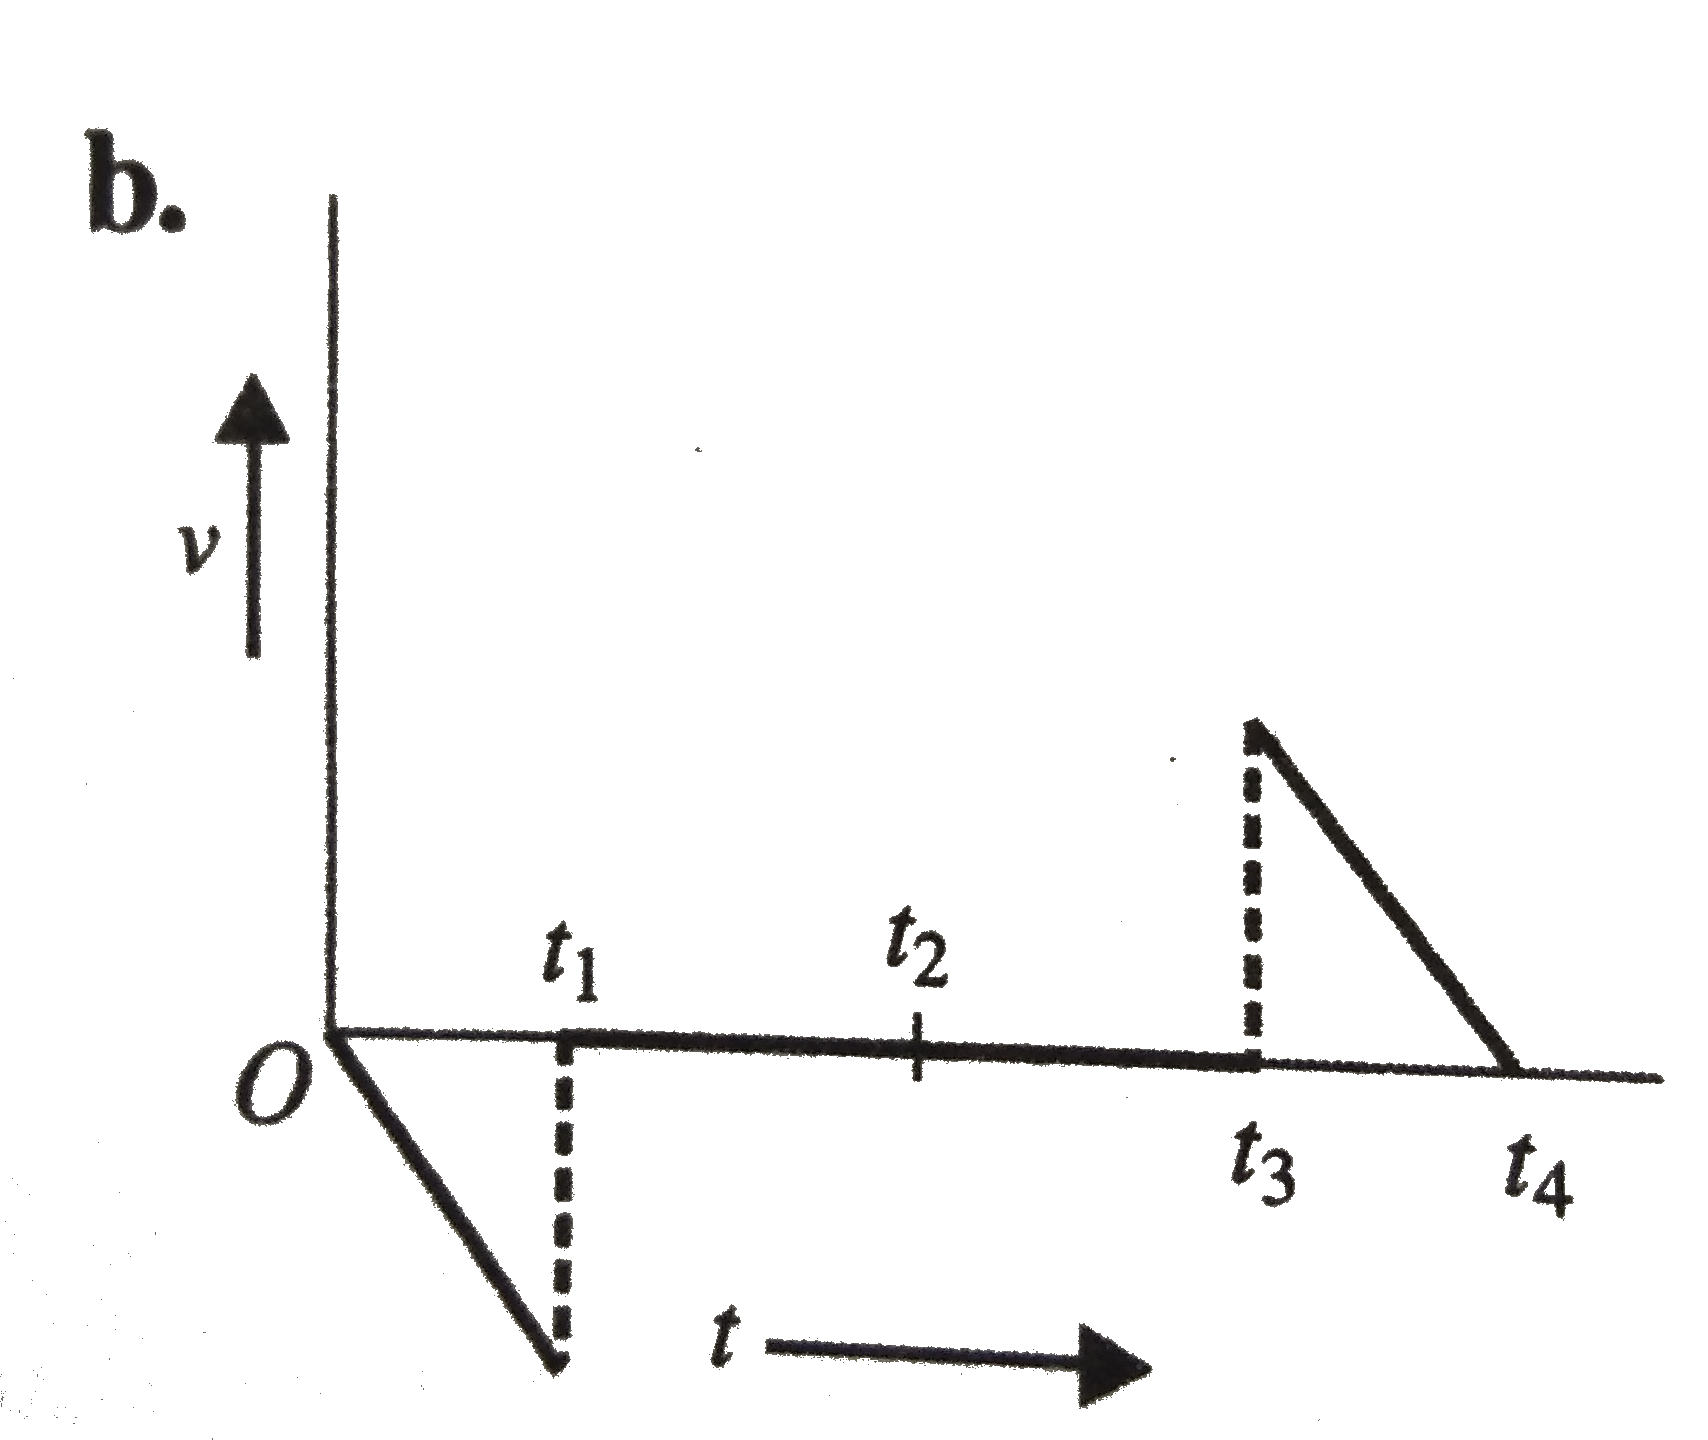 .C
.C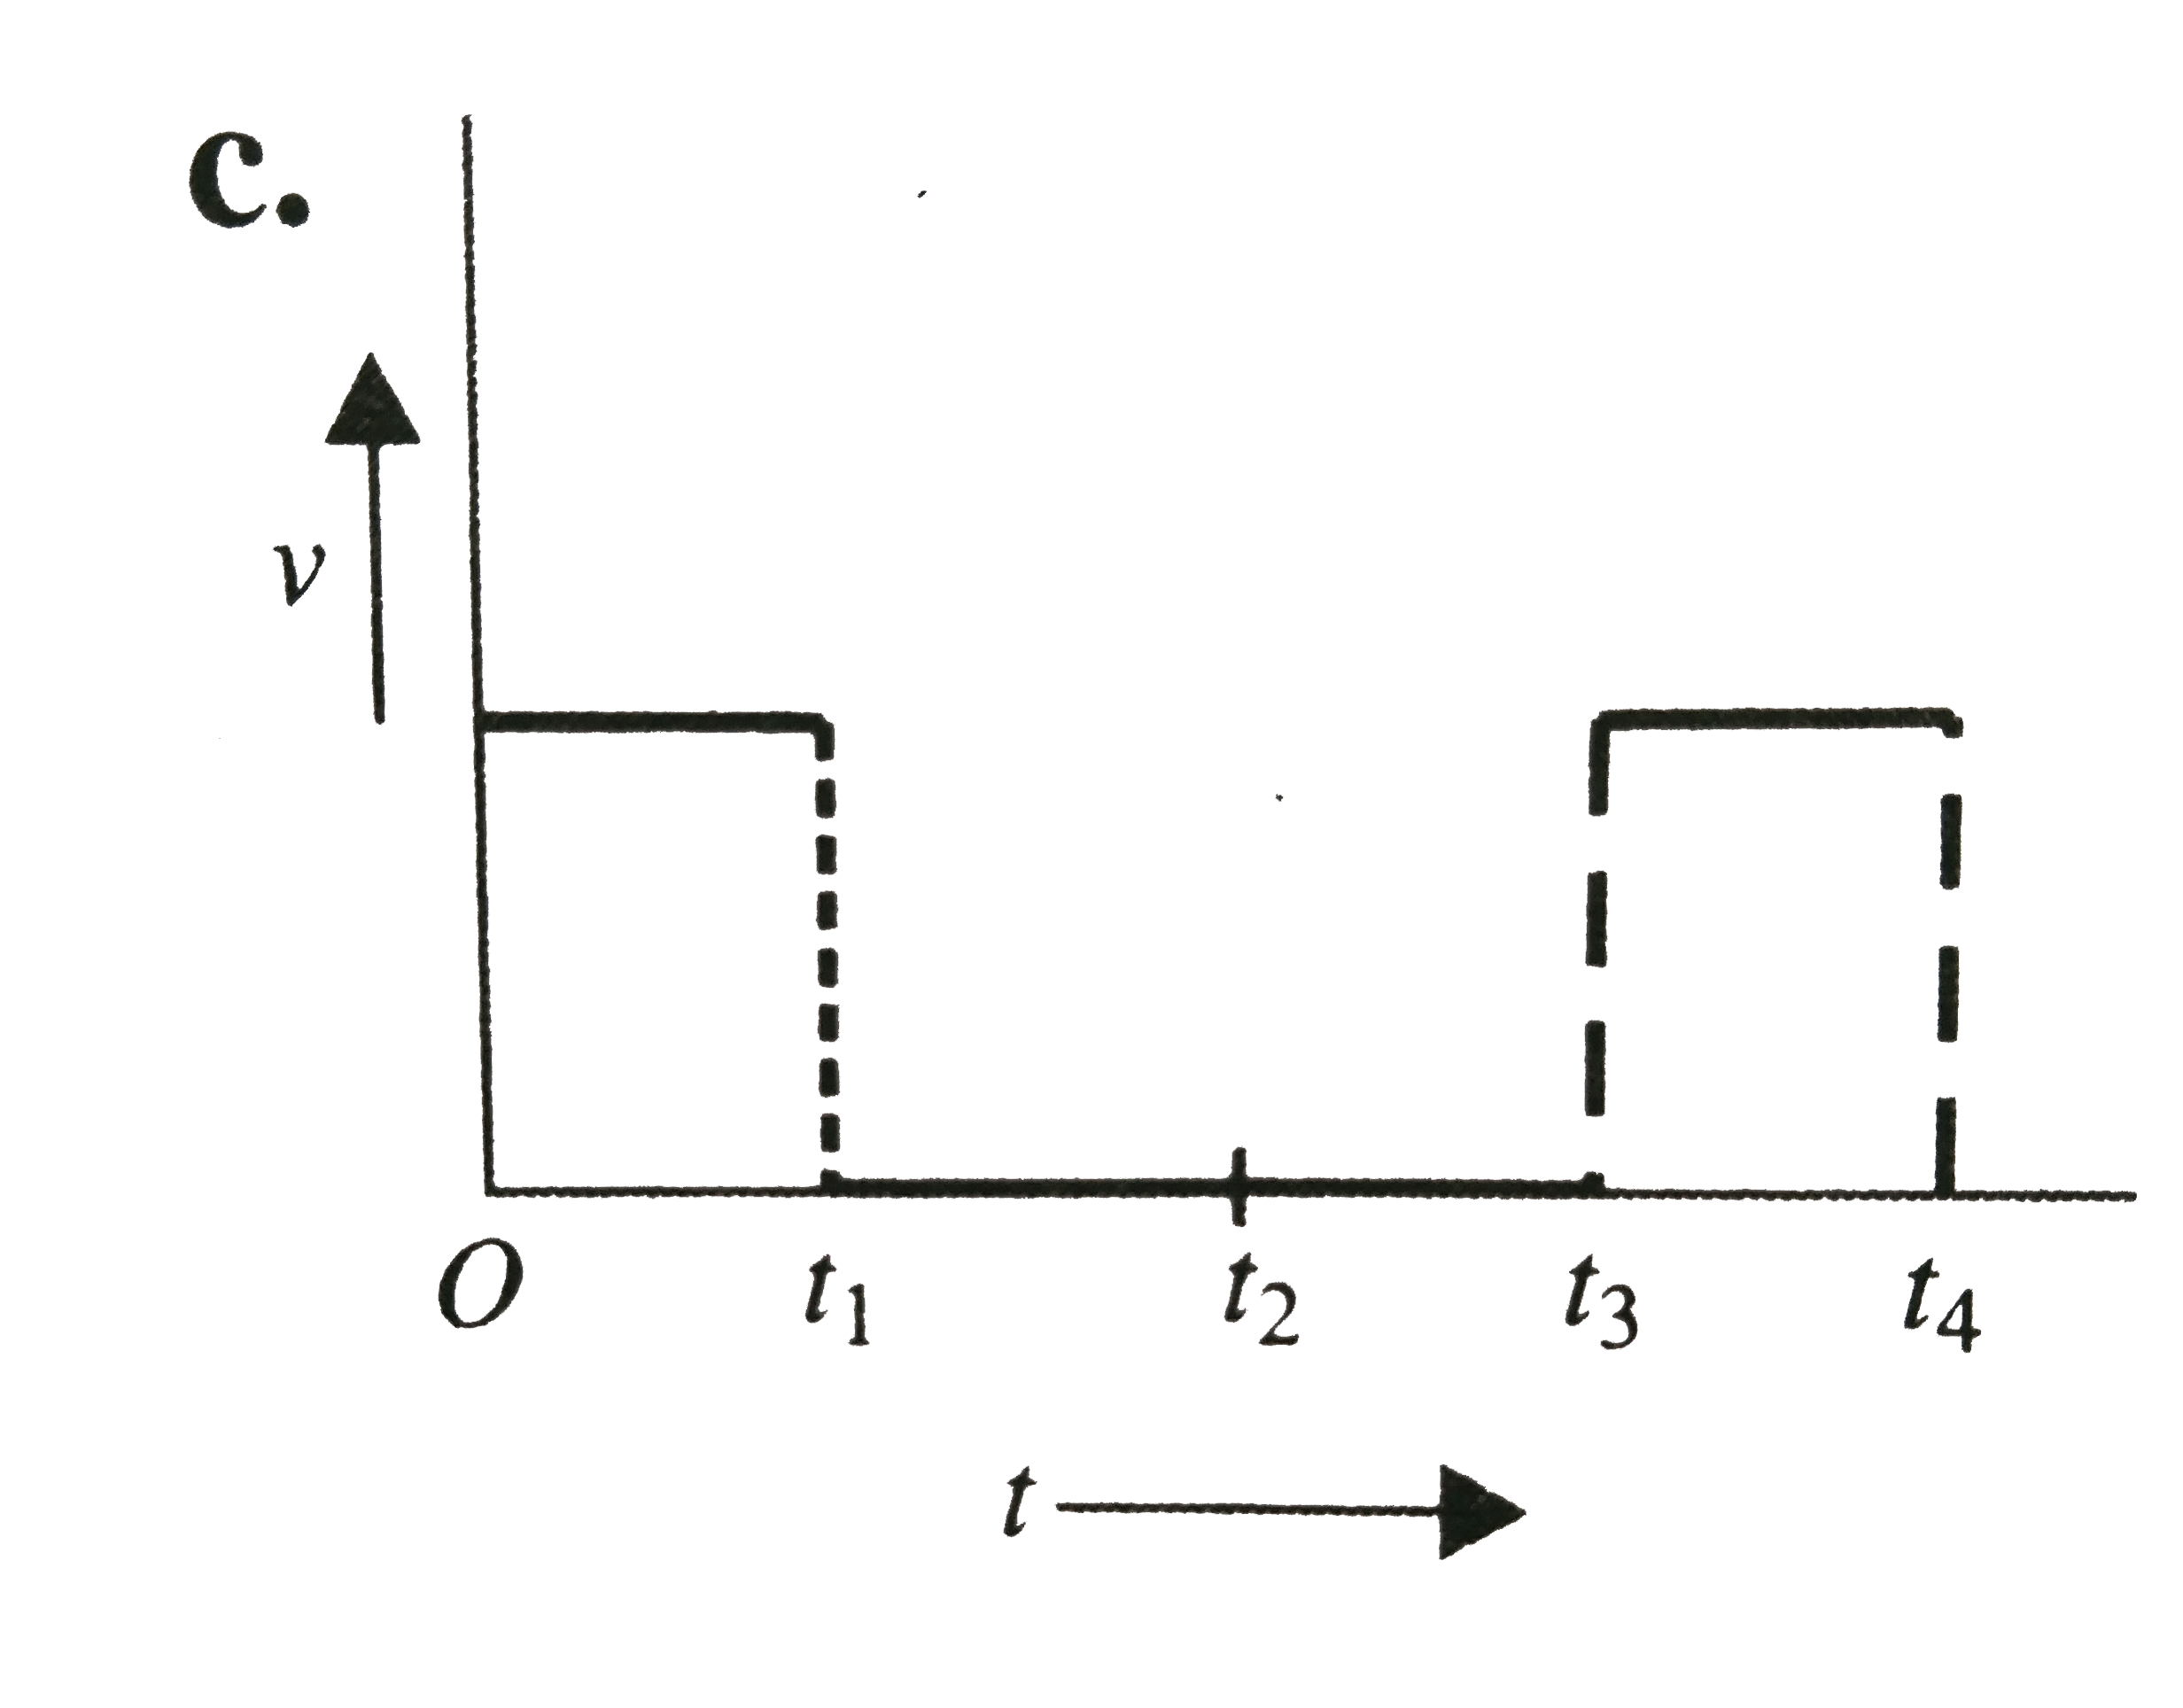 .D
.D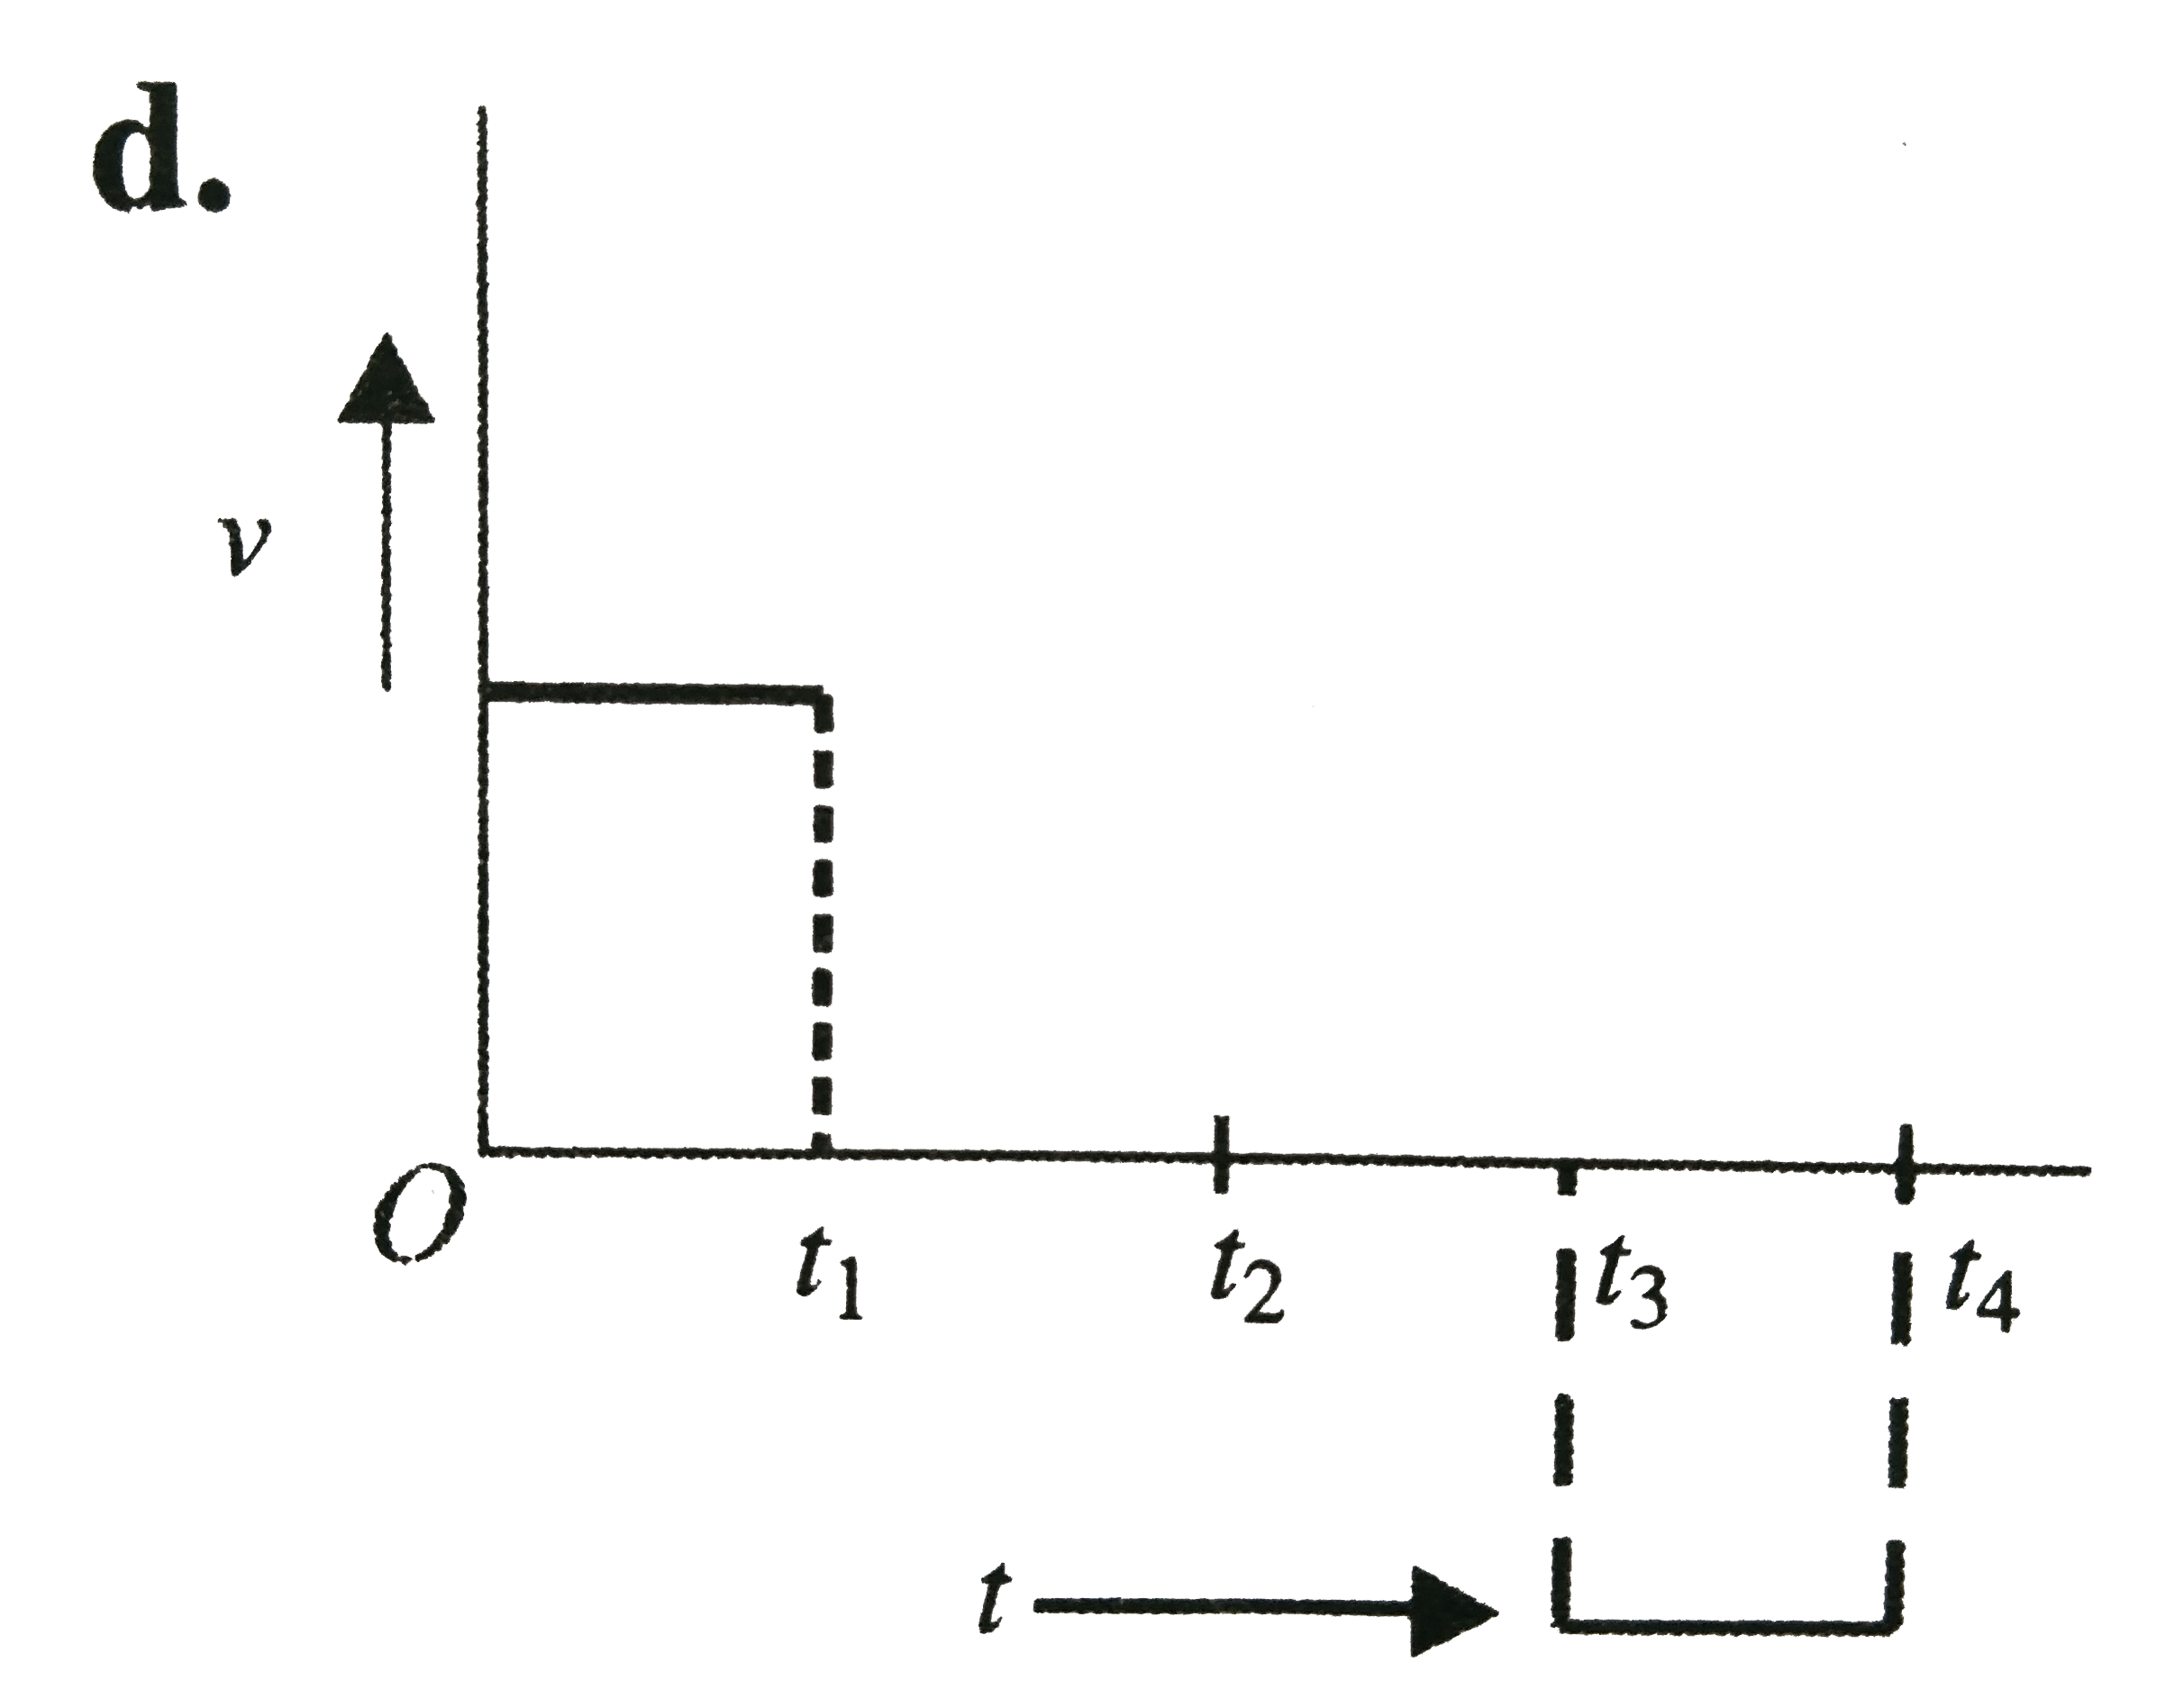 .
.The graph of displacement v/s time is given below. Its corresponding velocity-time graph will be :
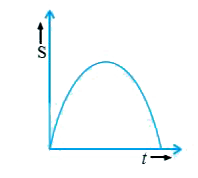 A
A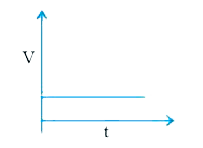 B
B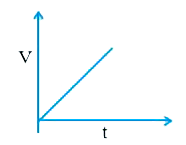 C
C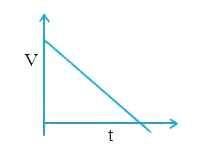 D
D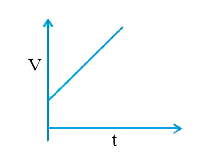
Displacement-time graph is shown in the figure. Displacement
The corresponding distance-time graph is
View SolutionAssertion: The displacement of a body is vector sum of the area under velocity-time graph.
Reason: Displacement is a vector quantity.
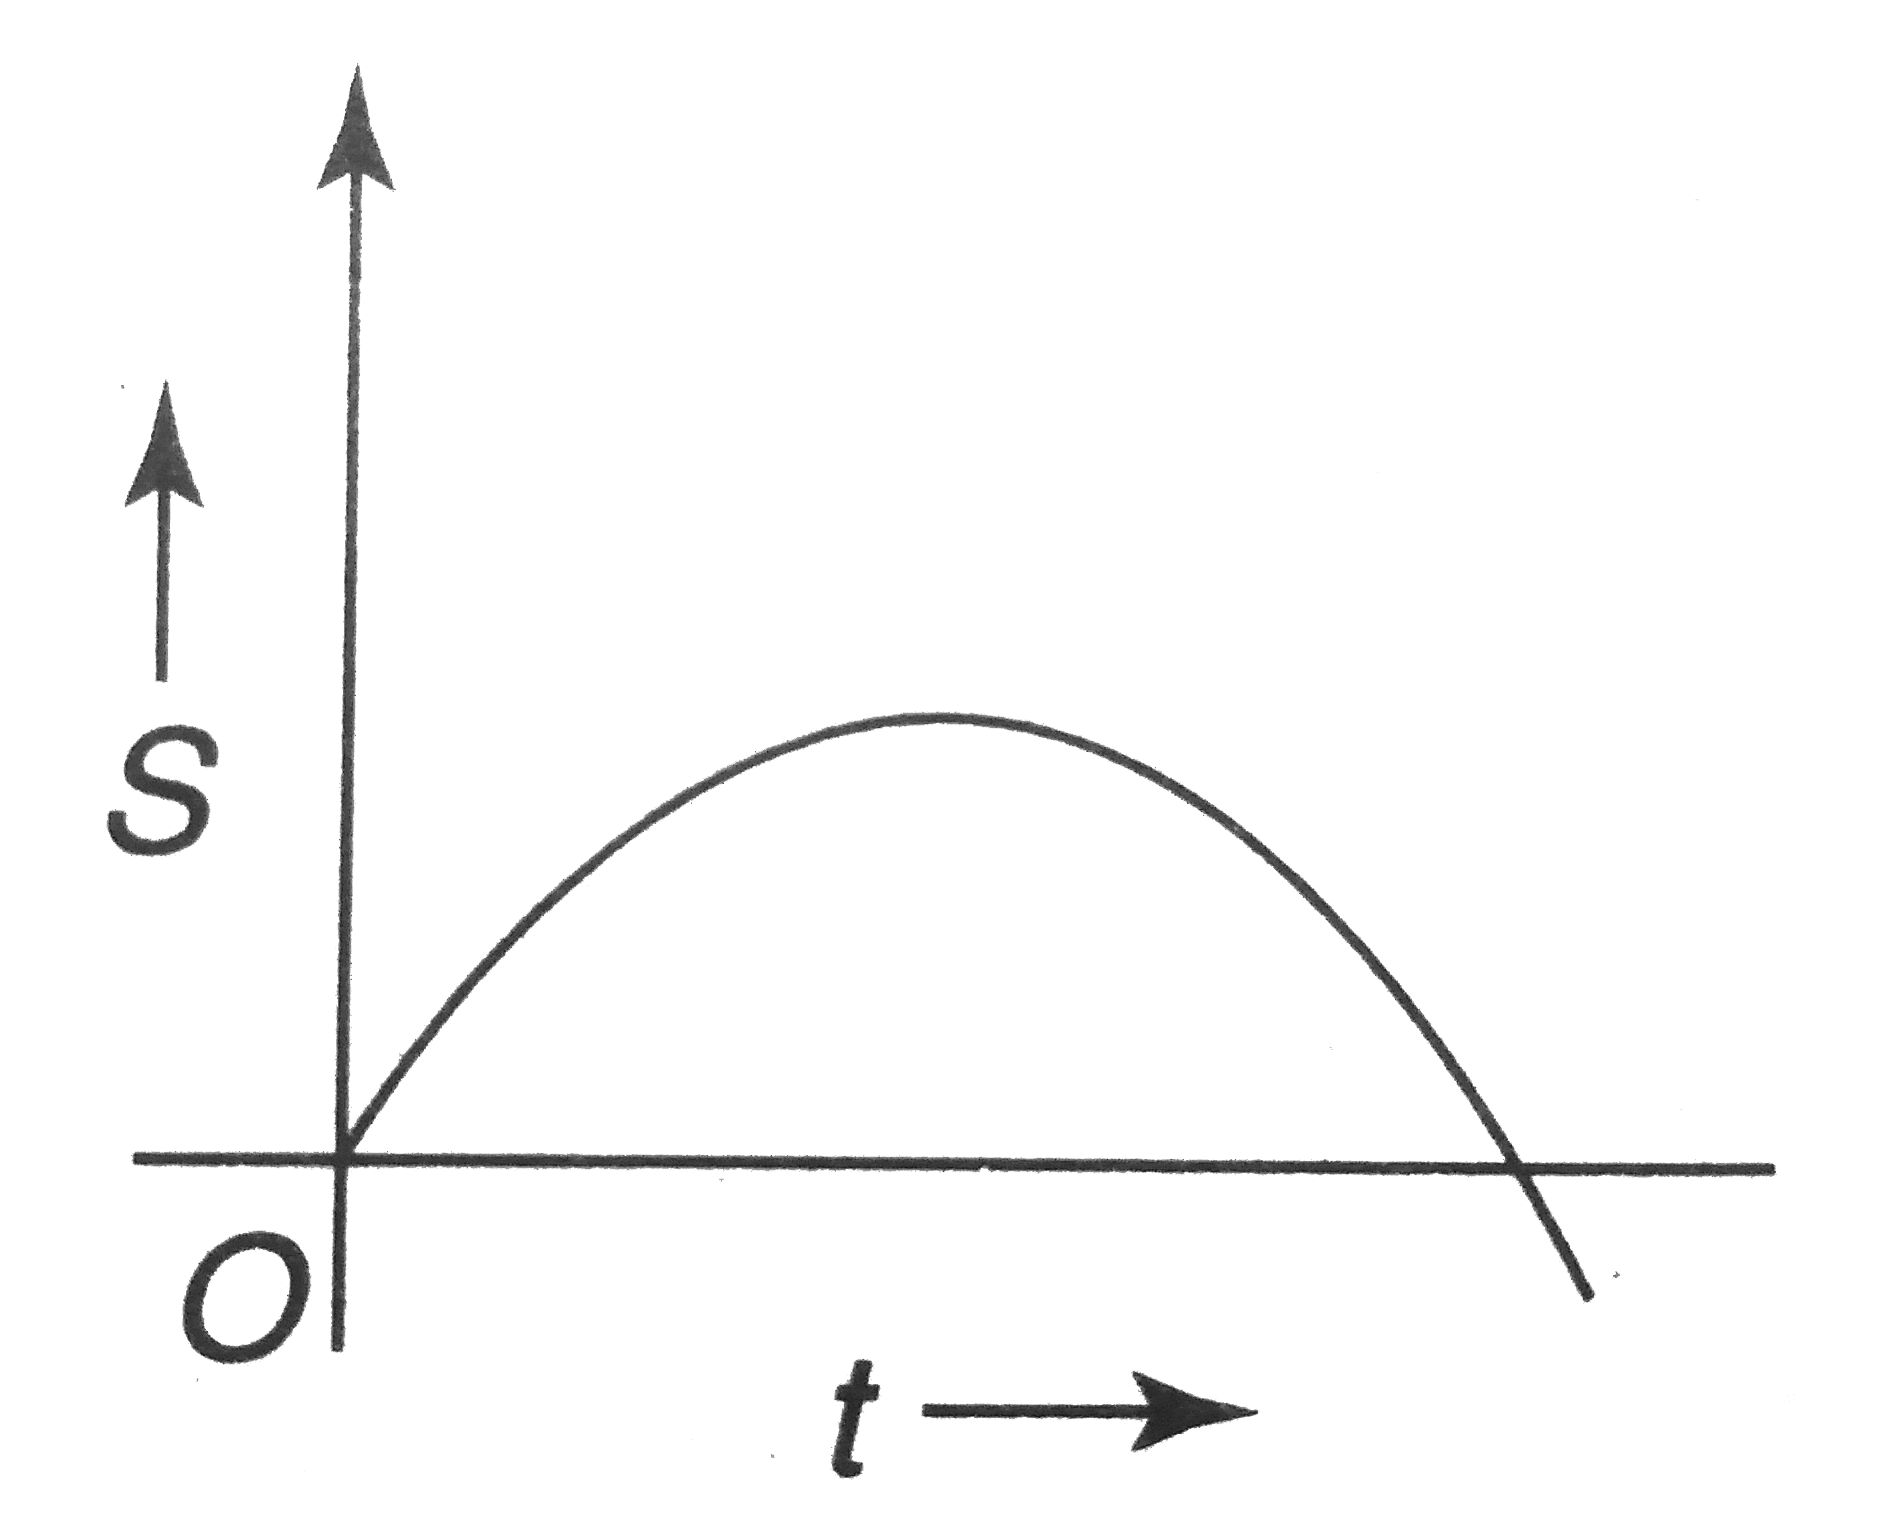
View SolutionThe graph of displacement versus time is shown. Its corresponding velocity-time graph will be.
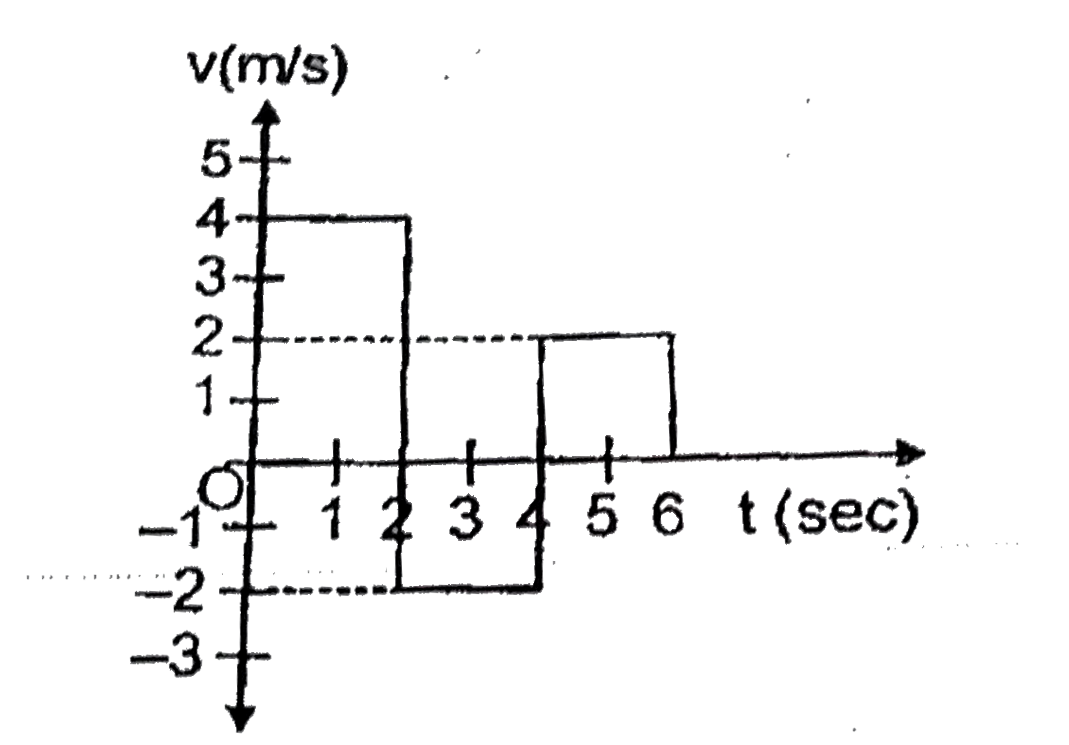
View SolutionThe velocity-time graph of a body moving in a straight line is shown in the figure.
View SolutionDisplacement-time graph of a particle executing SHM is as shown
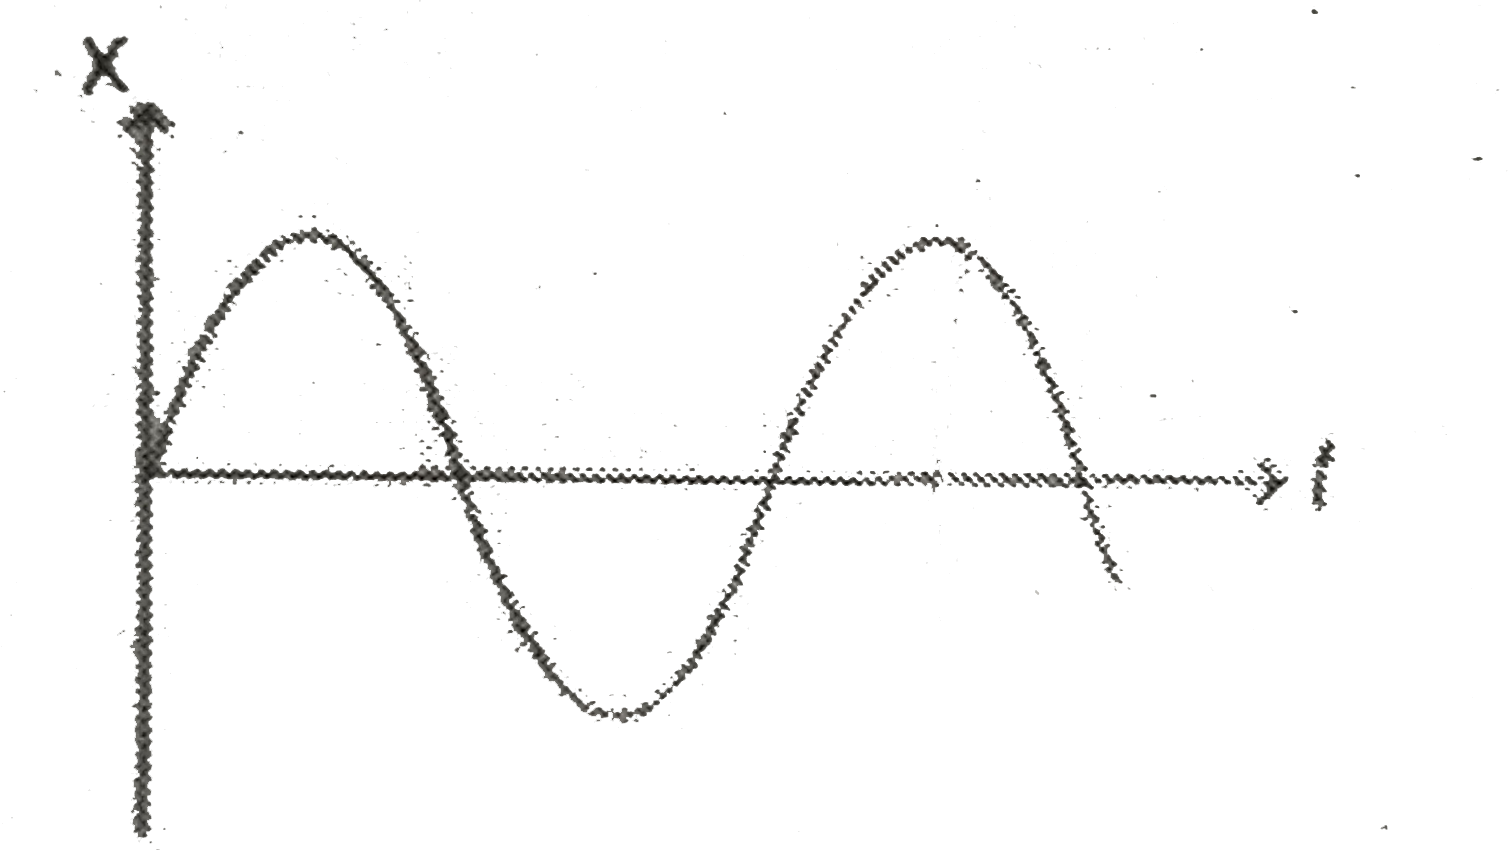
The corresponding force-time graph of the particle can be
View Solution
