Displacement time graph of particle performing SHM is as shown in figure. Assume that mean position is at x=0 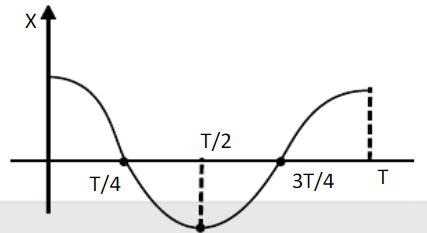
No force acting on particle at T4
speed of particle is maximum at 3T/4
acceleration at T4 is maximum
KE & PE is equal at t=T8
The correct Answer is:A, B, D
Step by step video, text & image solution for Displacement time graph of particle performing SHM is as shown in figure. Assume that mean position is at x=0 by Physics experts to help you in doubts & scoring excellent marks in Class 12 exams.
Topper's Solved these Questions
Similar Questions
Knowledge Check
- Question 1 - Select One
The acceleration versus displacement graph of a particle performing SHM is shown in figure. The time period of oscillation of particle in second is
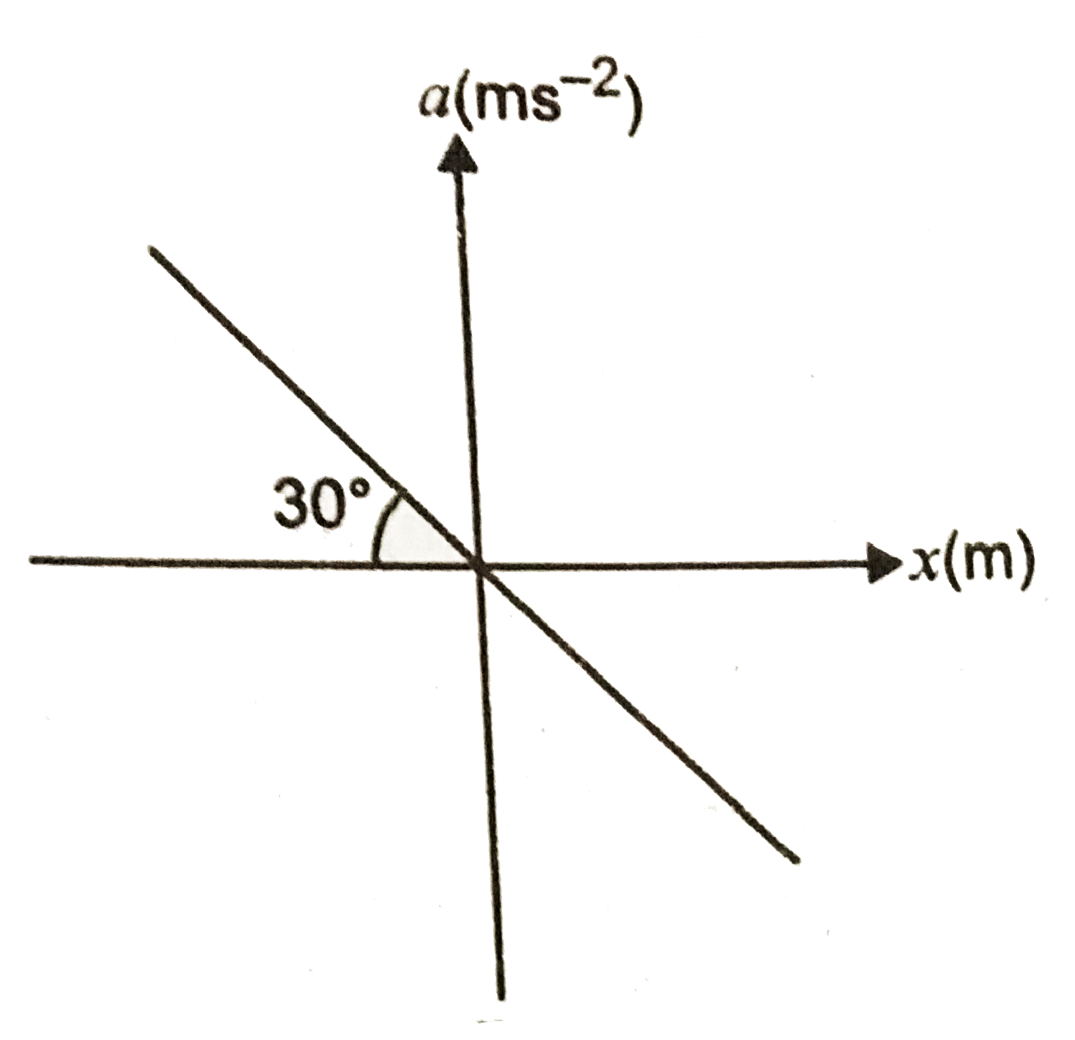 A2π×√2B2π×√3C2π×(2)1/4D2π×(3)1/4
 - Question 2 - Select One or More
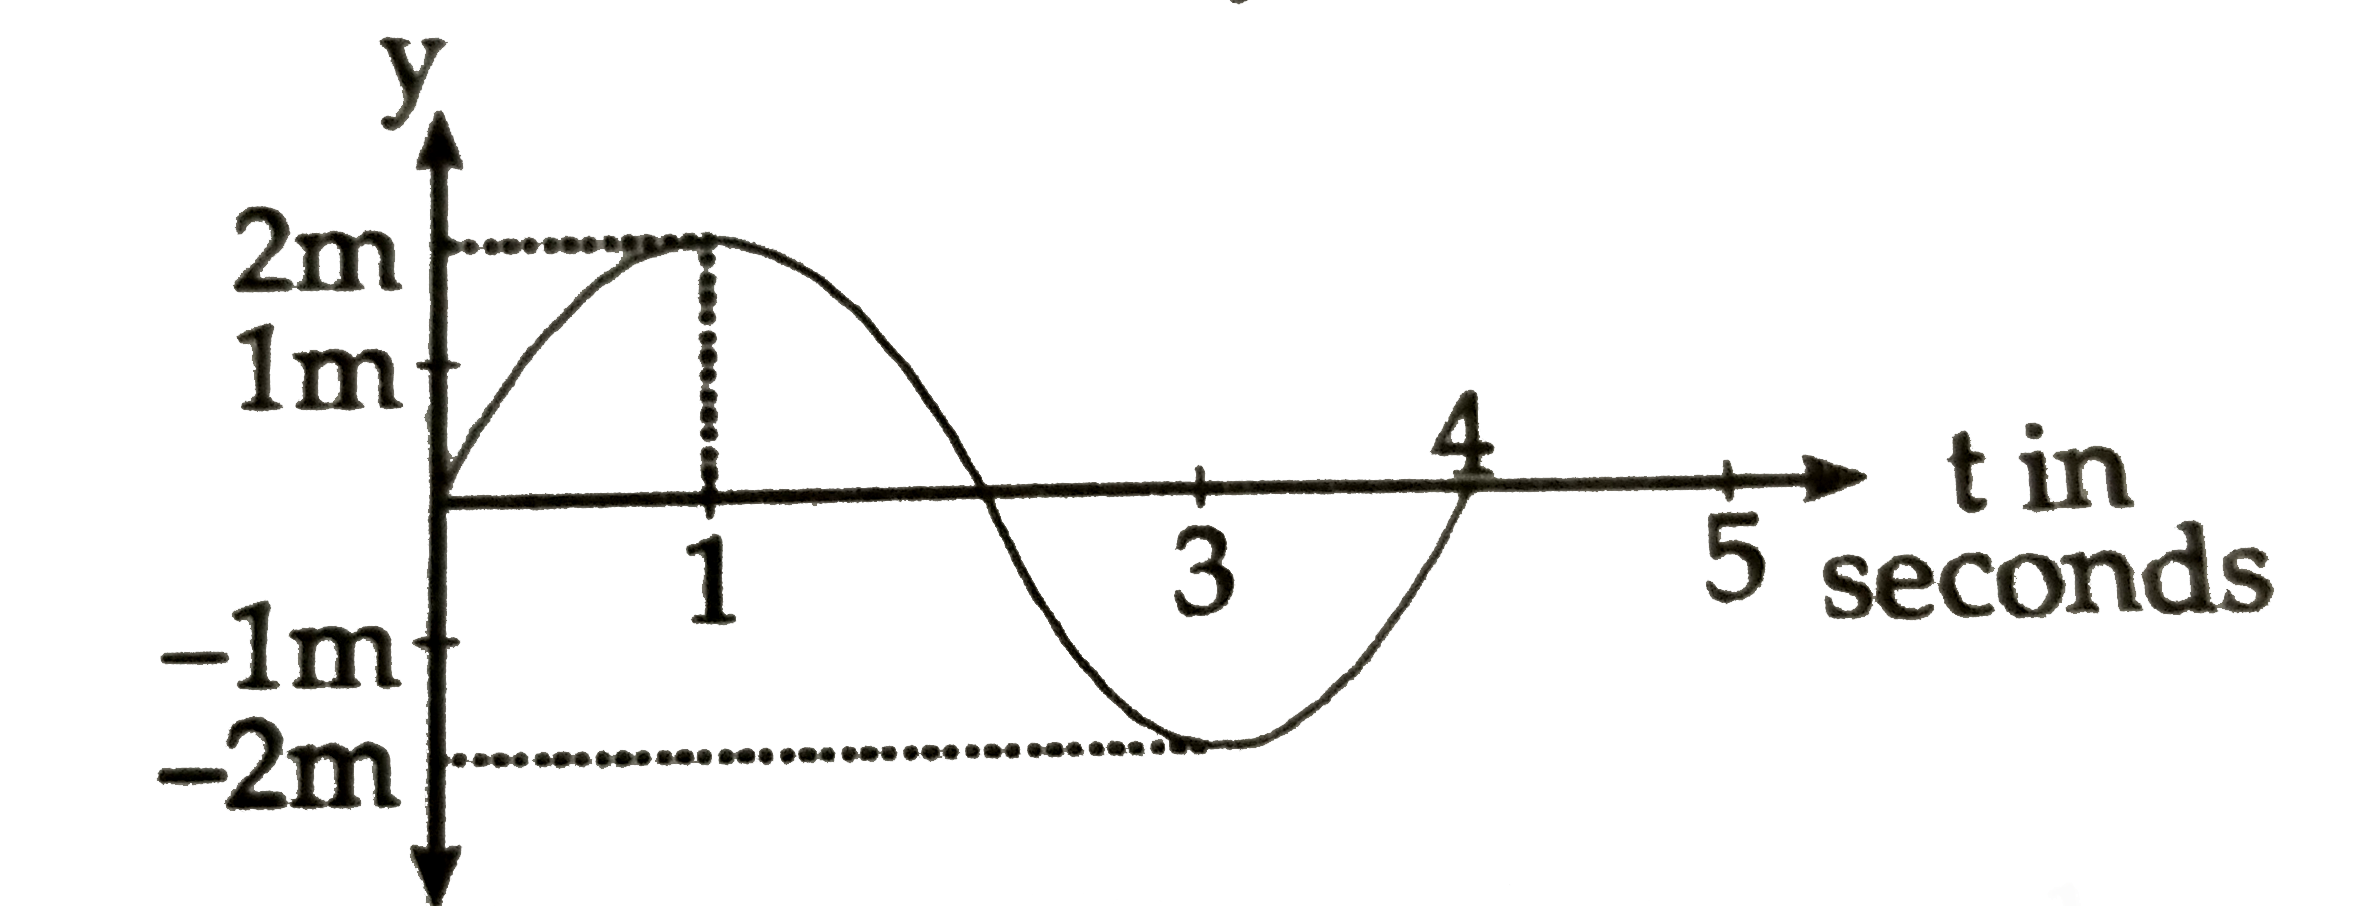
Displacement time graph of a particle moving in a straight line is a shown in figure.
 Ain region A acceleration is positiveBin region B acceleration is negativeCin region C acceleration is positiveDin region D acceleration is negative
 - Question 3 - Select One
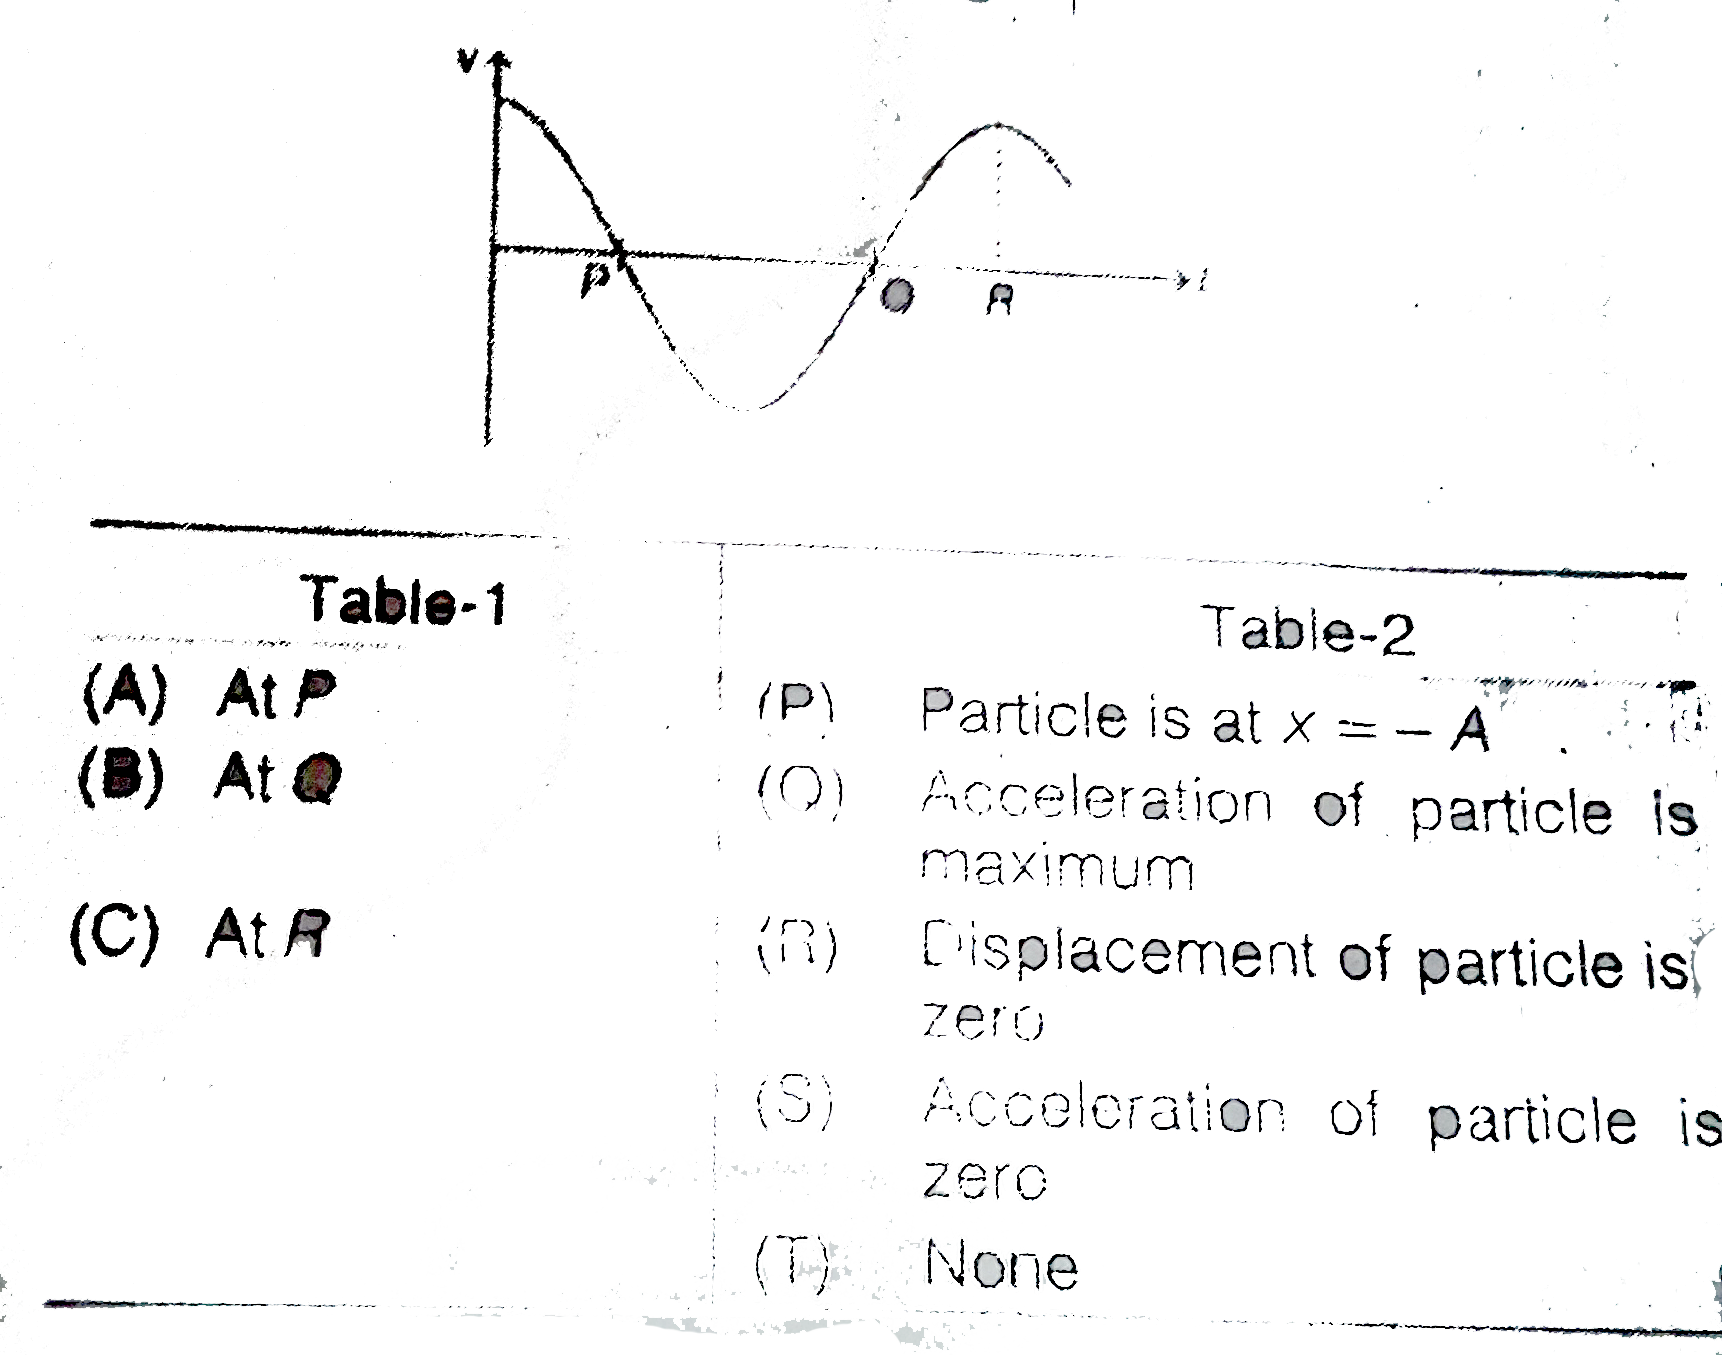
v−t graph of a particle in SHM is as shown is figure. Choose the wrong option.
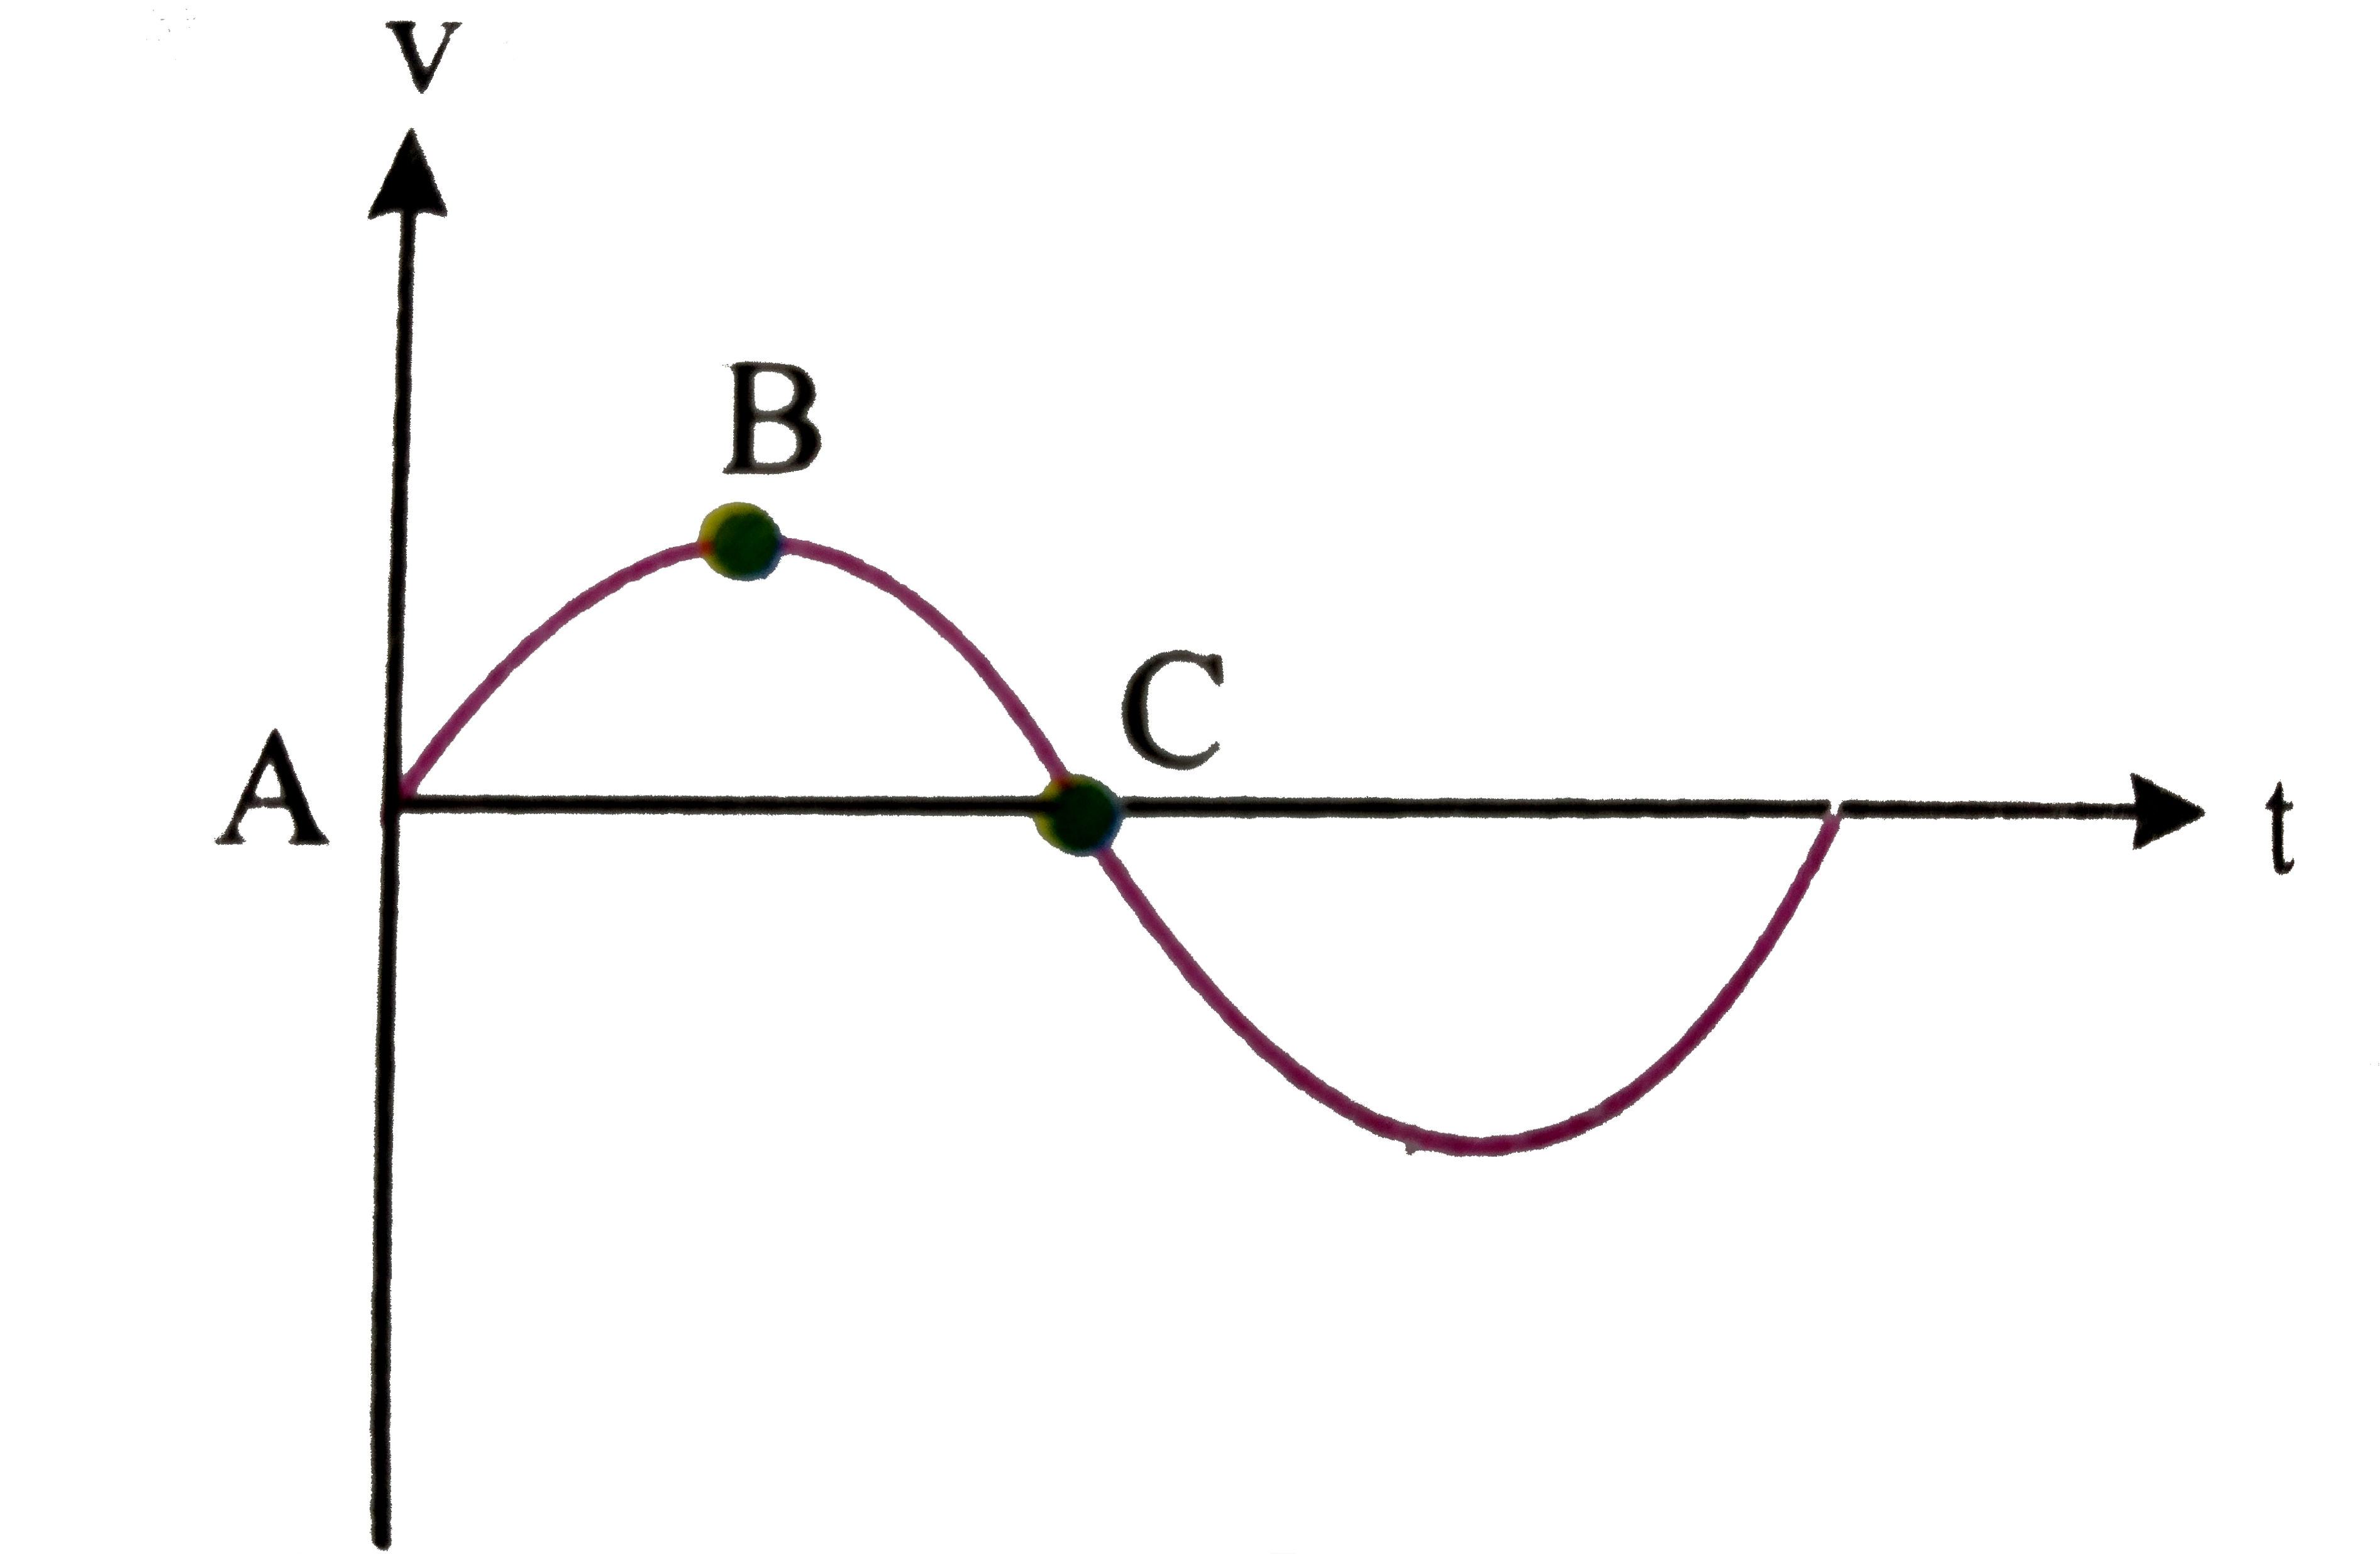 Aat A particle is at mean position and moving towards position directionBat Bacceleration of particle is zeroCat C acceleration of particle is maximum and in position directionDnone of the above
The displacement-time graph for a particle executing SHM is as shown in figure.
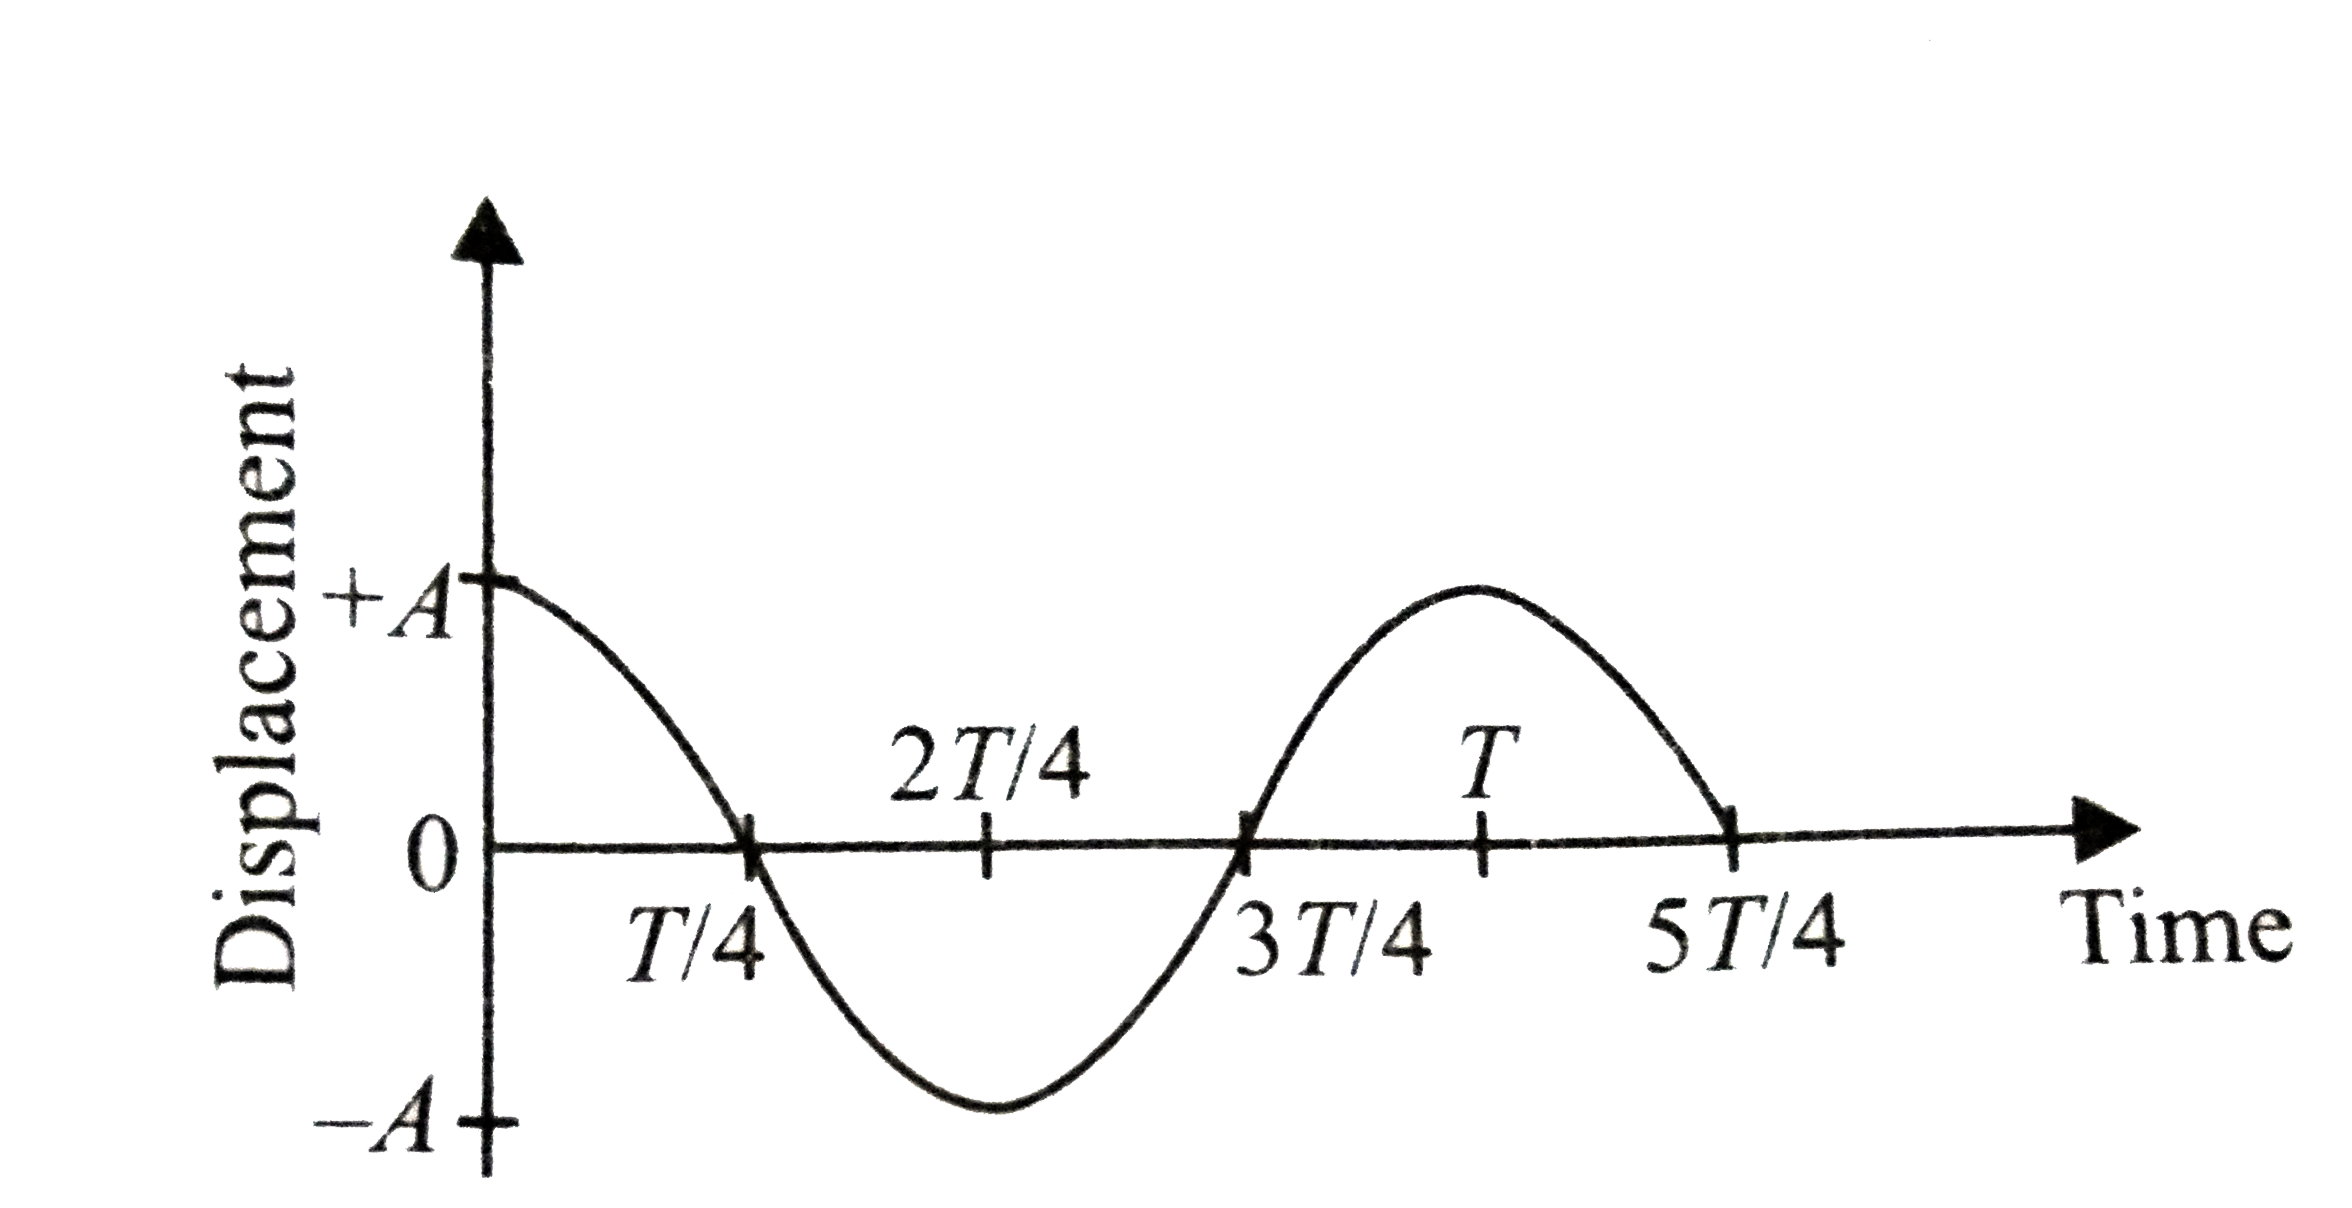
Which of the following statements is correct?View SolutionThe displacement time graph of a particle executing SHM is as shown in the figure
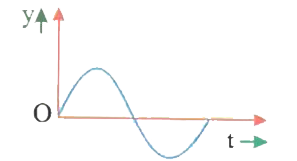
The corresponding force-time graph of the particle isView SolutionThe displacement time graph of a particle executing S.H.M. is shown in figure. Which of the following statement is / are true ?
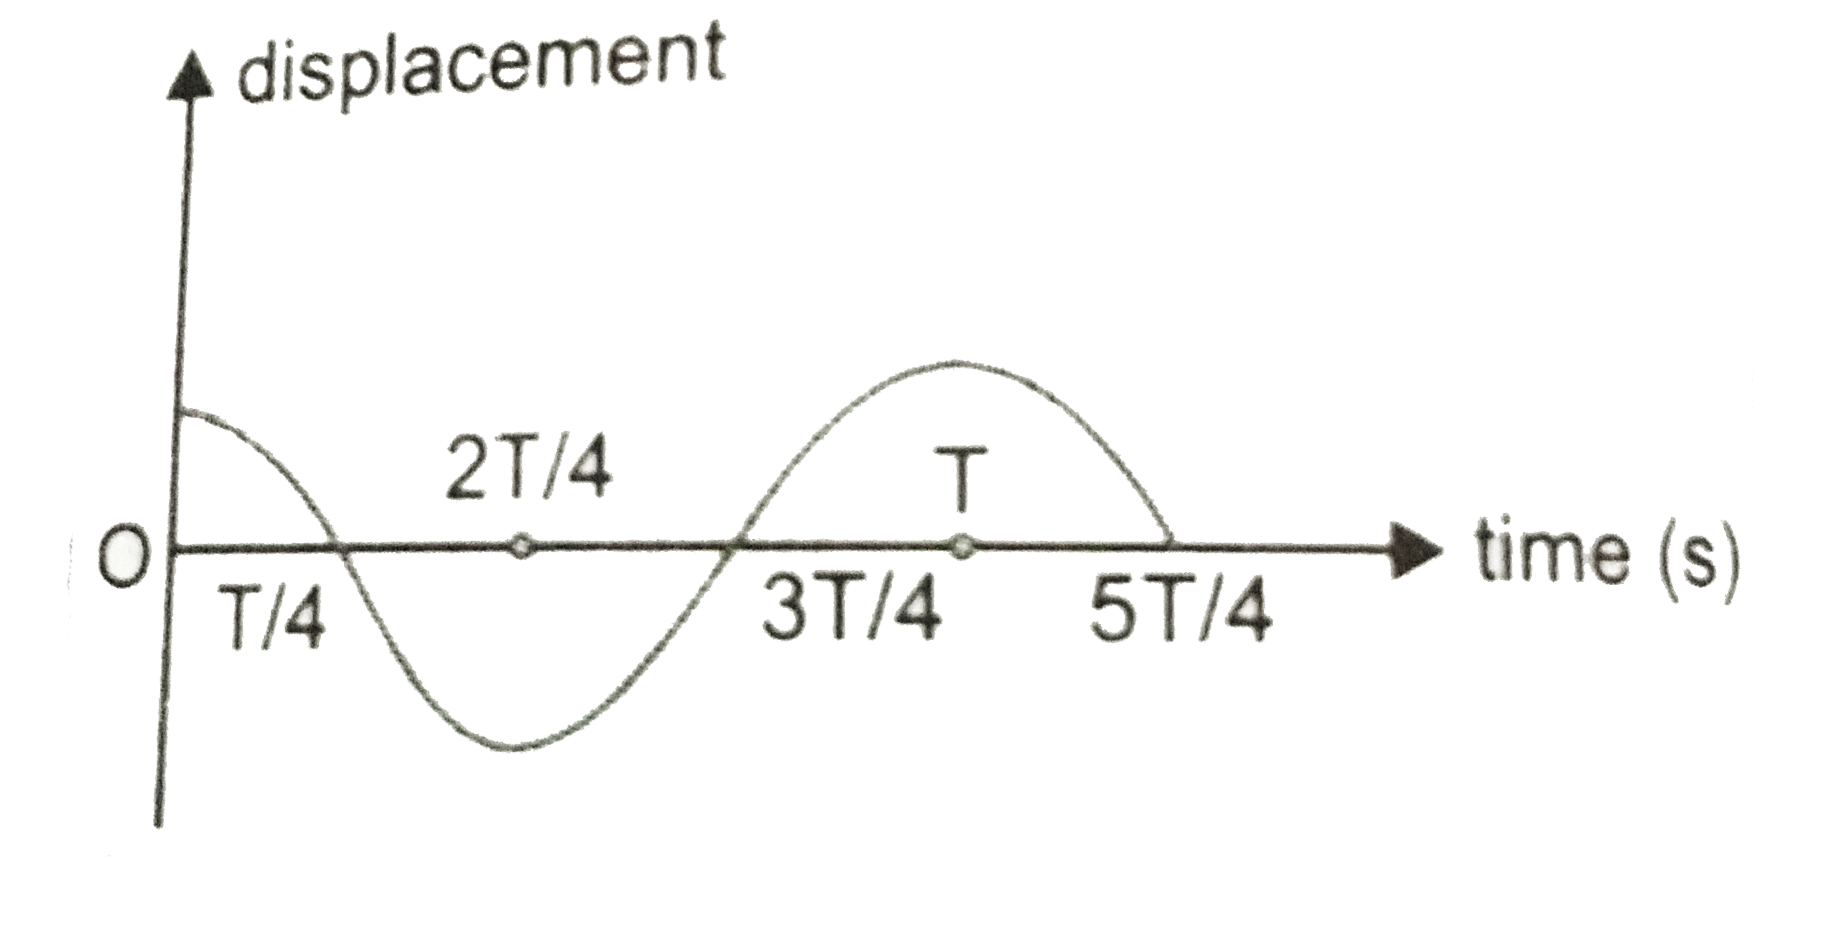 View Solution
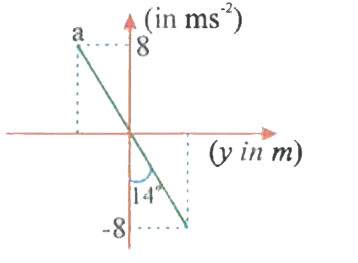
The acceleration-displacement graph of a particle executing SHM is as shown in the figure. The velocity of the particle at y = 0 is (take tan14∘ = 0.25)
 View Solution
The displacement time graph of a particle executing S.H.M. is as shown in the figure
The corresponding force-time graph of the particle is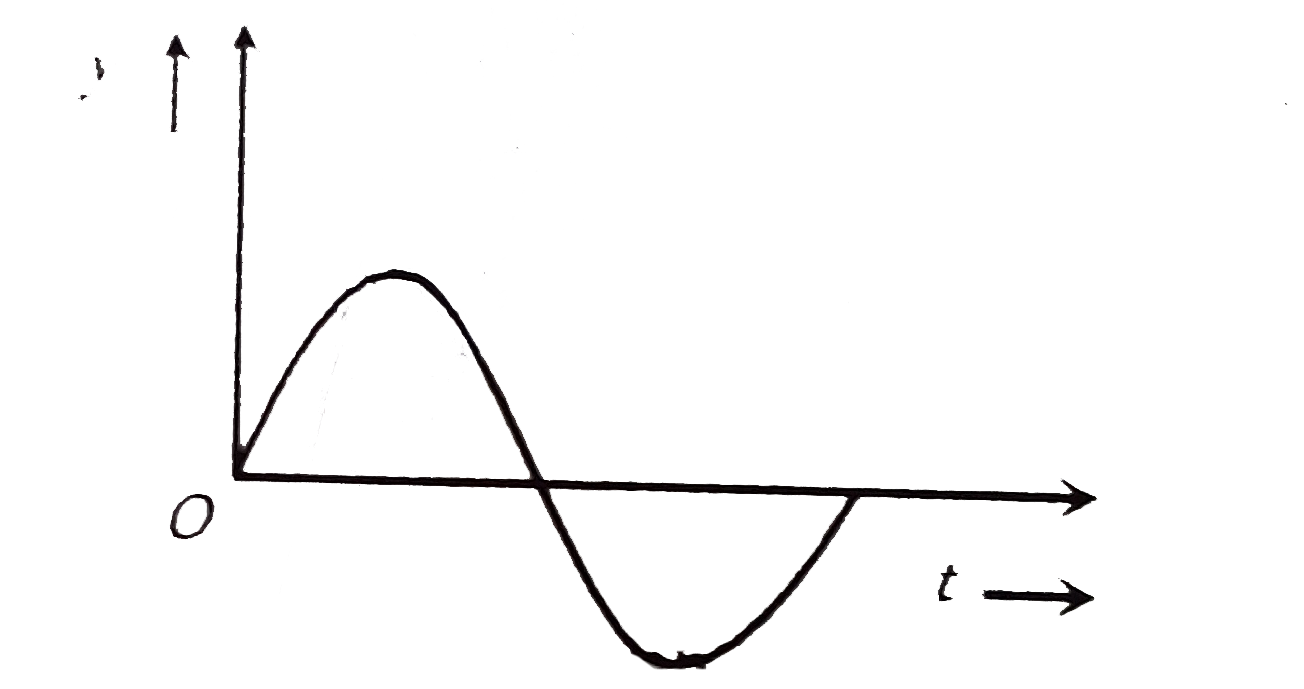 View Solution


