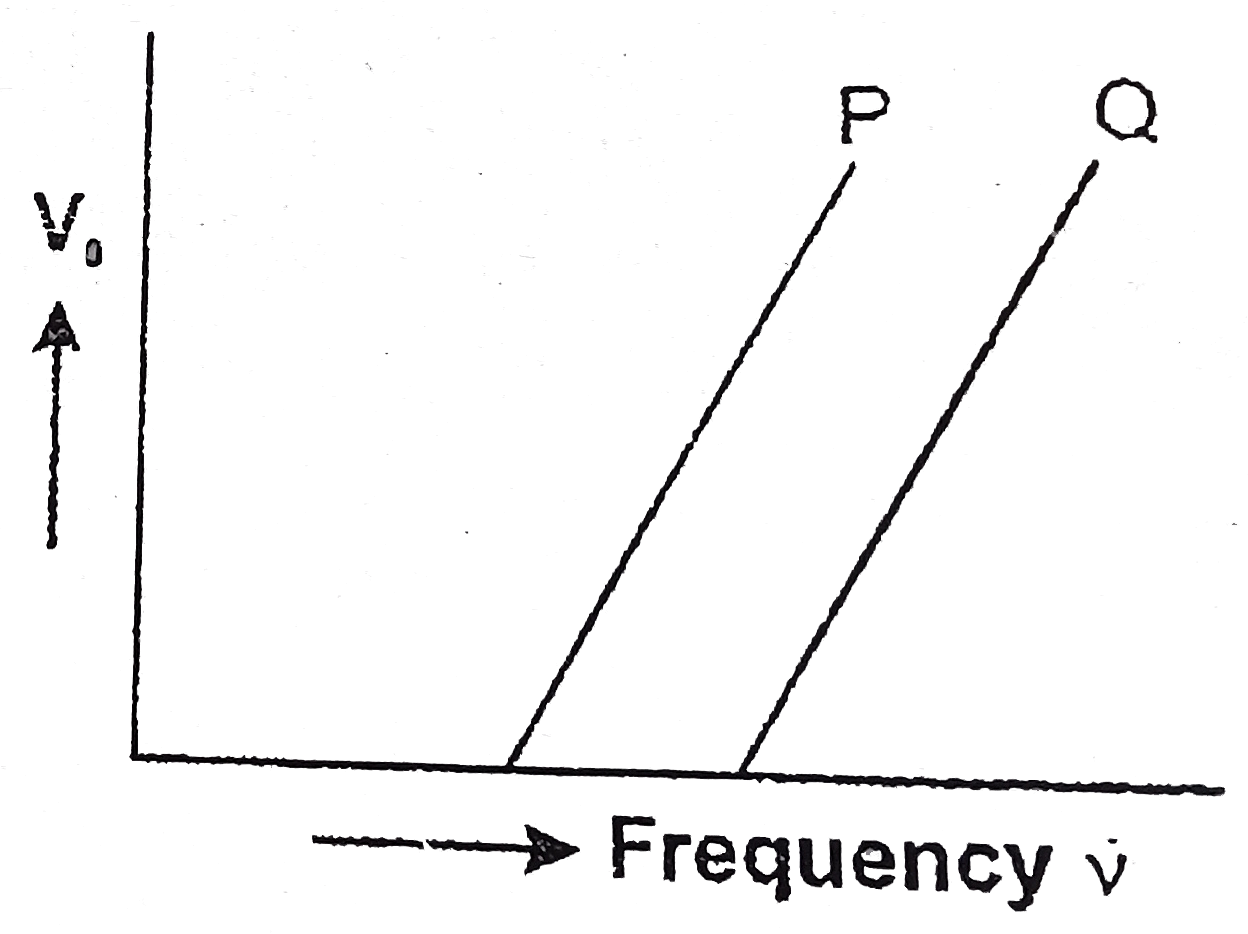
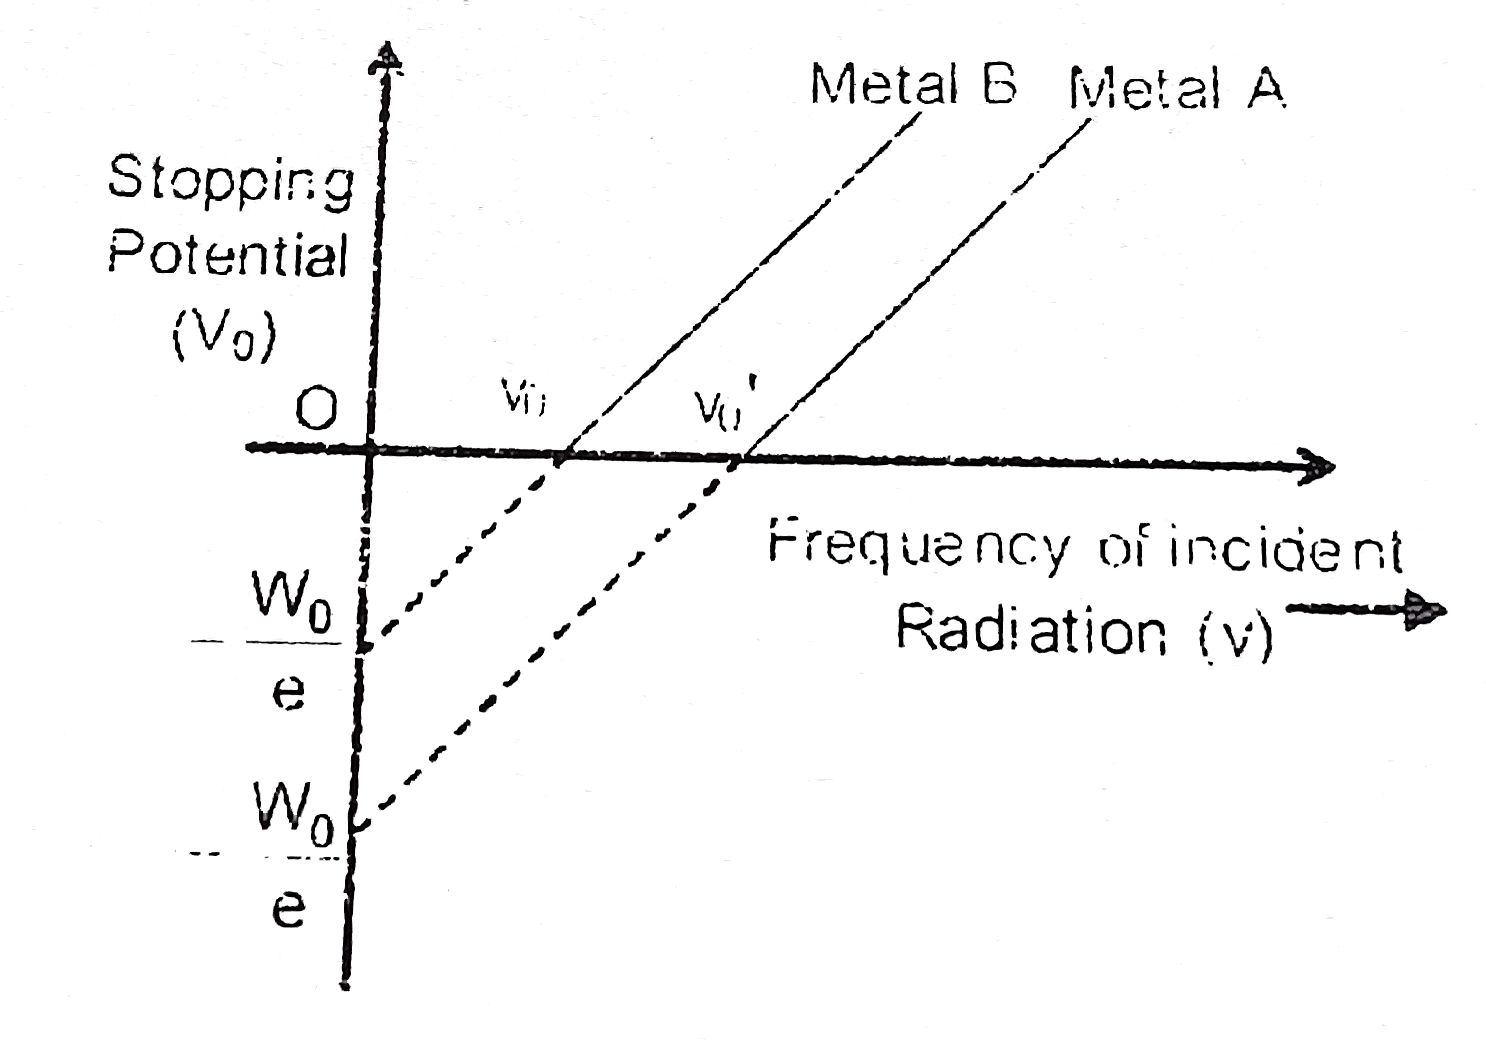
Draw a graph between stopping potential and the frequency of two metals A and B having threshold frequencies v0and2v0 .
To solve the problem of drawing a graph between stopping potential (V_s) and frequency (ν) for two metals A and B with threshold frequencies ν₀ and 2ν₀ respectively, we will follow these steps:
1. Understand the Concept of Threshold Frequency:
- The threshold frequency (ν₀ for metal A and 2ν₀ for metal B) is the minimum frequency of incident light required to emit photoelectrons from the metal surface. If the frequency of the incident light is below this threshold, no photoelectrons will be emitted.
2. Identify the Stopping Potential:
- The stopping potential (V_s) is the potential needed to stop the most energetic photoelectrons emitted from the metal. According to the photoelectric effect, the stopping potential is related to the frequency of the incident light by the equation:
eVs=hν−hν0
- Rearranging gives:
Vs=he(ν−ν0)
- For metal A, this becomes:
Vs=he(ν−ν0)
- For metal B, the equation becomes:
Vs=he(ν−2ν0)
3. Plot the Graph:
- On the graph, plot the stopping potential (V_s) on the y-axis and the frequency (ν) on the x-axis.
- For metal A:
- At ν = ν₀, V_s = 0 (this is the threshold frequency).
- For frequencies greater than ν₀, the graph will be a straight line with a positive slope.
- For metal B:
- At ν = 2ν₀, V_s = 0 (this is the threshold frequency).
- For frequencies greater than 2ν₀, the graph will also be a straight line but will start from a higher frequency than metal A.
4. Label the Graph:
- Clearly label the lines for metals A and B, indicating their respective threshold frequencies and the linear relationship for stopping potential above these thresholds.
Final Graph Description:
- The graph will show two linear lines:
- Line A starting from (ν₀, 0) and increasing linearly with a slope of he.
- Line B starting from (2ν₀, 0) and also increasing linearly with the same slope he.
- The threshold frequency (ν₀ for metal A and 2ν₀ for metal B) is the minimum frequency of incident light required to emit photoelectrons from the metal surface. If the frequency of the incident light is below this threshold, no photoelectrons will be emitted.
- The stopping potential (V_s) is the potential needed to stop the most energetic photoelectrons emitted from the metal. According to the photoelectric effect, the stopping potential is related to the frequency of the incident light by the equation:
eVs=hν−hν0
- Rearranging gives:
Vs=he(ν−ν0)
- For metal A, this becomes:
Vs=he(ν−ν0)
- For metal B, the equation becomes:
Vs=he(ν−2ν0)
- On the graph, plot the stopping potential (V_s) on the y-axis and the frequency (ν) on the x-axis.
- For metal A:
- At ν = ν₀, V_s = 0 (this is the threshold frequency).
- For frequencies greater than ν₀, the graph will be a straight line with a positive slope.
- For metal B:
- At ν = 2ν₀, V_s = 0 (this is the threshold frequency).
- For frequencies greater than 2ν₀, the graph will also be a straight line but will start from a higher frequency than metal A.
- Clearly label the lines for metals A and B, indicating their respective threshold frequencies and the linear relationship for stopping potential above these thresholds.
- The graph will show two linear lines:
- Line A starting from (ν₀, 0) and increasing linearly with a slope of he.
- Line B starting from (2ν₀, 0) and also increasing linearly with the same slope he.
Topper's Solved these Questions
- BOOK - MODERN PUBLICATIONCHAPTER - DUAL NATURE OF RADIATION AND MATTER EXERCISE - Revision Exercises (Additional Questions)8videos
DUAL NATURE OF RADIATION AND MATTER
- BOOK - MODERN PUBLICATIONCHAPTER - DUAL NATURE OF RADIATION AND MATTER EXERCISE - Revision Exercises (Fill in the Blanks)11videos
DUAL NATURE OF RADIATION AND MATTER
- BOOK - MODERN PUBLICATIONCHAPTER - DUAL NATURE OF RADIATION AND MATTER EXERCISE - Higher Order Thinking Skills & Advanced Level (QUESTIONS WITH ANSWERS)8videos
DUAL NATURE OF RADIATION AND MATTER
- BOOK - MODERN PUBLICATIONCHAPTER - CURRENT ELECTRICITYEXERCISE - Chapter Practice Test15videos
CURRENT ELECTRICITY
- BOOK - MODERN PUBLICATIONCHAPTER - ELECTRIC CHARGES AND FIELDS EXERCISE - Chapter Practice Test15videos
ELECTRIC CHARGES AND FIELDS
Similar Questions
Knowledge Check
- Question 1 - Select One
Graph between stopping potential and frequency of light as shown find the work function
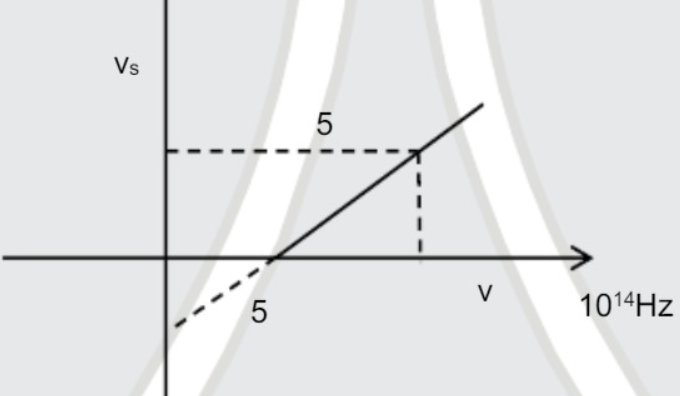 A4.01 evB2.07 evC5.01 evD2.09 ev
 - Question 2 - Select One
In the diagram, graph are drawn between stopping potential V0 and frequency v for the elements K and Ca. According this to diagram
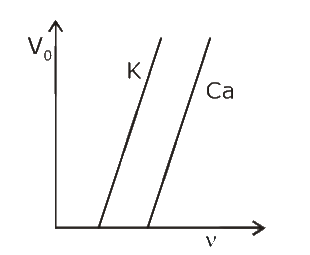 Athe work functions of K and Ca are equalBthe work function of K is greater than that of CaCthe work function of K is less than that of CaDno information can be obtained about the work function
 - Question 3 - Select One
Choose the graph showing the correct relationship between the stopping potential V0 and the frequency v of light for potassium and tungsten.
A B
B C
C D
D
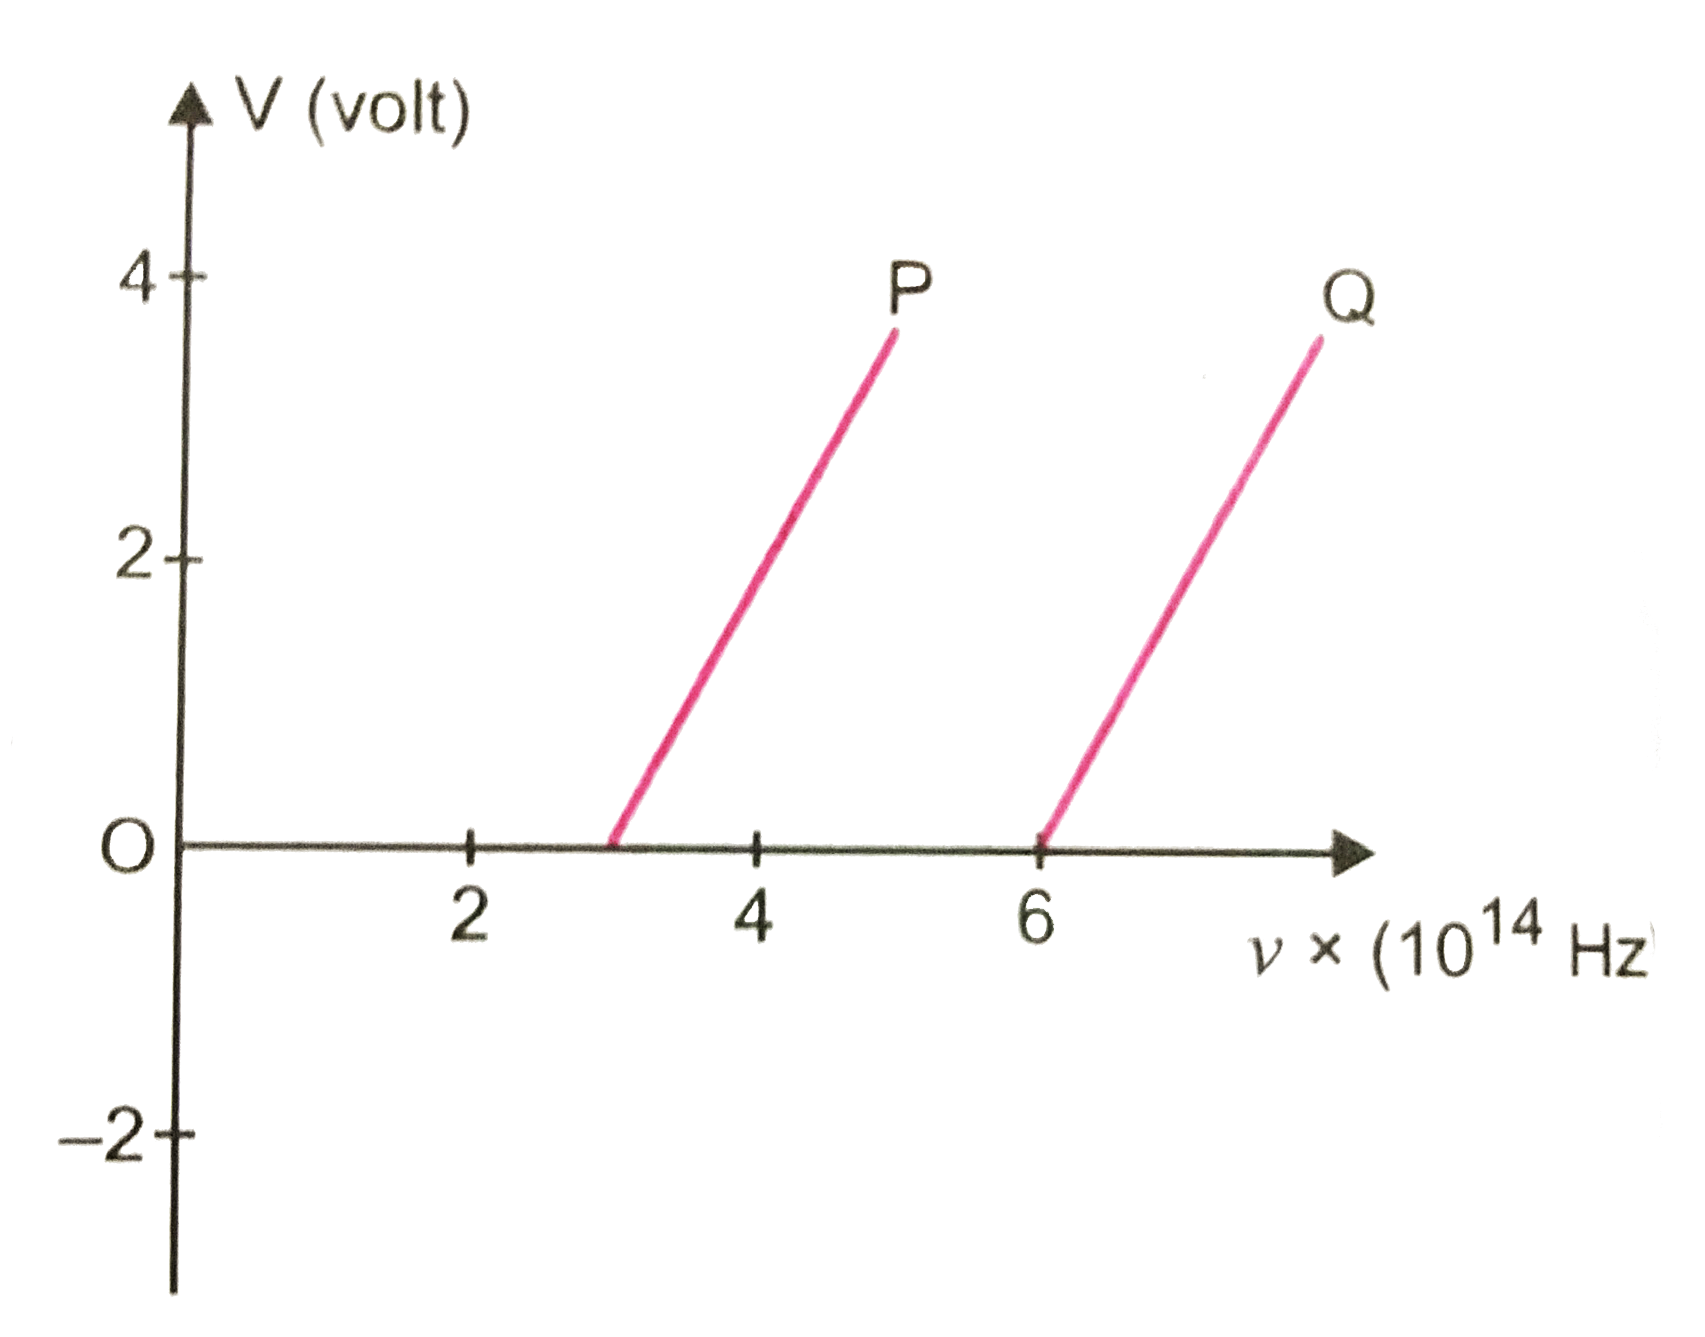
In the study of a photoelectric effect the graph between the stopping potential V and frequency v of the incident radiation on two different metals P and Q is shown in fig.
(i) which one of two metals have higher threshold frequency
(ii) Determine the work function of the metal which has greater value
(iii) Find the maximum kinetic energy of electron emitted by light of frequency 8×10¹⁴Hz for this metal.
 View Solution
Sketch the graphs, showing the variation of stopping potential Vs with frequency v of the incident radiations for two photosensitive materials A and B having threshold frequencies v0>v'0 respectively.
(i) which of the two metals A or B has higher work function?
(ii) What information do you get from the slope of the graphs?
(iii) What does the value of the intercept of graph A on the potential axis represent?View SolutionThe graph shows variation of stopping potential V0 versus frequency of incident radiation v for two photosensitive metals A and B. Which of two metals has higher threshold frequency and why?
 View Solution
Photons of frequency v fall on a metal surface for which the thershold frequency is v0(v≥v0). Then,
View SolutionThe figure showing the correct relationship between the stopping potential V and the frequency v of the light for potassium and tungsten is
View Solution


