Draw a graph to show the variation of E with perpendicular distance r from line of charge.
To draw the graph showing the variation of electric field E with the perpendicular distance r from a line of charge, we can follow these steps:
1. Understand the Concept of Line Charge:
- A line charge is a distribution of charge along a straight line. The linear charge density λ is defined as the charge per unit length, given by λ=QL, where Q is the total charge and L is the length of the line.
2. Determine the Electric Field Expression:
- For an infinitely long line of charge, the electric field E at a distance r from the line is given by the formula:
E=2kλr
- Here, k is Coulomb's constant, and λ is the linear charge density.
3. Analyze the Relationship:
- The equation E=2kλr shows that the electric field E is inversely proportional to the distance r. This means as r increases, E decreases.
4. Identify Key Points:
- When r approaches 0, E approaches infinity, indicating that the electric field strength is very high near the line charge.
- As r increases towards infinity, E approaches 0, indicating that the electric field weakens with distance.
5. Plot the Graph:
- On the graph, plot the electric field E on the y-axis and the perpendicular distance r on the x-axis.
- The graph will start from a high value when r is very small and will decrease towards 0 as r increases. The curve will be hyperbolic, showing that E decreases rapidly at first and then more slowly as r increases.
6. Label the Graph:
- Clearly label the axes: the y-axis as E (Electric Field) and the x-axis as r (Perpendicular Distance).
- Indicate the direction of the curve, showing that E decreases as r increases.
- A line charge is a distribution of charge along a straight line. The linear charge density λ is defined as the charge per unit length, given by λ=QL, where Q is the total charge and L is the length of the line.
- For an infinitely long line of charge, the electric field E at a distance r from the line is given by the formula:
E=2kλr
- Here, k is Coulomb's constant, and λ is the linear charge density.
- The equation E=2kλr shows that the electric field E is inversely proportional to the distance r. This means as r increases, E decreases.
- When r approaches 0, E approaches infinity, indicating that the electric field strength is very high near the line charge.
- As r increases towards infinity, E approaches 0, indicating that the electric field weakens with distance.
- On the graph, plot the electric field E on the y-axis and the perpendicular distance r on the x-axis.
- The graph will start from a high value when r is very small and will decrease towards 0 as r increases. The curve will be hyperbolic, showing that E decreases rapidly at first and then more slowly as r increases.
- Clearly label the axes: the y-axis as E (Electric Field) and the x-axis as r (Perpendicular Distance).
- Indicate the direction of the curve, showing that E decreases as r increases.
Topper's Solved these Questions
Similar Questions
Use Gauss'law to derive the expression for the electric field (→E) due to a straight uniformaly charged infinite line of charge density λCm−1
(b) Draw a graph to show the variation of E with perpendicular distance r from the line of charge.
(c) Find the work done is bringing a charge q from perpendicular distance r1→r2(r2<r1)
View SolutionShow the variation of magnetic field B with perpendicular distance r from the axis of a long conducting cylinder carrying current I.
View Solution
Knowledge Check
Which one of the following graphs shows the variation of magnetic induction B which distance r from a long wire carrying a current ?
A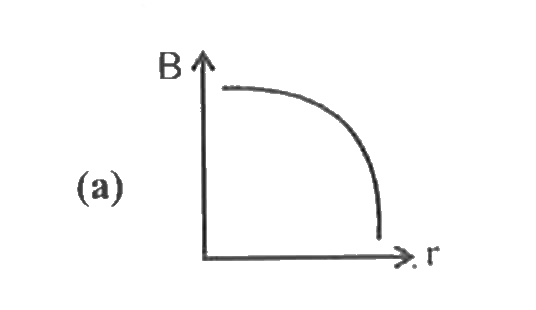 B
B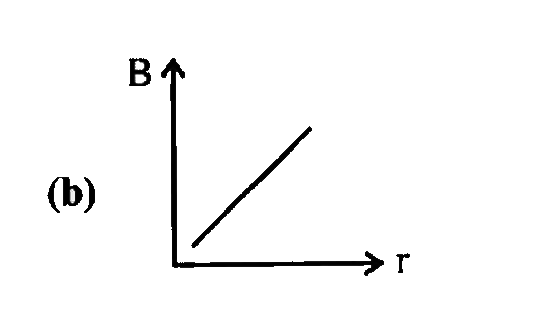 C
C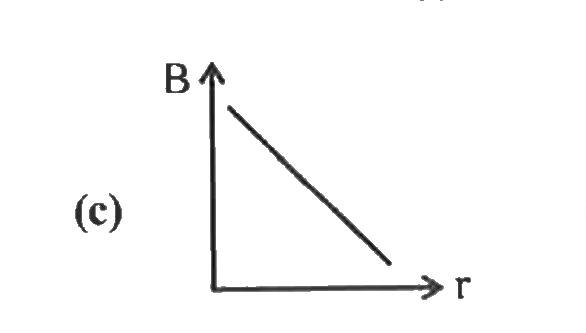 D
D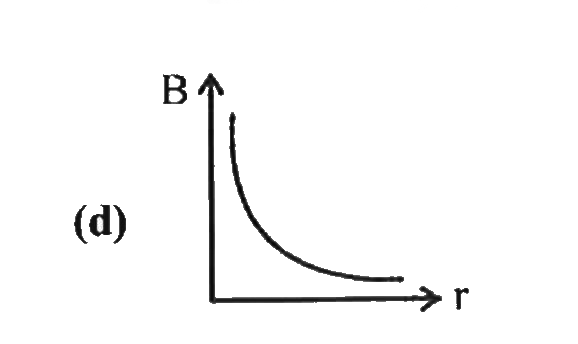
A cylindrical space of radius R is filled with a uniform magnetic induction parallel to the axis of the cylinder. If B charges at a constant rate, the graph showin the variation of induced electric field with distance r from the axis of cylinder is
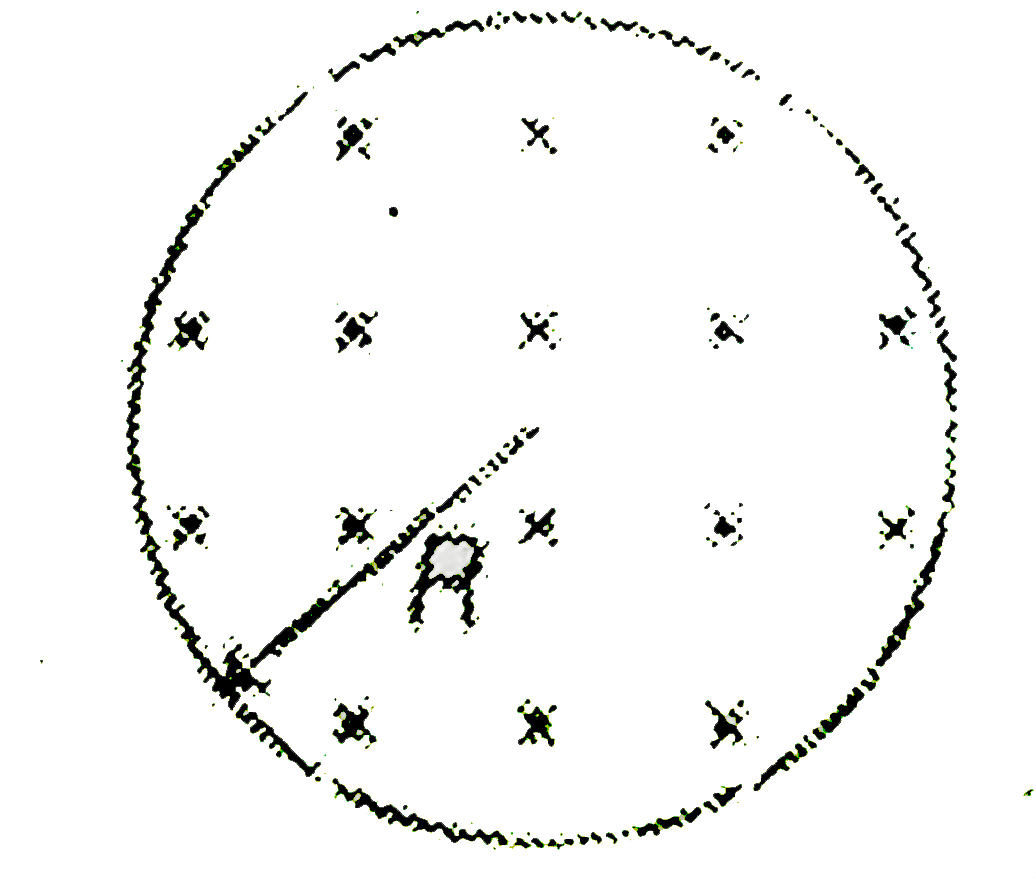 A
A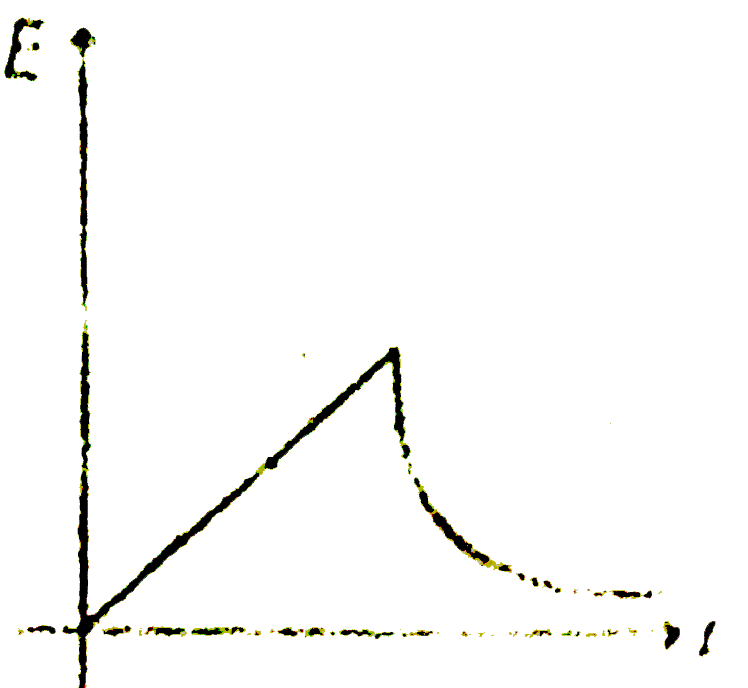 B
B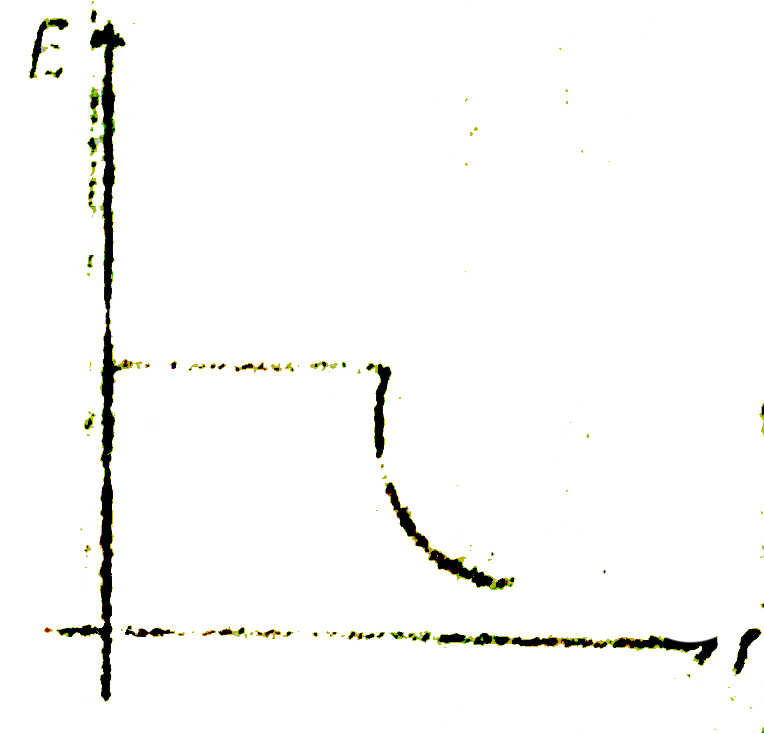 C
C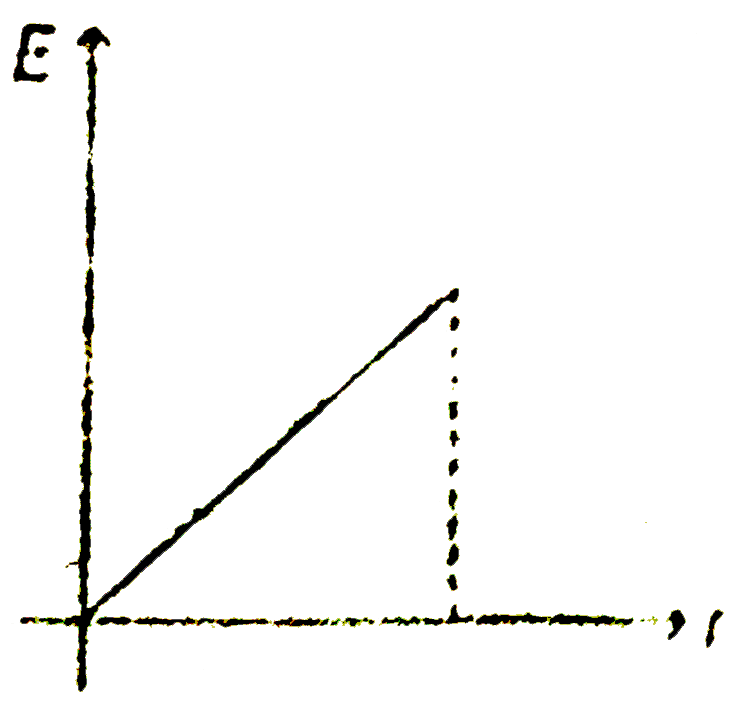 D
D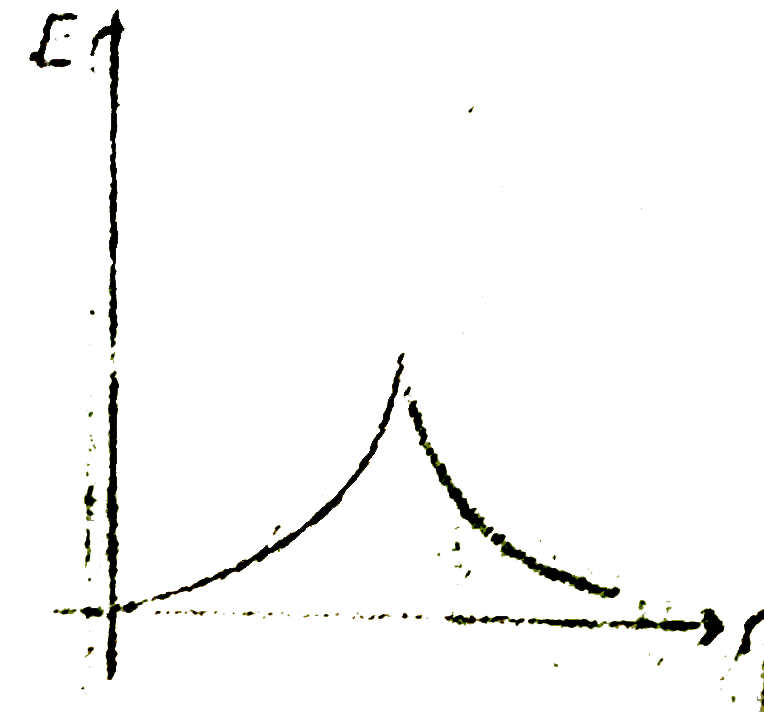
A thin long conductor has linear charge density of 20 μC/m. Calculate the electric field intensity at a point 5 cm from it. Draw a graph to show variation of electric field intensity with distance from the conductor.
View SolutionDraw a graph to show the the variation of P.E., K.E. and total eneryg of a simple harmonic oscillator with displacement .
View SolutionDraw a graph showing the variation of decay rate with number of active nuclei.
View SolutionDraw a graph showing the variation of decay rate with number of active nuclei.
View SolutionDefine photoelectric effect. Draw a graph to show the variation of stopping potential with frequency of incident radiation on a metal plate.
View SolutionDraw a graph to show the variation of PE, KE and total energy of a simple harmonic oscillator with displacement.
View Solution
