Explain by drawing graphs of displacement x(t)→t, velocity v(t)→t and acceleration a(t)→t of SHM for initial phase zero.Solution in Gujrati
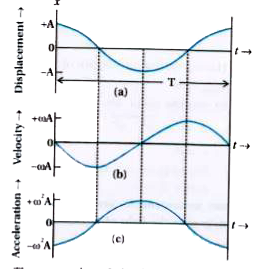
The following graphs of the displacement x(t)=Acosωt, velocity v(t)=−Aωsinωt and acceleration a(t)=−Aωcosωt versus time t of SHM for initial phase zero are shown in figures.
These graphs of displacement, velocity and acceleration of a particle in simple harmonic motion have the same period T, but they differ in phase.
All the quantities change periodically with time according to sine.
In this graphs for all three quantities have their maxima differ and differ in phase.
x varies between −A to +A,v(t) varies from −Aω to Aω and a(t) from −Aω2 to +Aω2.
With respect to displacement plot, velocity plot has a phase difference of π2 and acceleration plot has a phase difference of π.

Topper's Solved these Questions
- OSCILLATIONSBook:KUMAR PRAKASHANChapter:OSCILLATIONSExercise:SECTION-A (TRY YOURSELF)
Explore 64 Videos
- OSCILLATIONSBook:KUMAR PRAKASHANChapter:OSCILLATIONSExercise:SECTION-B (NUMERICAL FROM TEXTUAL ILLUSTRATIONS)
Explore 40 Videos
- OBJECTIVE QUESTIONS AS PER NEW PAPER STYLE Book:KUMAR PRAKASHANChapter:OBJECTIVE QUESTIONS AS PER NEW PAPER STYLE Exercise:CHAPTER - 8 (Match Type questions)
Explore 5 Videos
- PHYSICAL WORLDBook:KUMAR PRAKASHANChapter:PHYSICAL WORLDExercise:SECTION-E (QUESTIONS FROM MODULE)
Explore 9 Videos
Similar Questions
What is motion ?
View SolutionOn an average, a human heart is found to beat 75 times in a minute. Calculate its frequency and period.
View SolutionType of satellites are given in Column-I and their uses are given in Column-II. Match them properly :
Column-IColumn-II(1) Polar satellite(a) Tele communication(2) Geo-stationary satellite(b) Investigation(c) For information about atmosphere
View Solution.…. state of substance at very high temperature has generated hope of energy source for mankind.
View Solutioni.The acceleration versus time graph of a partical SHM is shown in the figure . Plot the displacement versus time graph ii. The frection of oscillation is…….. iii. The displacement amplitude is ……… iv. At t = 0 , the velocity of the partical is ...... v. The kinetic energy of the partical is maximum at t = ....... and t = ...... vi. The potential energy is maximum at t = ....... : t = ..... ans t = .........
View SolutionConsider the following a-t graph for a particle moving along the x-axis. If the initial velocity is zero, sketch the v-t graph.
View SolutionA body falls from same height and return back to initial position Draw displacement ˆs-time (t), distance (s) - time (t) and velocity ˆV-time (t), speed (v), time (t) and acceleration ˆa-time (t) graphs for the motion of the body
View Solutionचित्र में एक कण के लिए x -t ग्राफ दिखाया गया है | t का लगभग मान ज्ञात करे ताकि t=0 से t=t तक का औसत वेग शून्य हो |

View SolutionDisplacement x at time t is x=t−t3. If v is the velocity and a the acceleration at time t, then :v =
View SolutionThe displacement -time (x– t) graph of a body is given as

The corresponding velocity -time (v – t ) graph will be
View SolutionIf x = a cos t is the displacement in time t then, acceleration is :
View SolutionIf x = a cos t is the displacement in time t then, acceleration is :
View SolutionDraw and explain the v→t graphs for uniformly accelerated motion.
View SolutionDraw v to t graph for constant velocity and explain it.
View SolutionDraw graphs a→t,v→tandx→t for the object falling freely.
View Solution