i.The acceleration versus time graph of a partical SHM is shown in the figure . Plot the displacement versus time graph
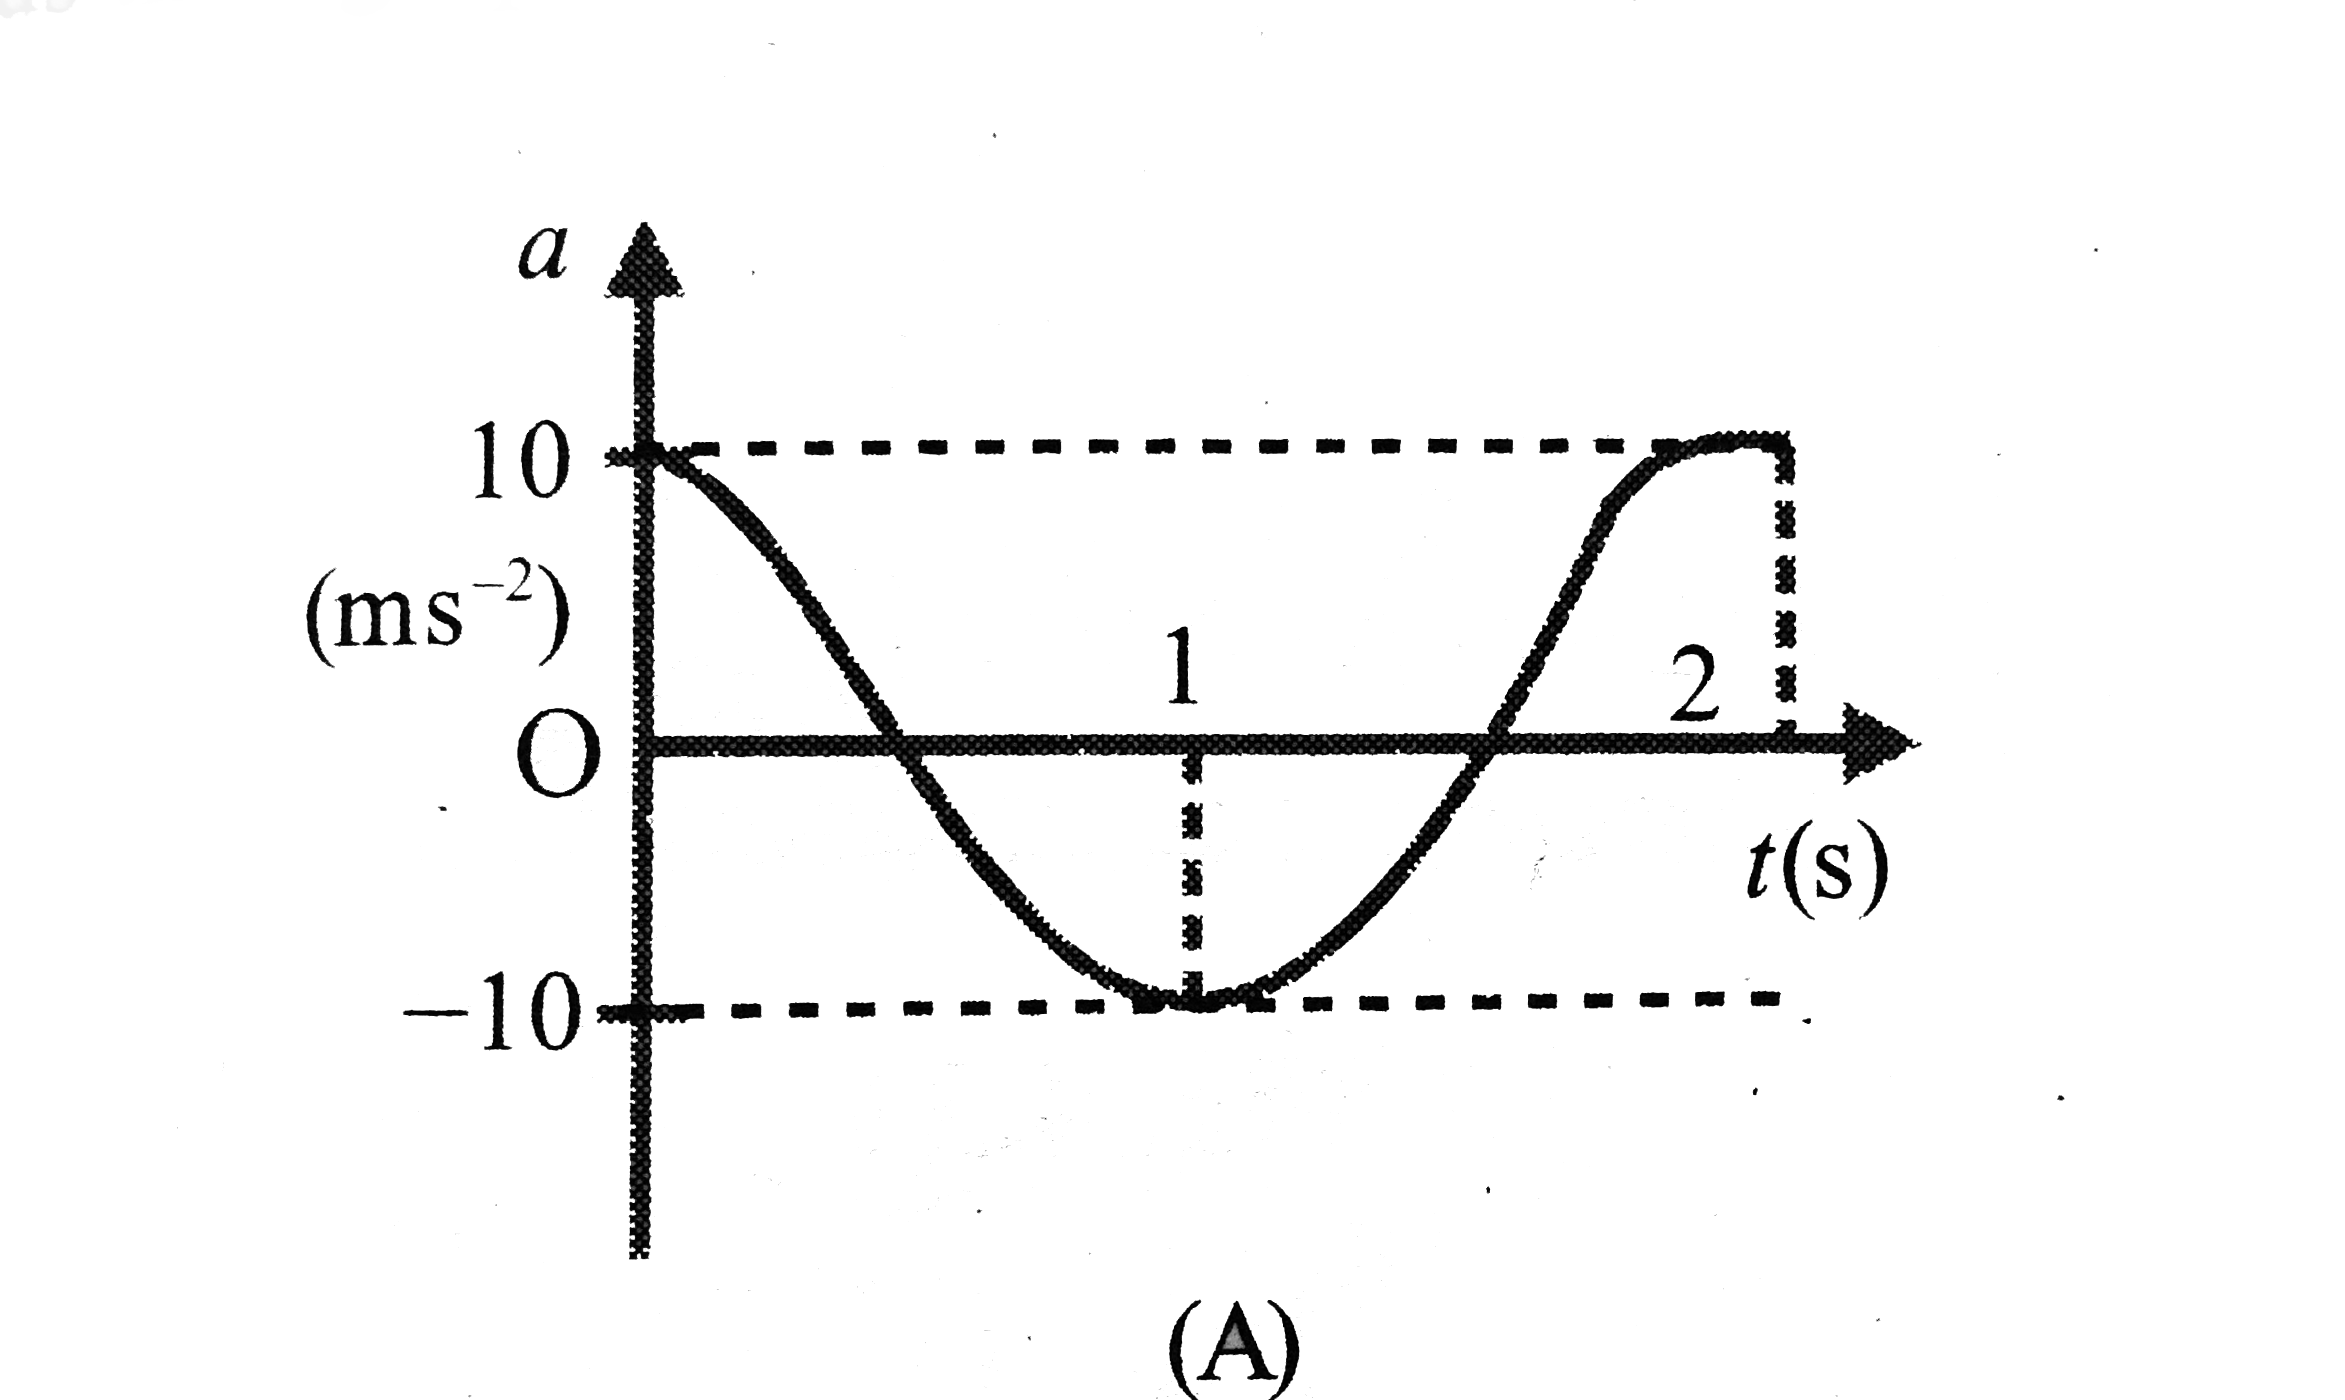
ii. The frequency of oscillation is……..
iii. The displacement amplitude is ………
iv. At t=0, the velocity of the partical is ......
v. The kinetic energy of the partical is maximum at t=....... and t = ......
vi. The potential energy is maximum at t = ....... : t = ..... ans t = .........
i. 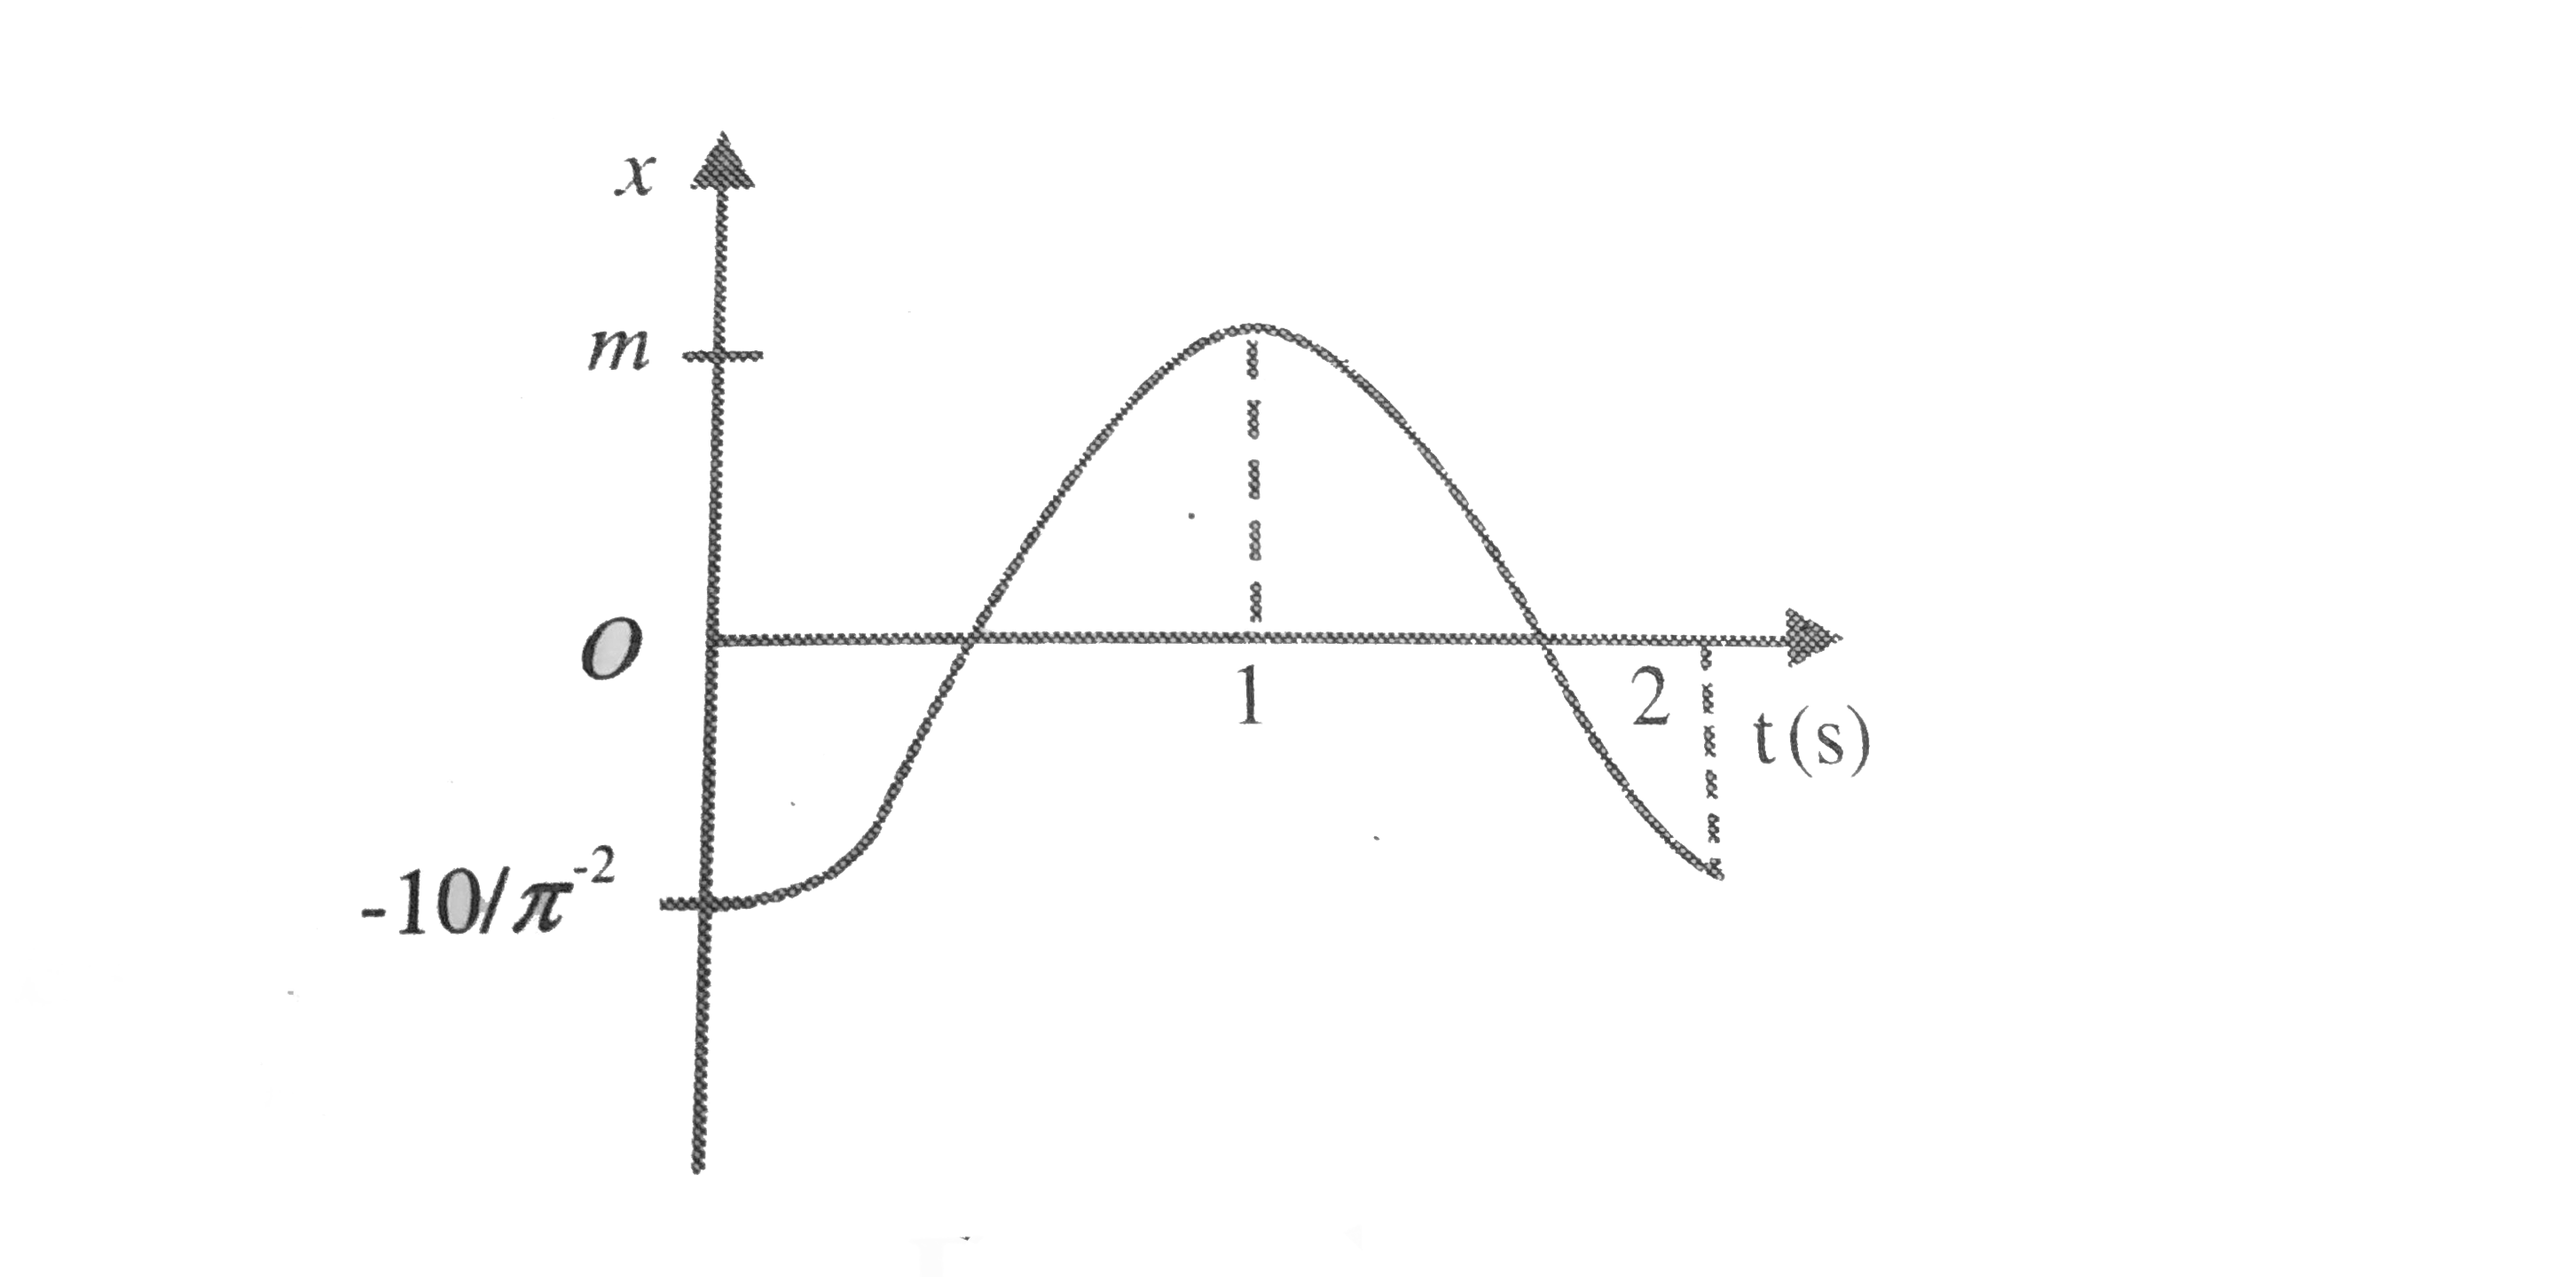
ii. 0.5
iii. 10/π2m
iv. Zero
v. 0.5s1.5s
vi. 0:1s,and2s
Topper's Solved these Questions
- LINEAR AND ANGULAR SIMPLE HARMONIC MOTIONBook:CENGAGE PHYSICS ENGLISHChapter:LINEAR AND ANGULAR SIMPLE HARMONIC MOTIONExercise:Exercise 4.2
Explore 23 Videos
- LINEAR AND ANGULAR SIMPLE HARMONIC MOTIONBook:CENGAGE PHYSICS ENGLISHChapter:LINEAR AND ANGULAR SIMPLE HARMONIC MOTIONExercise:Subjective
Explore 21 Videos
- LINEAR AND ANGULAR SIMPLE HARMONIC MOTIONBook:CENGAGE PHYSICS ENGLISHChapter:LINEAR AND ANGULAR SIMPLE HARMONIC MOTIONExercise:Solved Example
Explore 15 Videos
- KINETIC THEORY OF GASES AND FIRST LAW OF THERMODYNAMICSBook:CENGAGE PHYSICS ENGLISHChapter:KINETIC THEORY OF GASES AND FIRST LAW OF THERMODYNAMICSExercise:Interger
Explore 11 Videos
- MISCELLANEOUS KINEMATICSBook:CENGAGE PHYSICS ENGLISHChapter:MISCELLANEOUS KINEMATICSExercise:Interger type
Explore 3 Videos
Similar Questions
The acceleration versus time graph of a particle is shown in. The respective v−t graph of the particle is .
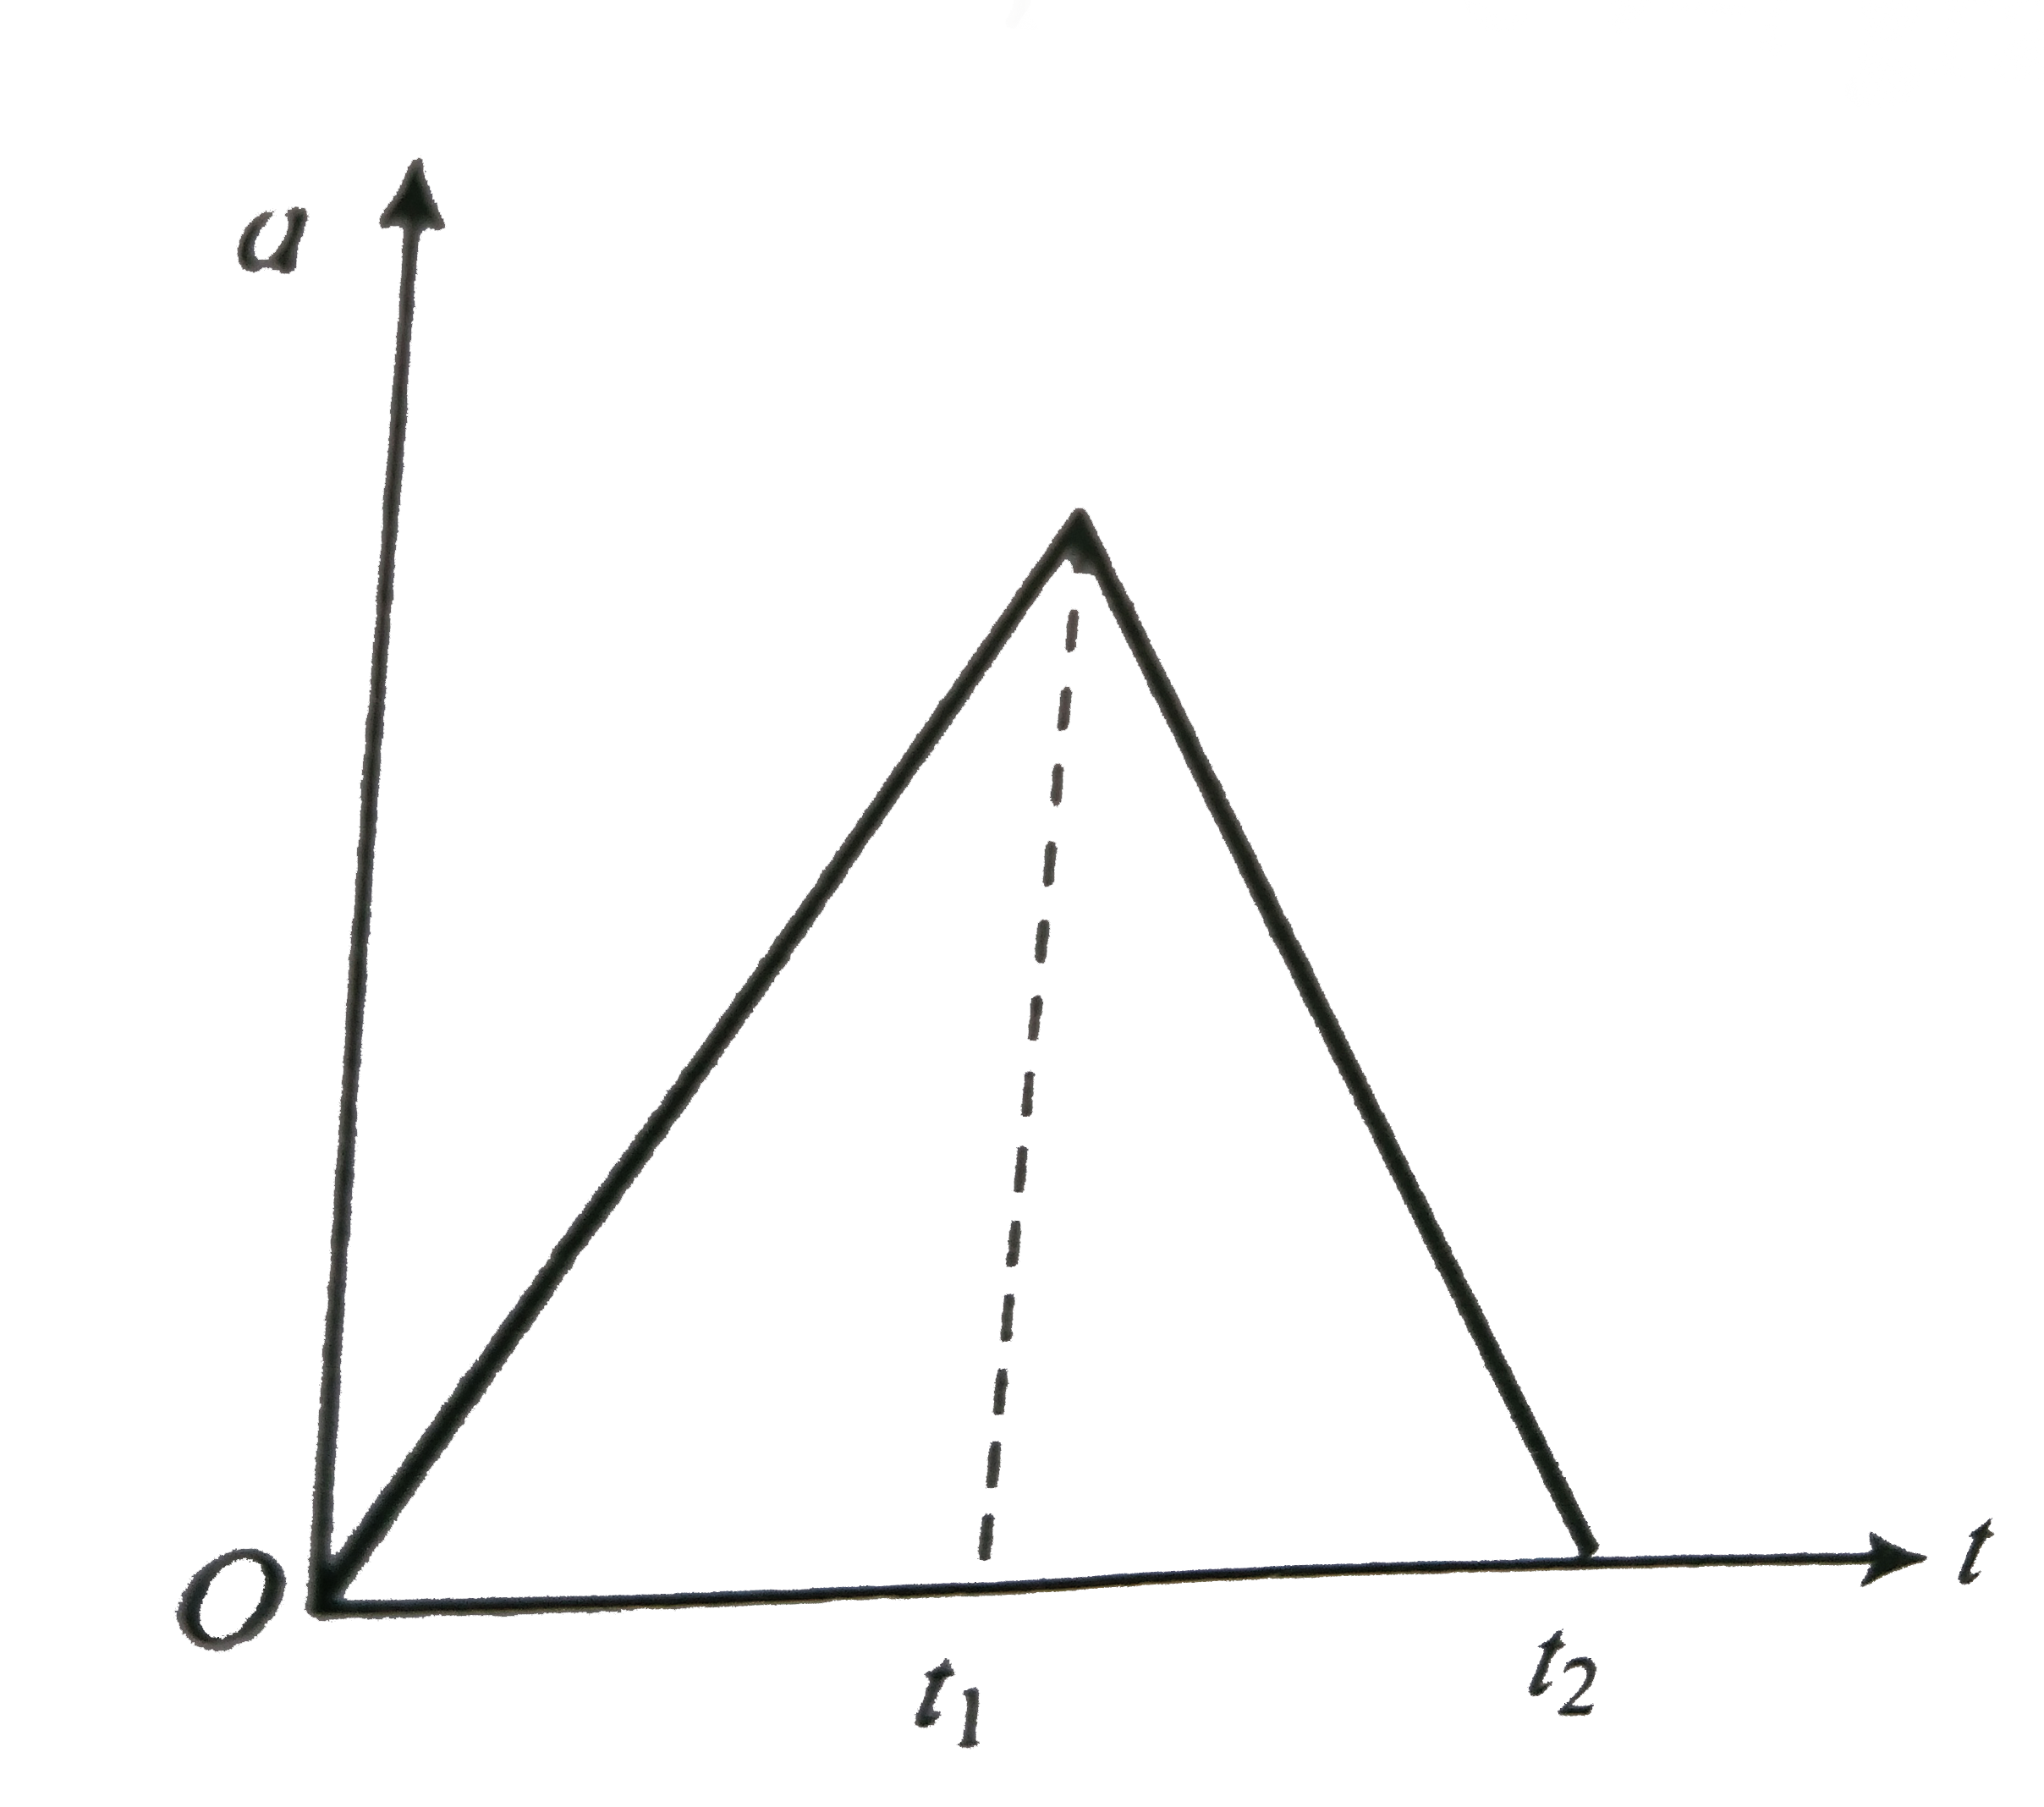 .
.
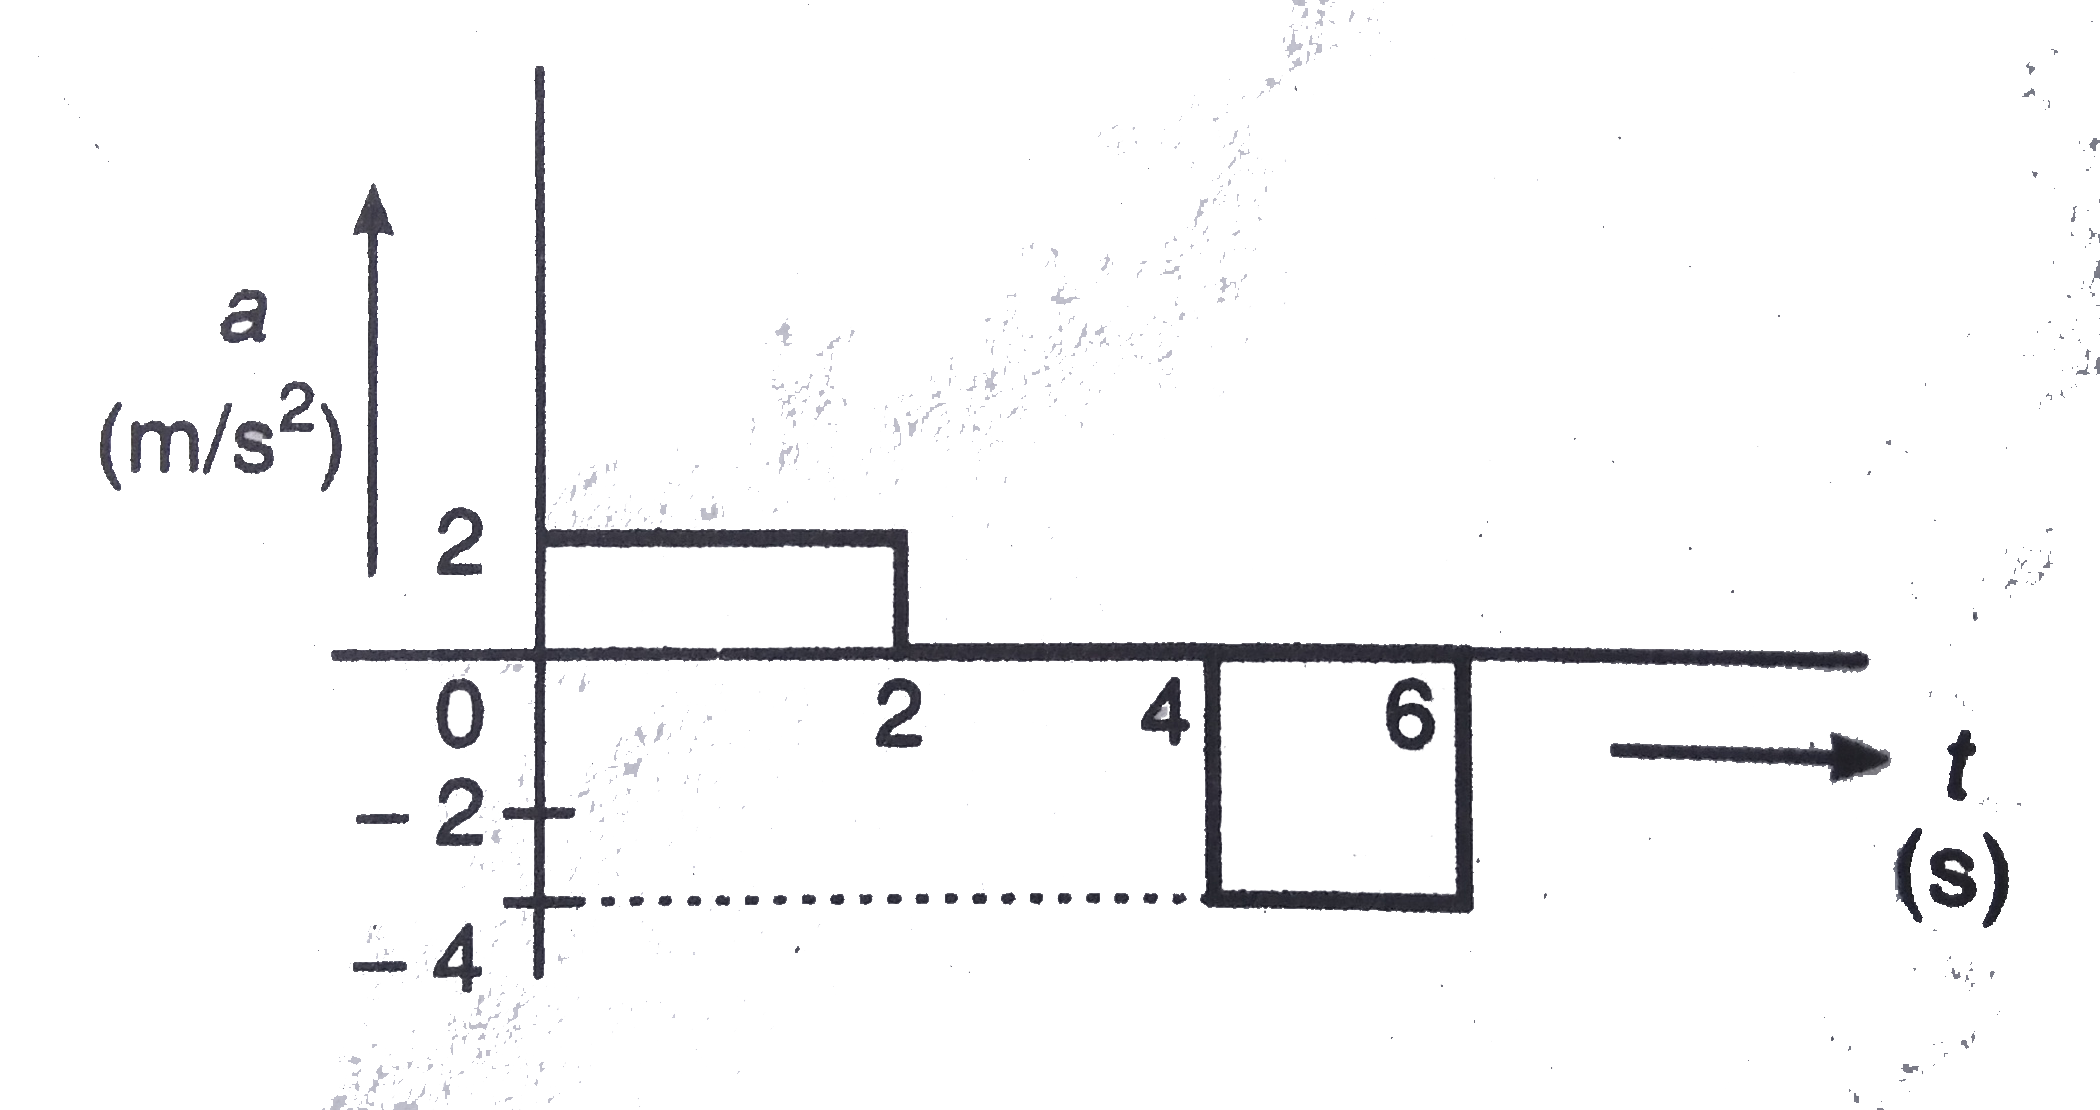
View SolutionThe acceleration versus time graph of a particle moving along a straight line is shown in the figure. Draw the respective velocity-time graph Given v=0 at t=0.
View SolutionVelocity versus time graph of a body is shown in figure. It explains that
View SolutionDisplacement versus time curve for a particle executing SHM is shown in figure. Choose the correct statements.
View SolutionDisplacement versus time curve for a particle executing SHM is shown in figure. Choose the correct statements.

View SolutionThe acceleration versus time graph of a particle moving in a straight line is show in. The velocity-time graph of the particle would be
 .
.
View SolutionThe velocity versus time graph of a body in a straight line is as shown in figure. The displacment of the body in five seconds is
View SolutionThe displacement (x)-time (t) graph of a particle is shown in figure. Which of the following is correct ?
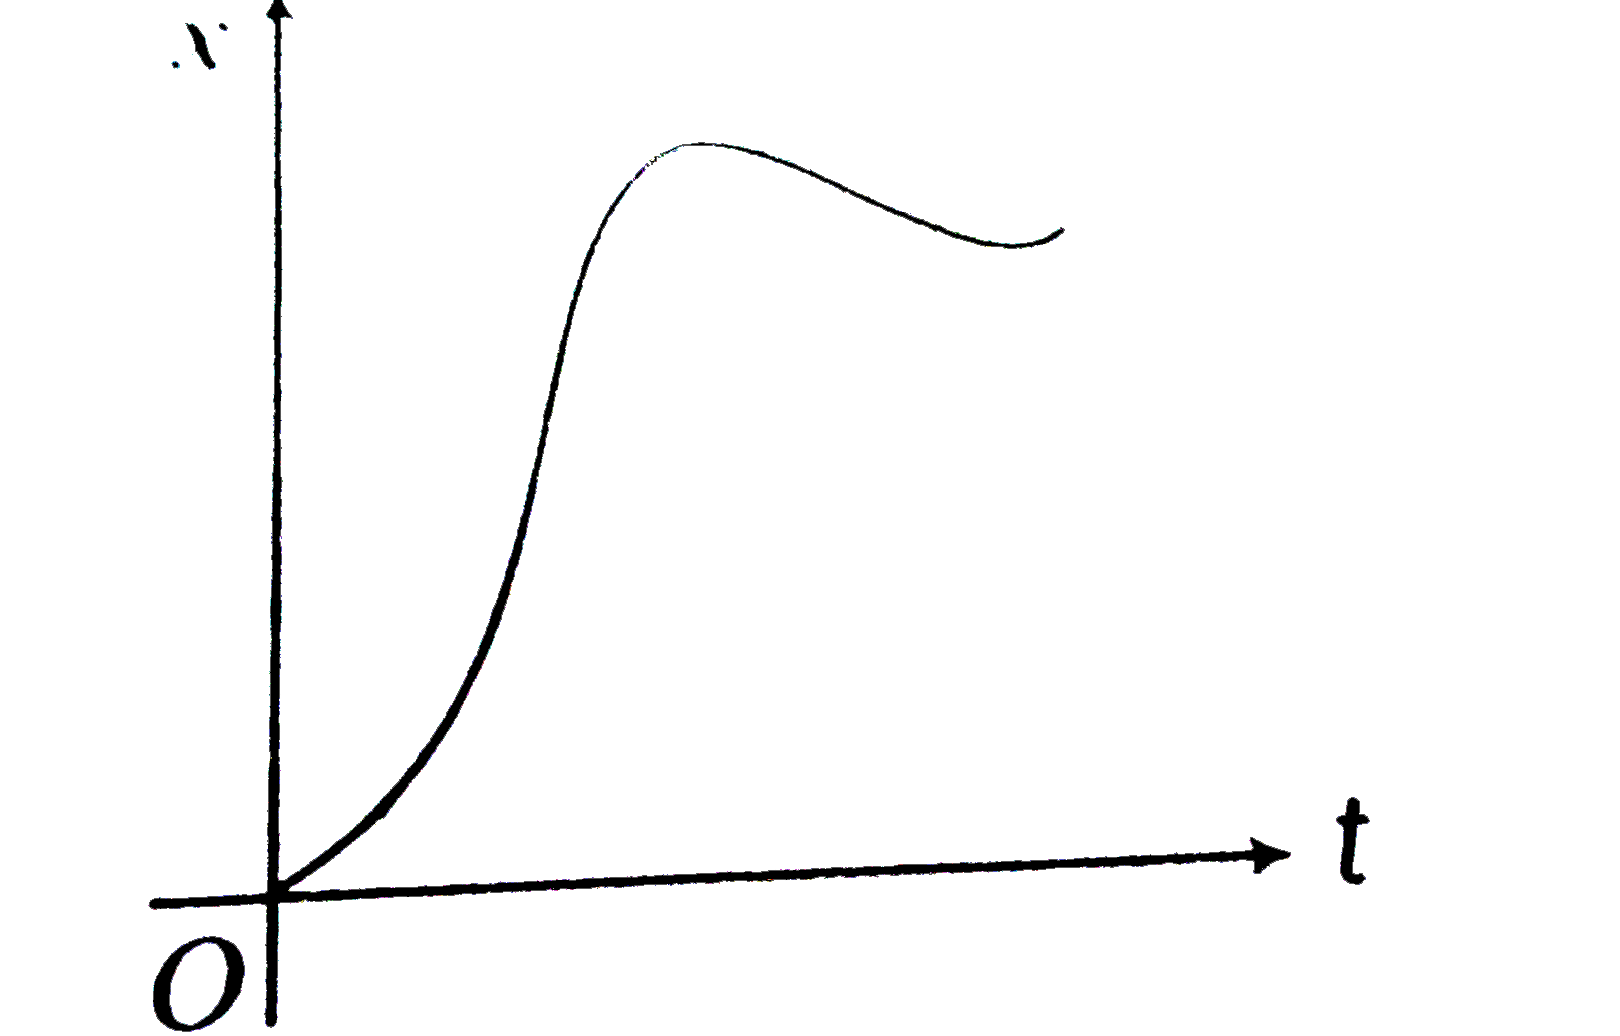
View SolutionThe displacement time graph of a particle executing S.H.M as shown in the figure.
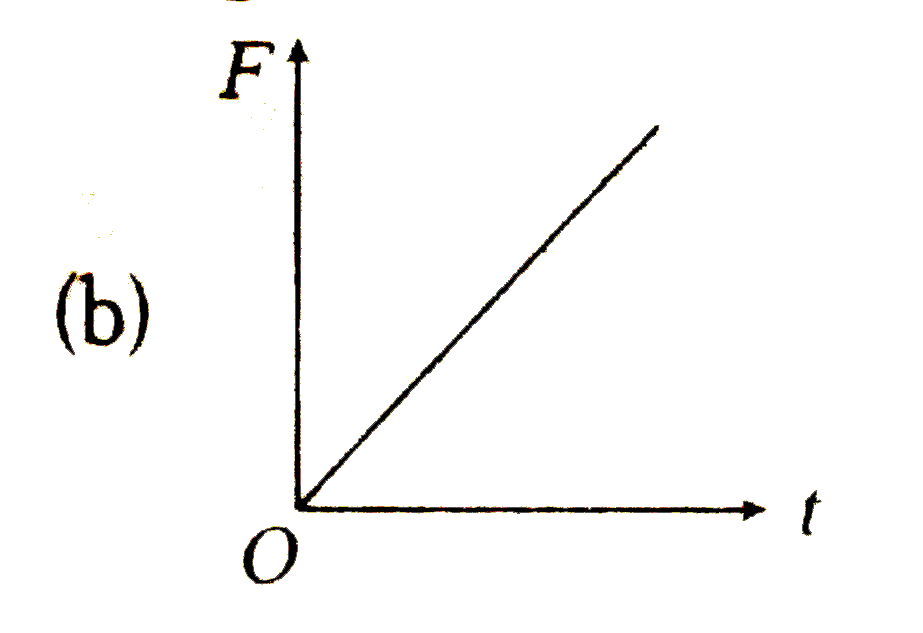
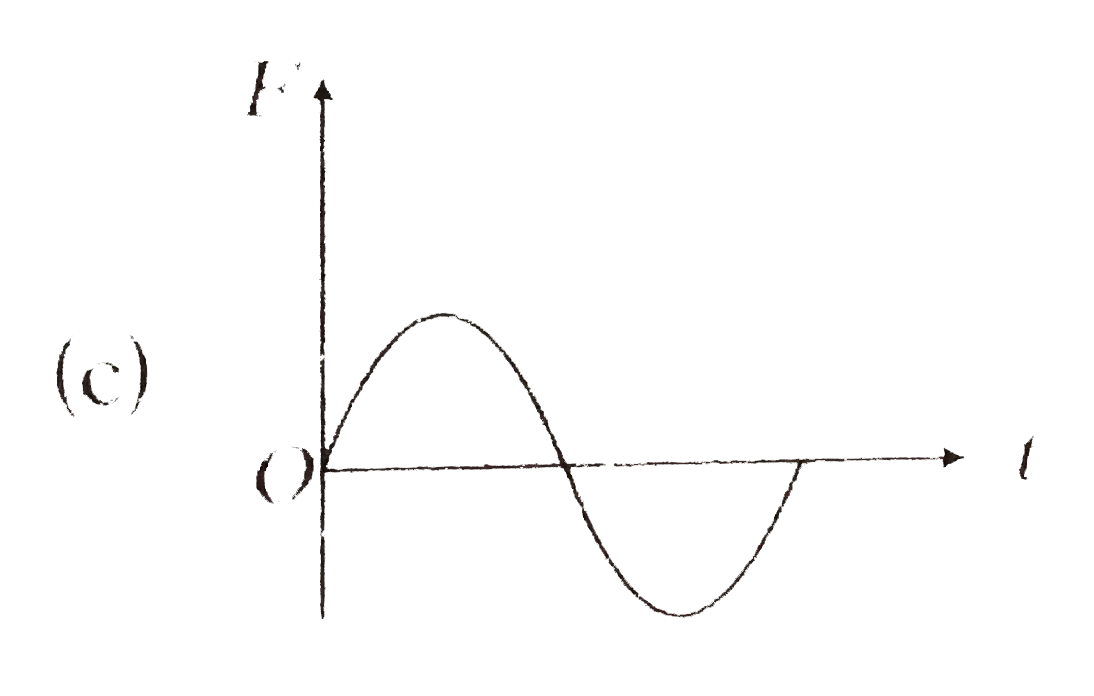
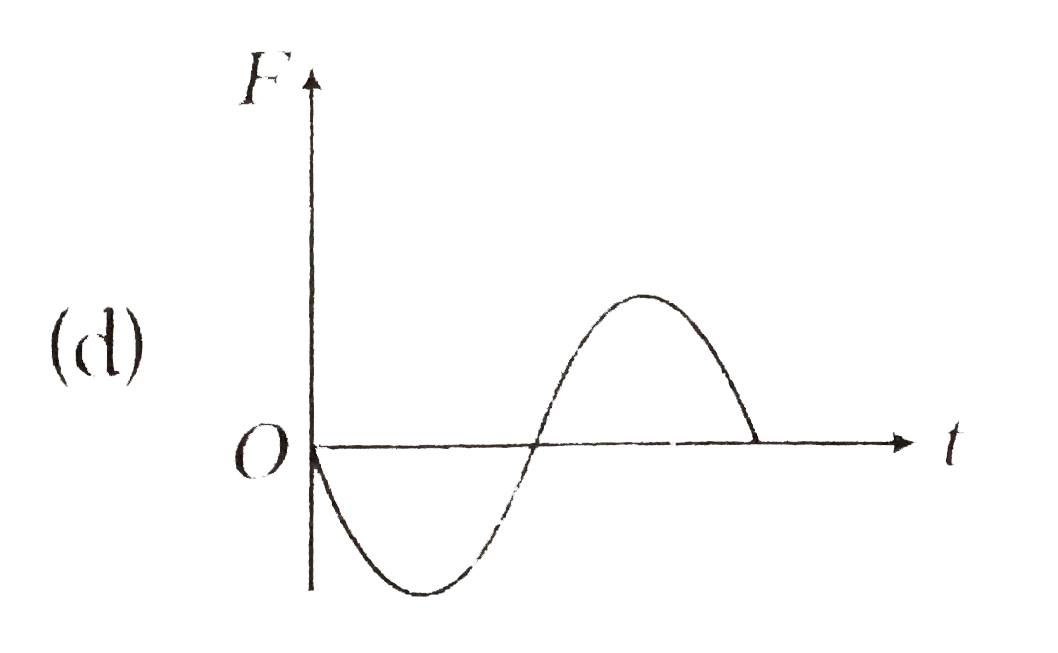
 The corresponding force-time graph of the partical will be
View SolutionThe displacement-time graph of a particle executing SHM is as shown in the figure.

The corresponding force-time graph of the particle is
(a)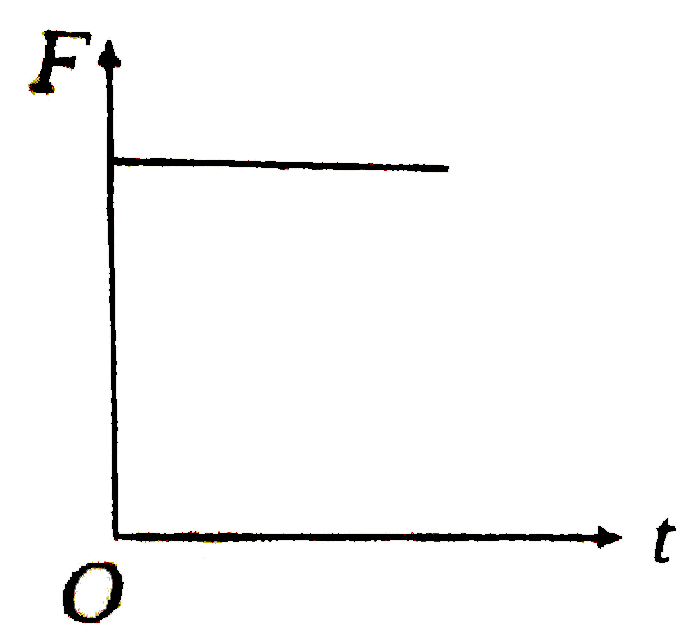
View Solution