Fig. 2.42 given below shows a velocity-time graph for a car starting from rest. The graph has three parts AB, BC and CD.
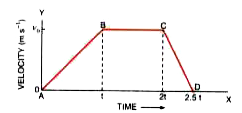
(i) State how is the distance travelled in any part determined from this graph.
(ii) Compare the distance travelled in part BC with the distance travelled in part AB.
(iii) Which part of graph shows motion with uniform (a) velocity (b) acceleration (c) retardation ?
(iv) (a) Is the magnitude of acceleration higher or lower than that of retardation ? Give a reason. (b) Compare the magnitude of acceleration and retardation.
(i) By finding the area enclosed by the graph in that part with the time axis (ii) 2:1
(iii) (a) BC (b) AB (c) CD (iv) (a) lower, as slope of line AB is less than that of the line CD, (b) 1:2.
Topper's Solved these Questions
- MOTION IN ONE DIMENSION BOOK - ICSECHAPTER - MOTION IN ONE DIMENSION EXERCISE - EXERCISE -2 (C)
3 Videos
- MOTION IN ONE DIMENSION BOOK - ICSECHAPTER - MOTION IN ONE DIMENSION EXERCISE - EXERCISE -2 (C) ( Multiple choice type :)
17 Videos
- MOTION IN ONE DIMENSION BOOK - ICSECHAPTER - MOTION IN ONE DIMENSION EXERCISE - EXERCISE -2 (B) ( Multiple choice type :)
3 Videos
- MEASUREMENTS AND EXPERIMENTATION BOOK - ICSECHAPTER - MEASUREMENTS AND EXPERIMENTATION EXERCISE - TOPIC 2 SIMPLE PENDULUM (4 Marks Questions )
1 Videos
- PRESSURE IN FLUIDS AND ATMOSPHERIC PRESSUREBOOK - ICSECHAPTER - PRESSURE IN FLUIDS AND ATMOSPHERIC PRESSUREEXERCISE - Exercise -4(B)Numericals
5 Videos
Similar Questions
Knowledge Check
In the given v-t graph the distance travelled by the body in 5 seconds will be
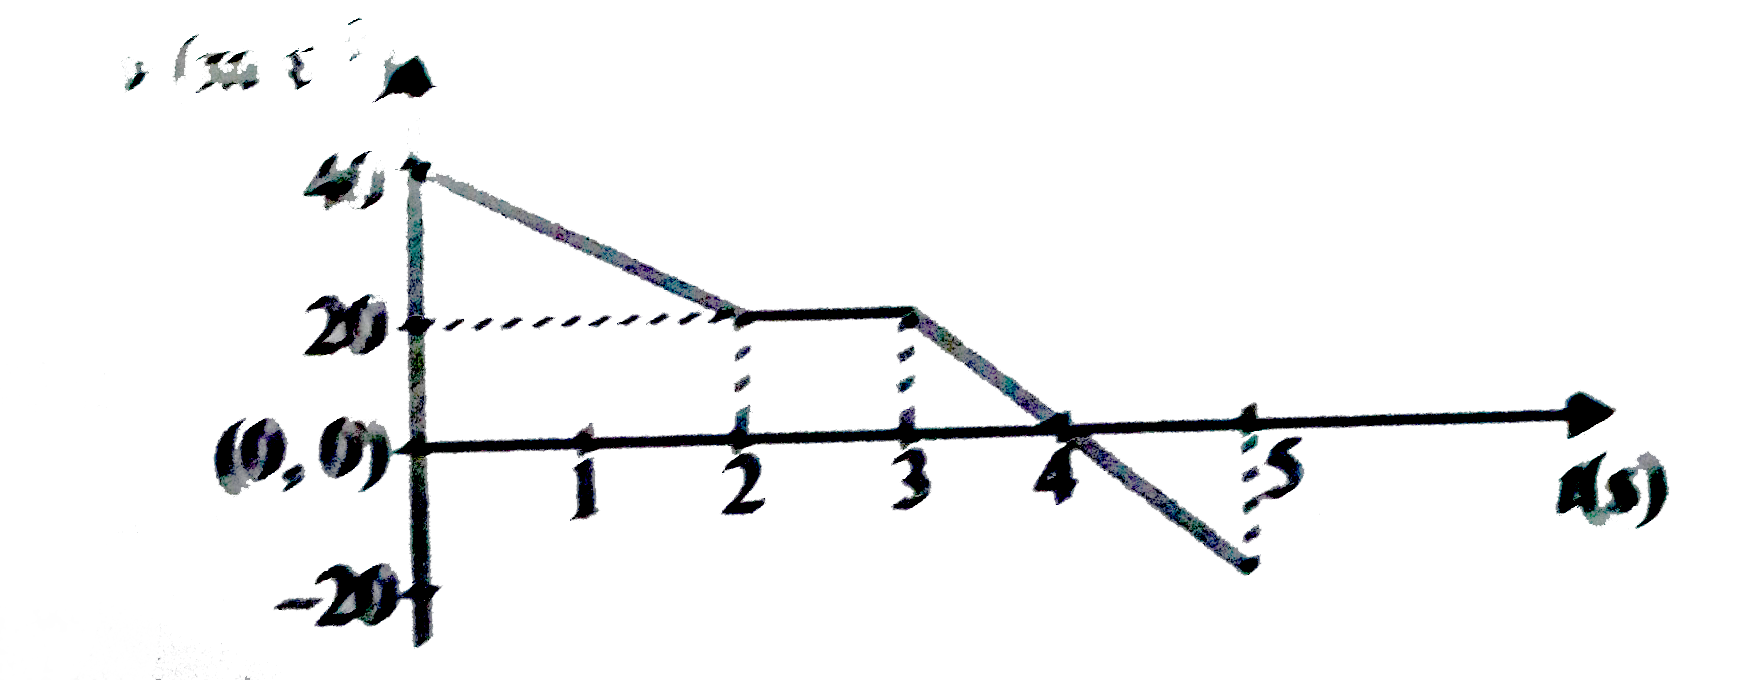 A100 mB80 mC40 mD20 m
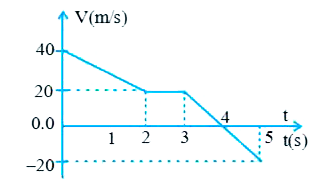
In the given v-t graph, the distance travelled by the body in 5 sec will be :
View SolutionDraw a velocity-time graph for a body moving with an initial velocity u and uniform acceleration a. Use this graph to find the distance travelled by the body in time t.
View SolutionA body starting from rest is moving with a uniform acceleration of 8ms2. Then the distance travelled by it in 5th second will be
View SolutionA car starting from rest accelerates uniformly to acquire a speed 20 km h−1 in 30 min. The distance travelled by car in this time interval will be :
View SolutionThe speed-time graph for a car is shown is Figure
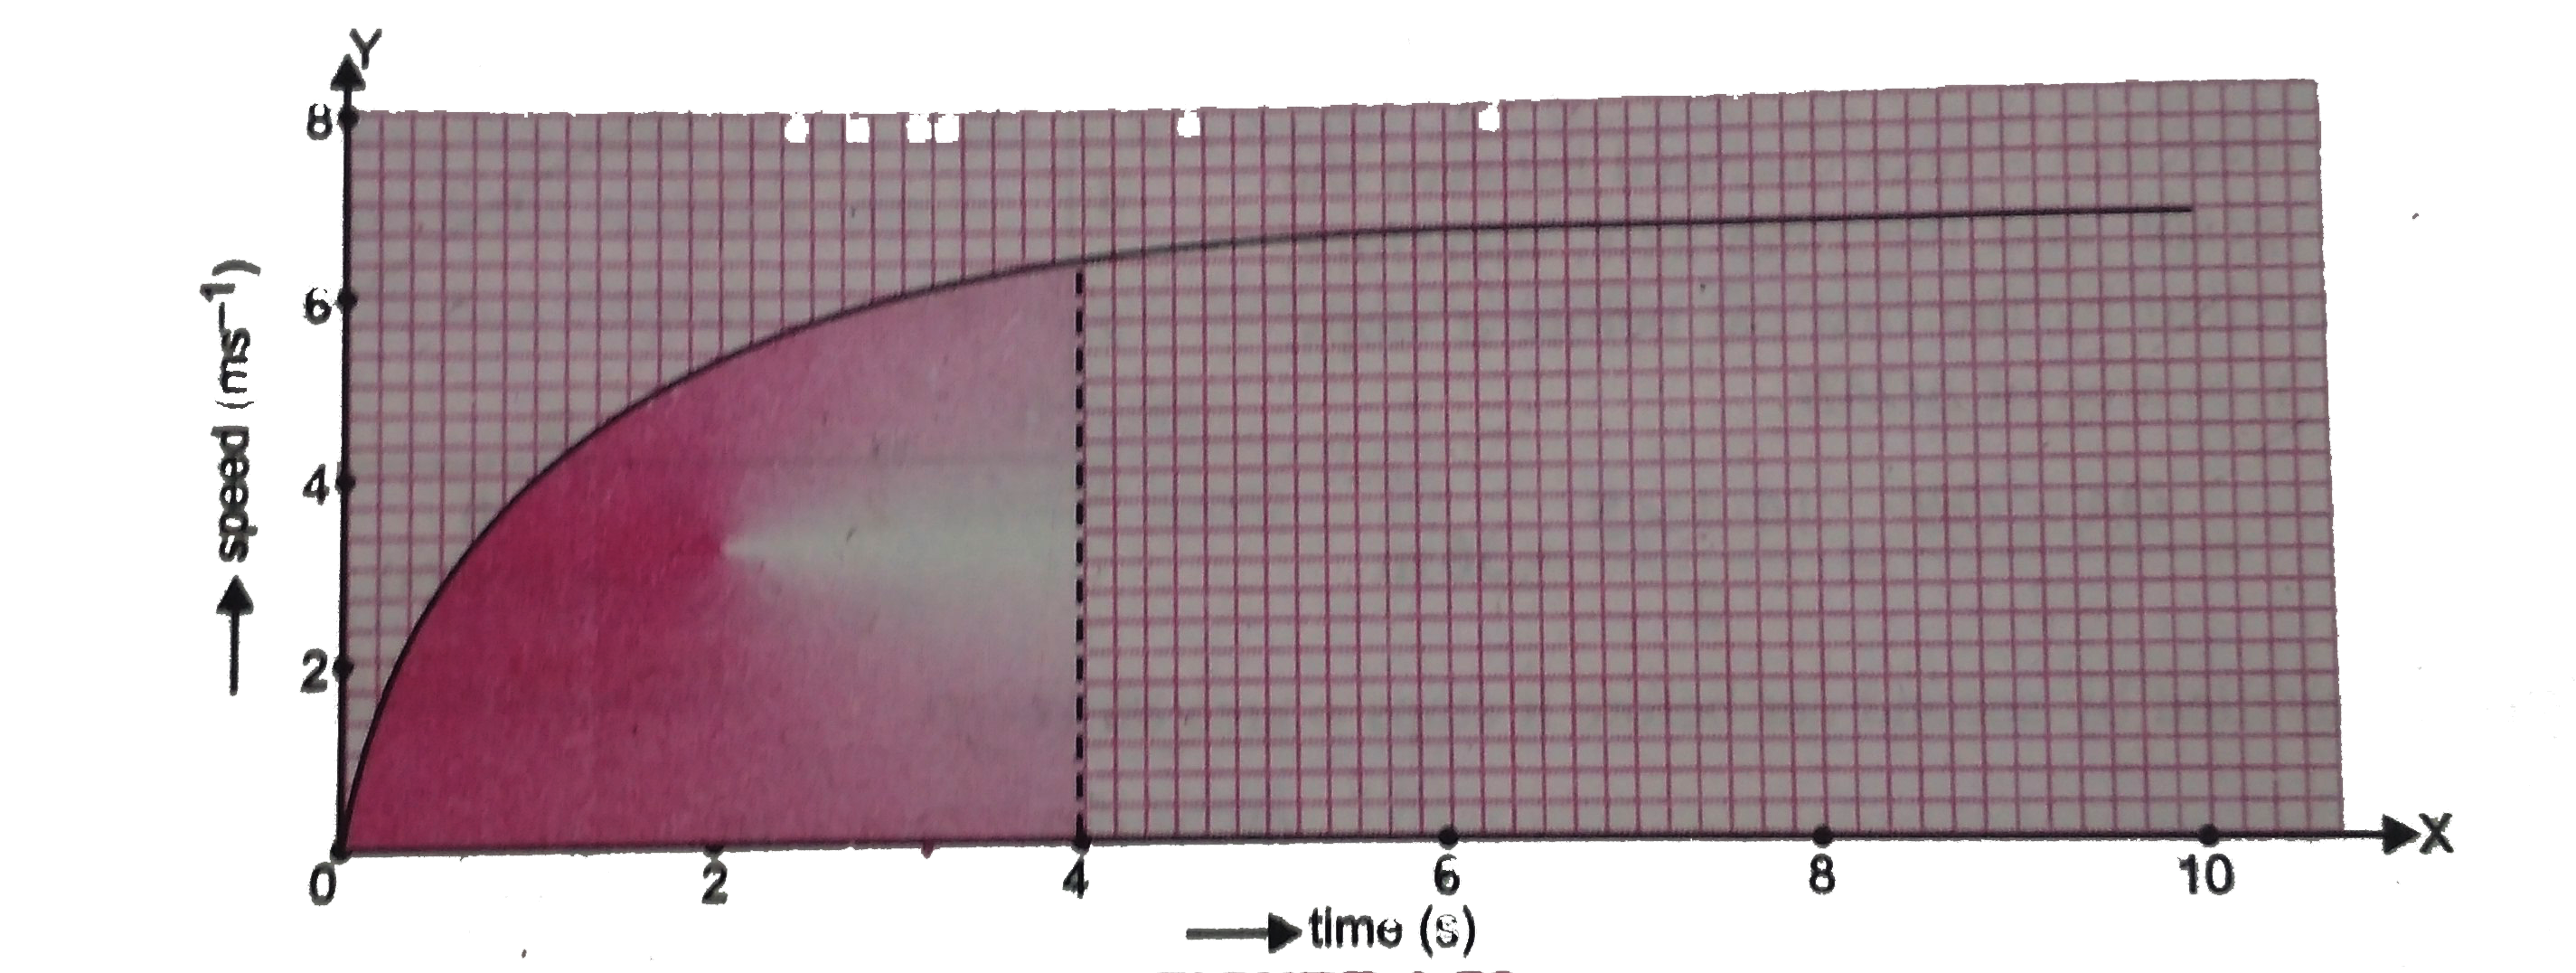
(a) Find how far does the car travel in the first 4 seconds. Shade the area on the graph that represents the distance travelled by the car during this period.
(b) Which part of the graph represents uniform motion of the car ?
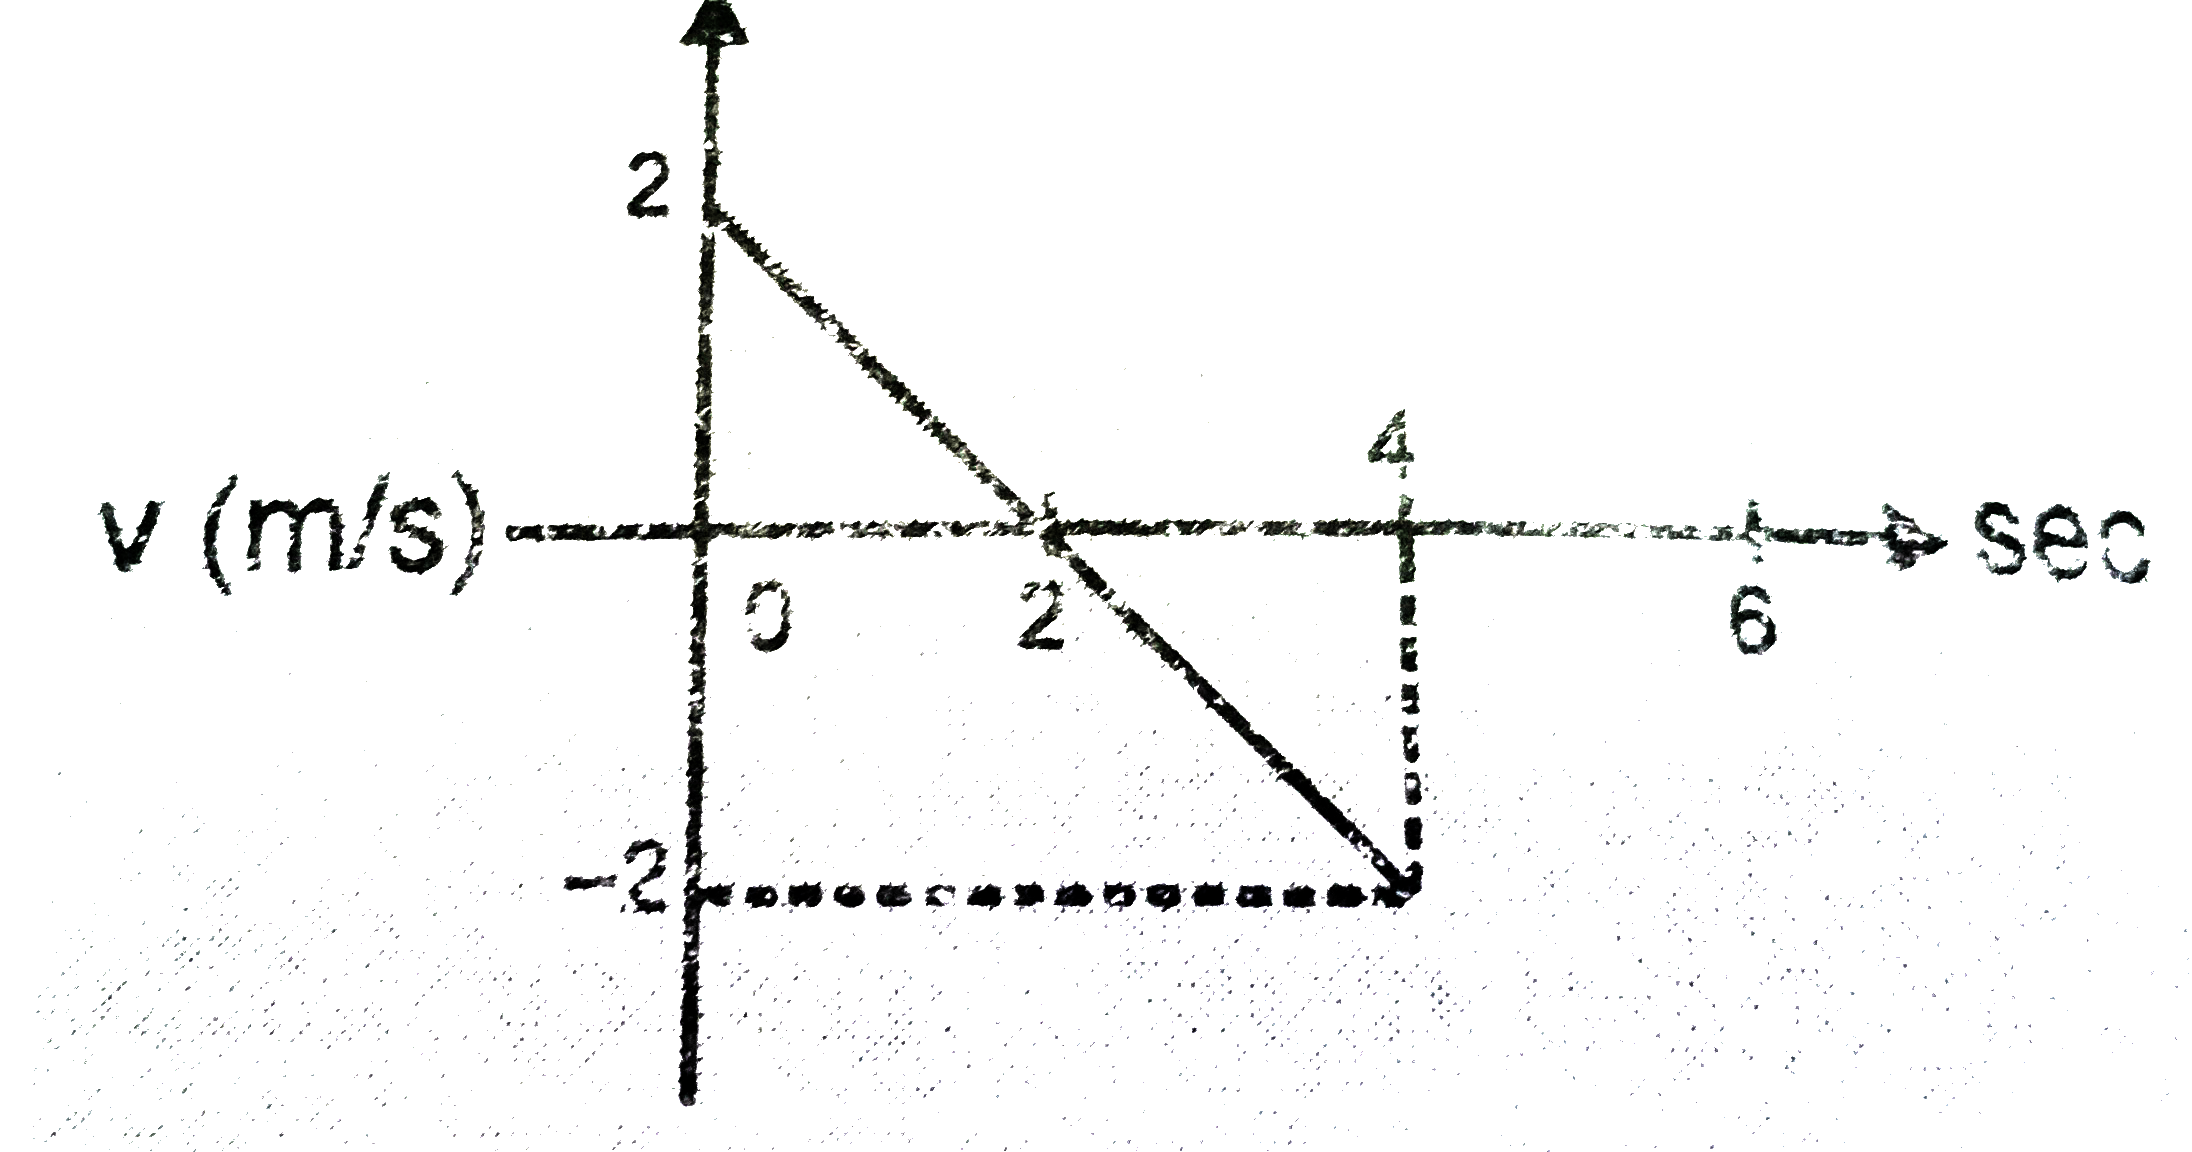
View SolutionVelocity time graph for a particle moving in a line is given.
Calculate the displacement of the particle and distance travelled in first 4 seconds.
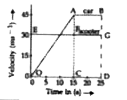
View SolutionThe velocity-time graphs of a car and a scooter are shown in the figure. (i) The difference between the distance travelled by the car and the scooter in 15 s and (ii) the time at which the car will catch up with the scooter are, respectively.
View Solution

