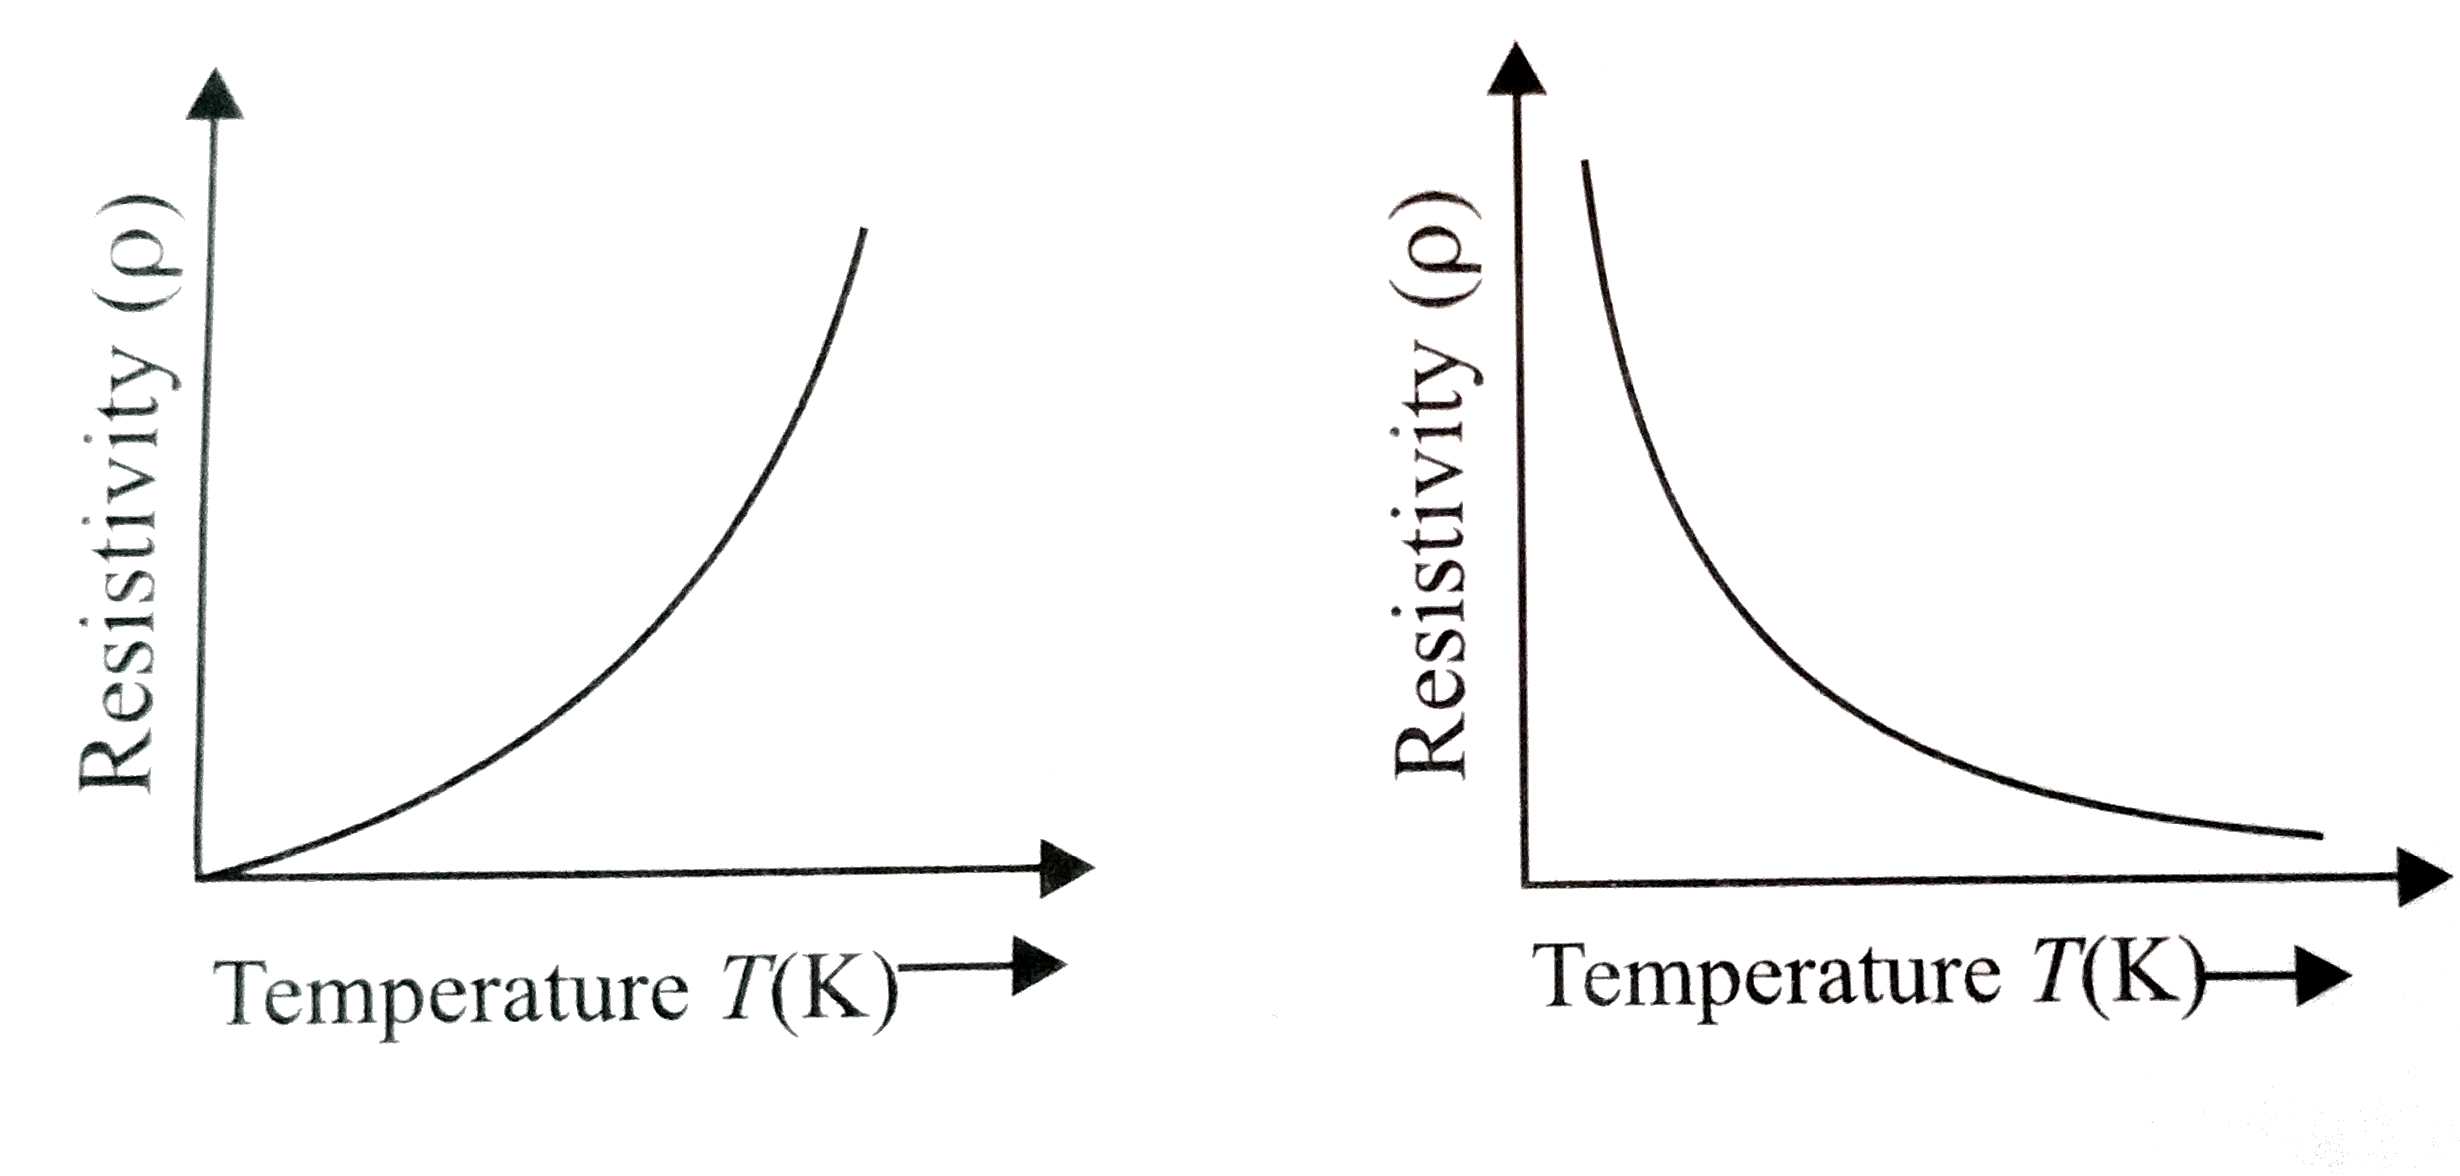
Figure (a) and figure (b) both are showing the variation of resistivity (p) with temperature (T) for some materials. Identify the types of these materials.

Conductor and semiconductor
Conductor and Insulator
Insulator and semiconductor
Both are conductor
The correct Answer is:A
In conductors due to increasein temperature the resistivity increases and in semiconductors if the decreases exponentially.
Topper's Solved these Questions
- BOOK - NCERT FINGERTPS ENGLISHCHAPTER - CURRENT ELECTRICITYEXERCISE - ELECTRICAL ENERGY, POWER8videos
CURRENT ELECTRICITY
- BOOK - NCERT FINGERTPS ENGLISHCHAPTER - CURRENT ELECTRICITYEXERCISE - COMBINED OF RESISTORS;23videos
CURRENT ELECTRICITY
- BOOK - NCERT FINGERTPS ENGLISHCHAPTER - CURRENT ELECTRICITYEXERCISE - RESISTIVITY7videos
CURRENT ELECTRICITY
- BOOK - NCERT FINGERTPS ENGLISHCHAPTER - COMMUNITCATION SYSTEMSEXERCISE - Assertion And Reason30videos
COMMUNITCATION SYSTEMS
- BOOK - NCERT FINGERTPS ENGLISHCHAPTER - DUAL NATURE OF RADIATION AND MATTER EXERCISE - Assertion And Reason15videos
DUAL NATURE OF RADIATION AND MATTER
Similar Questions
Show on a graph, the variation of resistivity with temperature for a typical semiconductor.
View SolutionWhich of the following graph represents the variation of resistivity (ρ) with temperature (T) for copper?
View SolutionThe variation of magnetic susceptibility (χ) with absolute temperature T for a ferromagnetic material is
View SolutionThe correct graph which shows the variation of paramagnetic susceptibility S with temperature T is
View SolutionDraw a graph showing variation of resistivity with temperature for nichrome. Which property of nichrome is used to make standard resistance coils?
View SolutionDefine resistivity of a conductor. Plot a graph showing the variation of resistivity with temperature for a metallic conductor. How does one explain such a behaviour, using the mathematical expression of the resistivity of a material
View SolutionShow variation of resistivity of copper as a function of temperature in a graph.
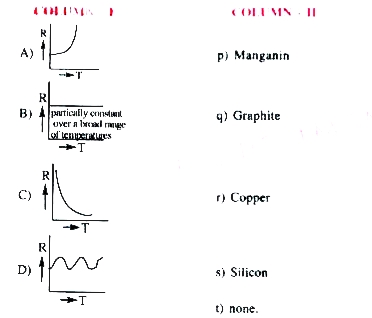
View SolutionEach figure in Column - I shows the variation of resistance with temperature. Some materials are mentioned in Column - II. Match Column - I with Column - II.
 View Solution
Plot a graph showing variation of current versus voltage for the material Ga.
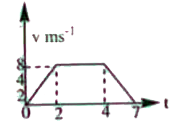
View SolutionFigure given here shows the variation of velocity of a particle with time.
Find the displacement. ,
 View Solution

