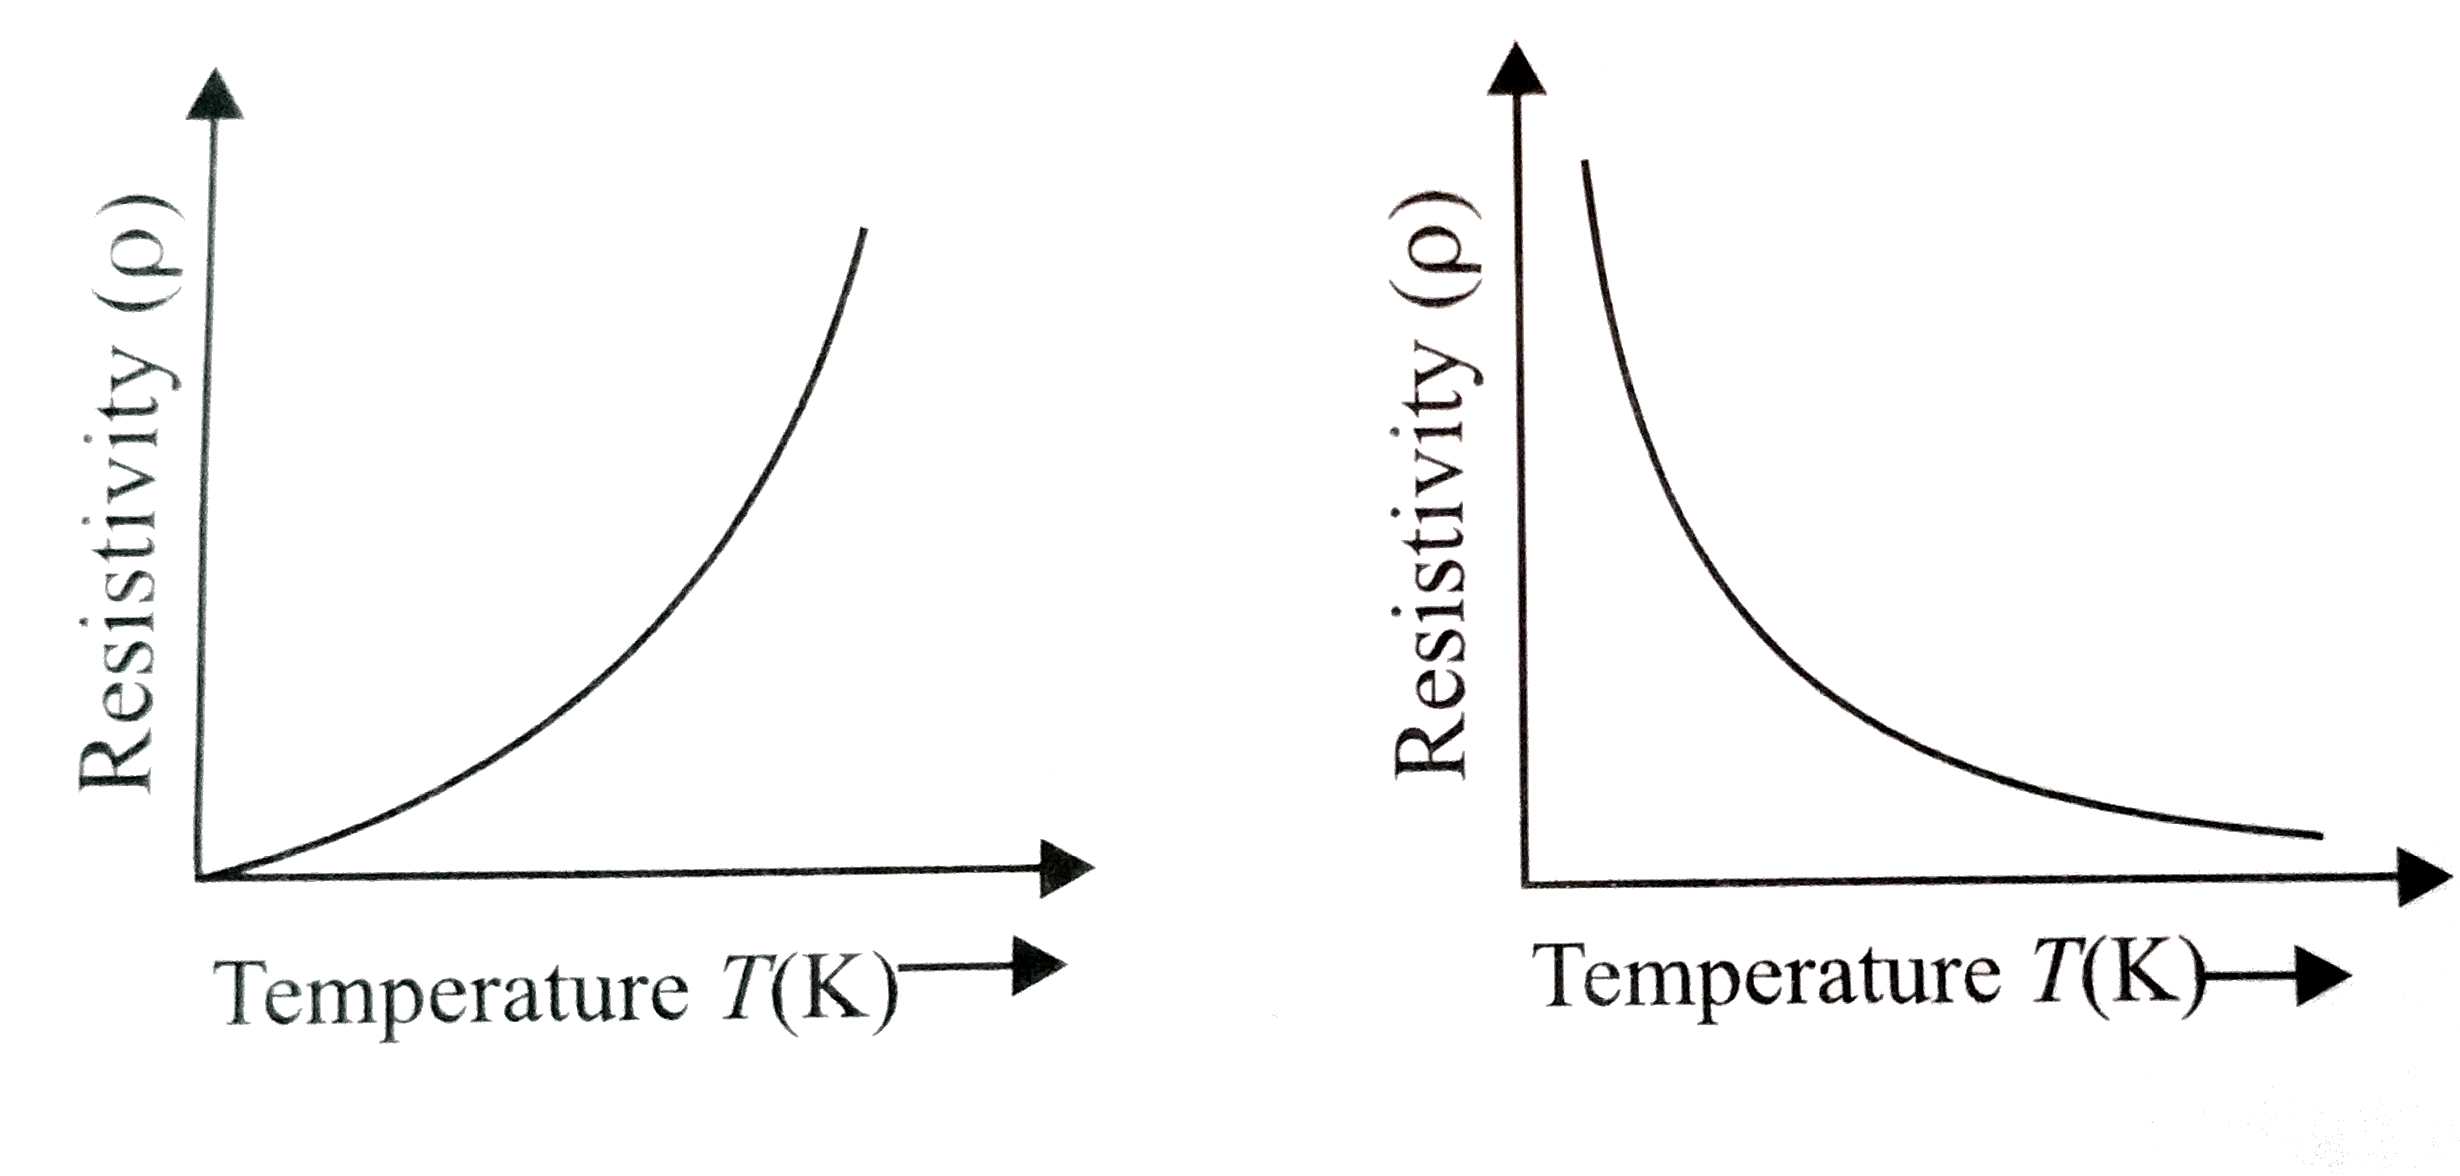
Draw a graph showing variation of resistivity with temperature for nichrome. Which property of nichrome is used to make standard resistance coils?
Step-by-Step Solution:
1. Understanding Resistivity and Temperature Relationship:
- The resistivity of materials generally changes with temperature. For metals, resistivity tends to increase with temperature. Nichrome, an alloy of nickel and chromium, exhibits this behavior.
2. Graphing Resistivity vs. Temperature:
- On the x-axis, we will plot the temperature (T) and on the y-axis, we will plot the resistivity (ρ).
- At low temperatures, the resistivity starts at a certain value (ρ₀) and increases as the temperature rises.
- The relationship can be represented by the equation:
ρ=ρ0(1+αΔT)
where ρ₀ is the resistivity at a reference temperature, α is the temperature coefficient of resistivity, and ΔT is the change in temperature.
3. Drawing the Graph:
- Start at a point on the y-axis representing the initial resistivity (ρ₀) at 0°C.
- As you move to the right (increasing temperature), draw a curve that initially rises steeply and then begins to rise more linearly.
- The graph should show a clear upward trend, indicating that as temperature increases, resistivity increases.
4. Identifying Properties of Nichrome:
- Nichrome is known for its low resistivity and high melting point. These properties are crucial for its application in making standard resistance coils.
- The low resistivity ensures that the coils can carry current efficiently without excessive energy loss.
- The high melting point allows the coils to operate at high temperatures without melting or degrading.
5. Final Answer:
- The graph shows a linear increase in resistivity with temperature for nichrome.
- The properties of nichrome used to make standard resistance coils are its low resistivity and high melting point.
- The resistivity of materials generally changes with temperature. For metals, resistivity tends to increase with temperature. Nichrome, an alloy of nickel and chromium, exhibits this behavior.
- On the x-axis, we will plot the temperature (T) and on the y-axis, we will plot the resistivity (ρ).
- At low temperatures, the resistivity starts at a certain value (ρ₀) and increases as the temperature rises.
- The relationship can be represented by the equation:
ρ=ρ0(1+αΔT)
where ρ₀ is the resistivity at a reference temperature, α is the temperature coefficient of resistivity, and ΔT is the change in temperature.
- Start at a point on the y-axis representing the initial resistivity (ρ₀) at 0°C.
- As you move to the right (increasing temperature), draw a curve that initially rises steeply and then begins to rise more linearly.
- The graph should show a clear upward trend, indicating that as temperature increases, resistivity increases.
- Nichrome is known for its low resistivity and high melting point. These properties are crucial for its application in making standard resistance coils.
- The low resistivity ensures that the coils can carry current efficiently without excessive energy loss.
- The high melting point allows the coils to operate at high temperatures without melting or degrading.
- The graph shows a linear increase in resistivity with temperature for nichrome.
- The properties of nichrome used to make standard resistance coils are its low resistivity and high melting point.
Similar Questions
Knowledge Check
Why are constantan and manganin used for making standard resistances ?
Atemperature independent resistivityBvery weak temperature dependent resistivityCstrong dependence of resistivity with temperatureDmechanical strengthFigure (a) and figure (b) both are showing the variation of resistivity (p) with temperature (T) for some materials. Identify the types of these materials.
 AConductor and semiconductorBConductor and InsulatorCInsulator and semiconductorDBoth are conductor
Show on a graph, the variation of resistivity with temperature for a typical semiconductor.
View SolutionDraw a graph showing the variation of decay rate with number of active nuclei.
View SolutionDefine resistivity of a conductor. Plot a graph showing the variation of resistivity with temperature for a metallic conductor. How does one explain such a behaviour, using the mathematical expression of the resistivity of a material
View SolutionShow variation of resistivity of copper as a function of temperature in a graph.
View SolutionDraw a graph to show the variation in density of water with temperature in the temperature range from 0∘C to 10∘C.
View SolutionA constant potential difference is applied across a resistance. Consider variation of resistance with temperature. Which graph represents best the variation of power produced in resistance versus resistance?
View Solution