Figure given here shows the variation of velocity of a particle with time.
Find the displacement. ,
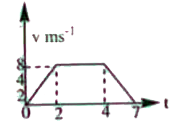
i)Displacement during the time intervals.
a) 0 to 2 sec. b) 2 to 4 sec. and c) t=6 sec.
iii)Average acceleration
a)between t=0 to t=4 sec.
b)between t=0 to t=7 sec.
iv)Average velocity during the motion.
i)Displacement=Area enclosed between
v-t graph and time axis.
ii)Acceleration=slope of v-t curve
iii)Average acceleration =Total change in velocityTotal time
iv) Average velocity =Total displacementTotal time
i)a) 8m b)15m c)12m
iia) 4ma−2 b)0 c) −8/3ms−2
iii)a) 2m/s2 b)0 iv) 367m−1
Similar Questions
Figure given here shows the variation of velocity of a particle with time.
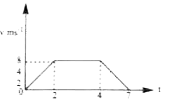
Find the following:
(i) Displacement during the time intervals.
(a) 0 to 2 sec., (b) 2 to 4 sec. and (c) 4 to 7 sec
(ii) Accelerations at
(a)t = 1 sec, (b) t = 3 sec. and (c)t = 6 sec.
(iii) Average acceleration
(a) between t = 0 to t = 4 sec.
(b) between t = 0 to t = 7 sec.
(iv) Average velocity during the motion.
View SolutionVariation of acceleration a of a particle executing SHM with displacement x is
View SolutionThe two graphs of a given projectile show that variation of vertical velocity component with time and with horizontal displacement. What is the x-component of velocity in m/s ?

View SolutionThe figure shows the velocity (v) of a particle plotted against time (t).
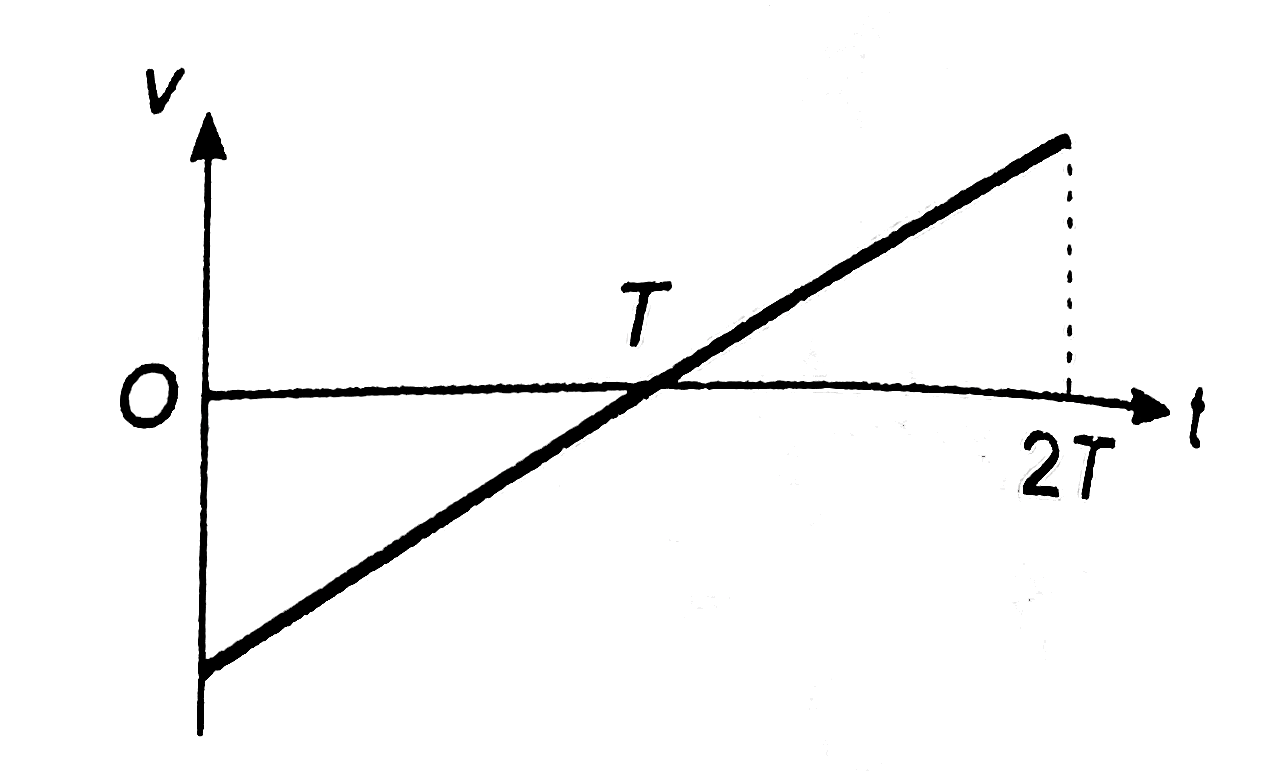
View SolutionThe figure shows the velocity (v) of a particle plotted against time (t).

View Solutionvelocity time graph of a particle is shown in figure. Find displacement of the particle.
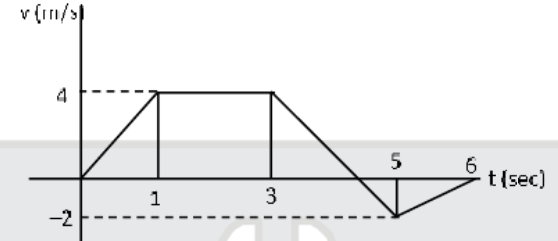
View SolutionThe given graph shows the variation of velocity with displacement. Which one of the graph given below correctly represents the variation of acceleration with displacement :-
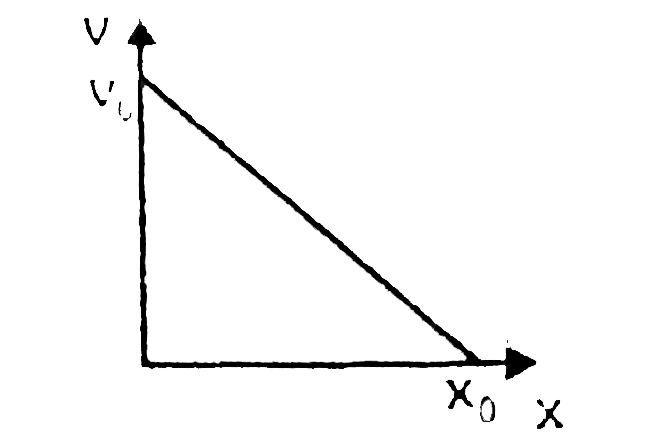
View SolutionThe given graph shows the variation of velocity with displacement. Which one of the graphs given below correctly represents the variation of acceleration with displacement ?

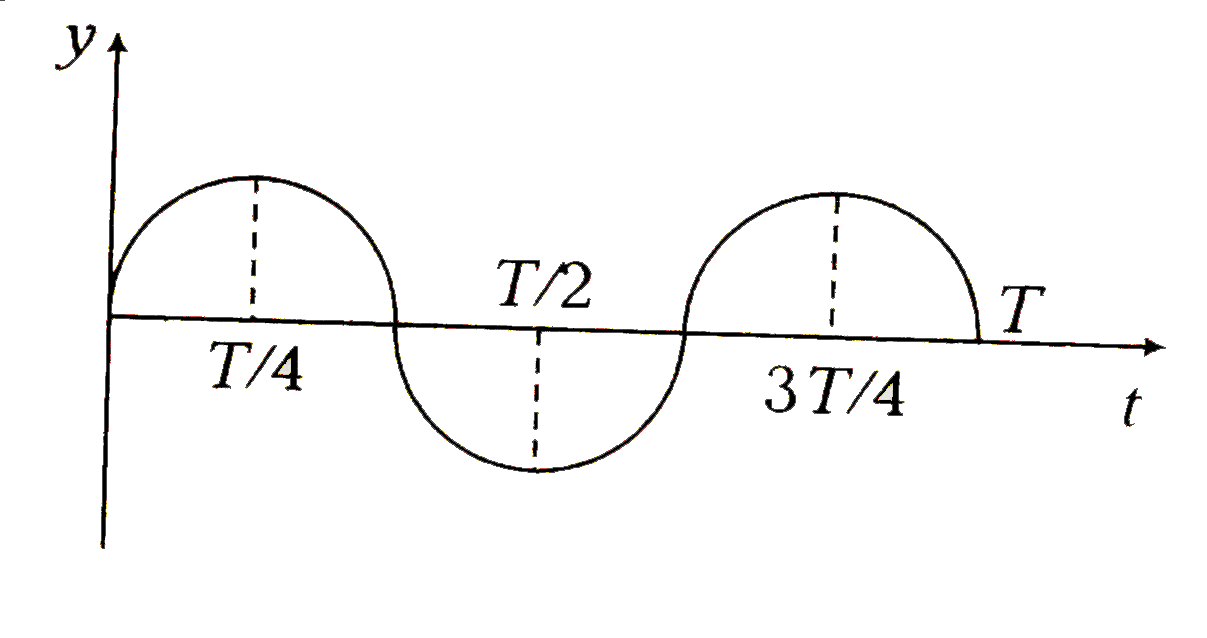
View SolutionThe graph shows the variation of displacement of a particle executing S.H.M with time. We inference form this graph that :-
_E01_037_Q01.png)
View SolutionThe graph shows the variation of displacement of a particle execting SHM with time . We infer from this graph that
View Solution
