Figure illustrates a cycle conducted with n moles of an ideal gas. In the states a and b the gas temperatures are Ta and Tb respectively. Temperature of the gas in the state C is ltbr) 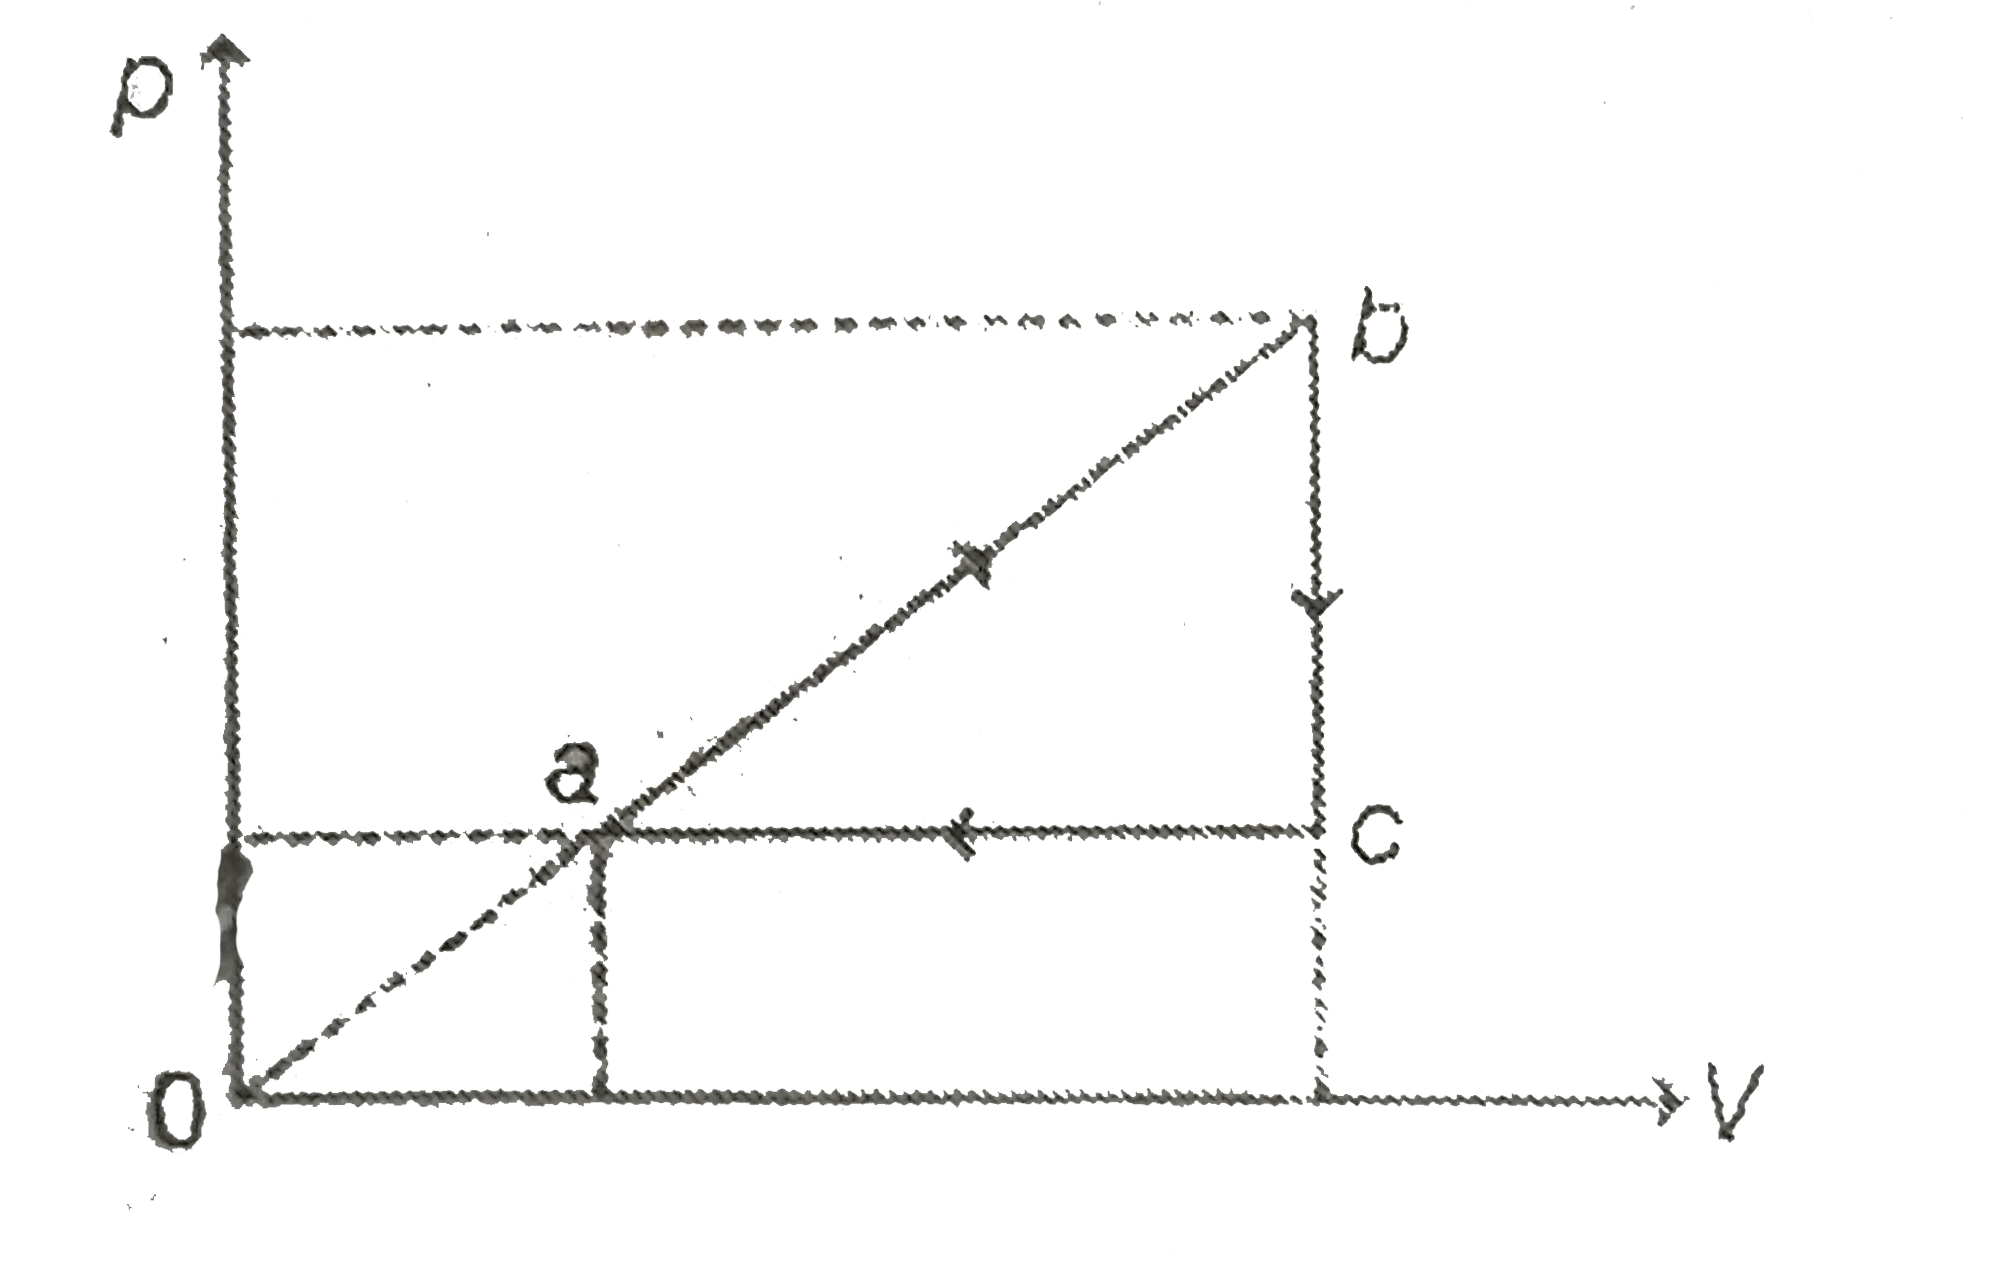
√TaTb
Ta+Tb
TaTbTa+Tb
(Ta+Tb)/2
The correct Answer is:A
Step by step video, text & image solution for Figure illustrates a cycle conducted with n moles of an ideal gas. In the states a and b the gas temperatures are T_(a) and T_(b) respectively. Temperature of the gas in the state C is ltbr) by Physics experts to help you in doubts & scoring excellent marks in Class 11 exams.
Updated on:21/07/2023Topper's Solved these Questions
Similar Questions
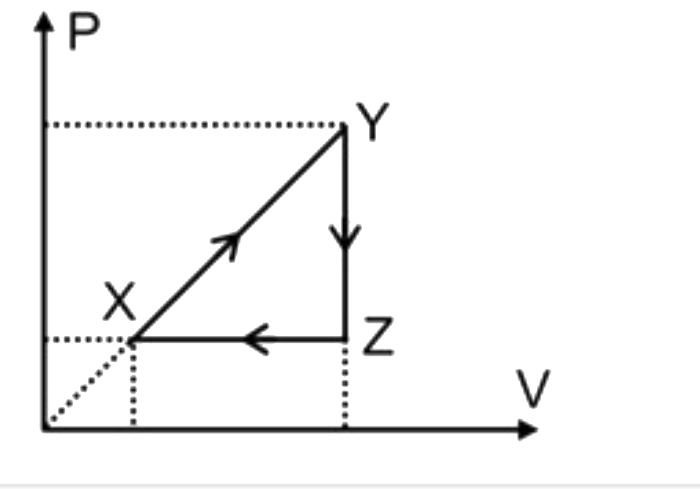
In the show indicator diagram over pressure - volume scales 'n' moles of an ideal gas is cycled . If the temperature of the gas in the state X and Y are respectively TXandTY . Temperature of the gas in the state Z is the (All temperature are in absolute scale )
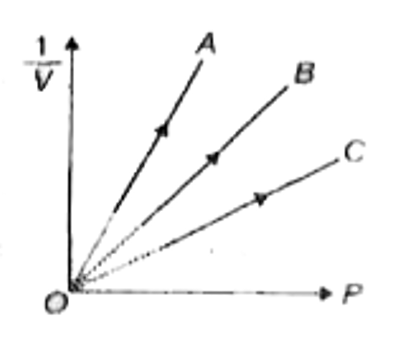
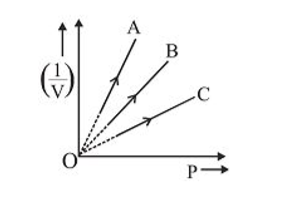
View SolutionFigure shows the isotherms of a fixed mass of an ideal gas at three temperatures TA,TB and TC , then
View Solution
Knowledge Check
In an adiabatic expansion of a gas initial and final temperatures are T1and T2 respectively, then the change in internal energy of the gas is
ARλ(T2−T1)BRλ−1(T1−T2)CR(T1−T2)DZeroThe specific heat of an ideal gas varies with temperature T as
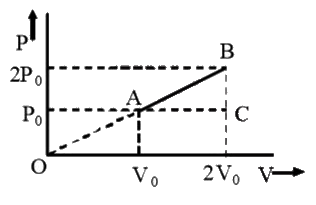
AT1BT2CT−2DT0n' moles of an ideal gas undergoes a process A→B as shown in the figure. The maximum temperature of the gas during the process will be:
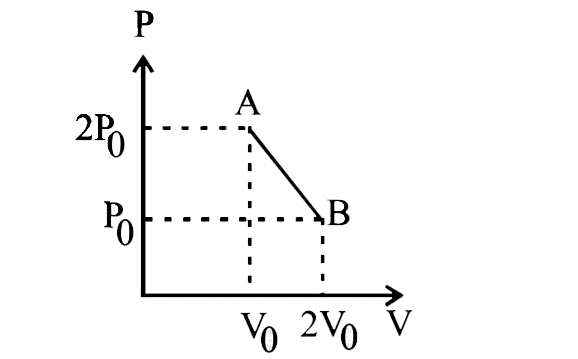 A9P0V02nRB9P0V0nRC9P0V04nRD3P0V02nR
Figure shows the isotherms of fixed mass of an ideal gas at three temperatures TA.TB and TC then:-
View SolutionWhat is the equation of state of an ideal gas for n moles ?
View SolutionOne mole of monatomic gas is brought from state A to state B. The initial temperature at A is T0. The temperature at B will be –
View SolutionFigure shows graphs of pressure vs density for an ideal gas at two temperatures Tt and T2
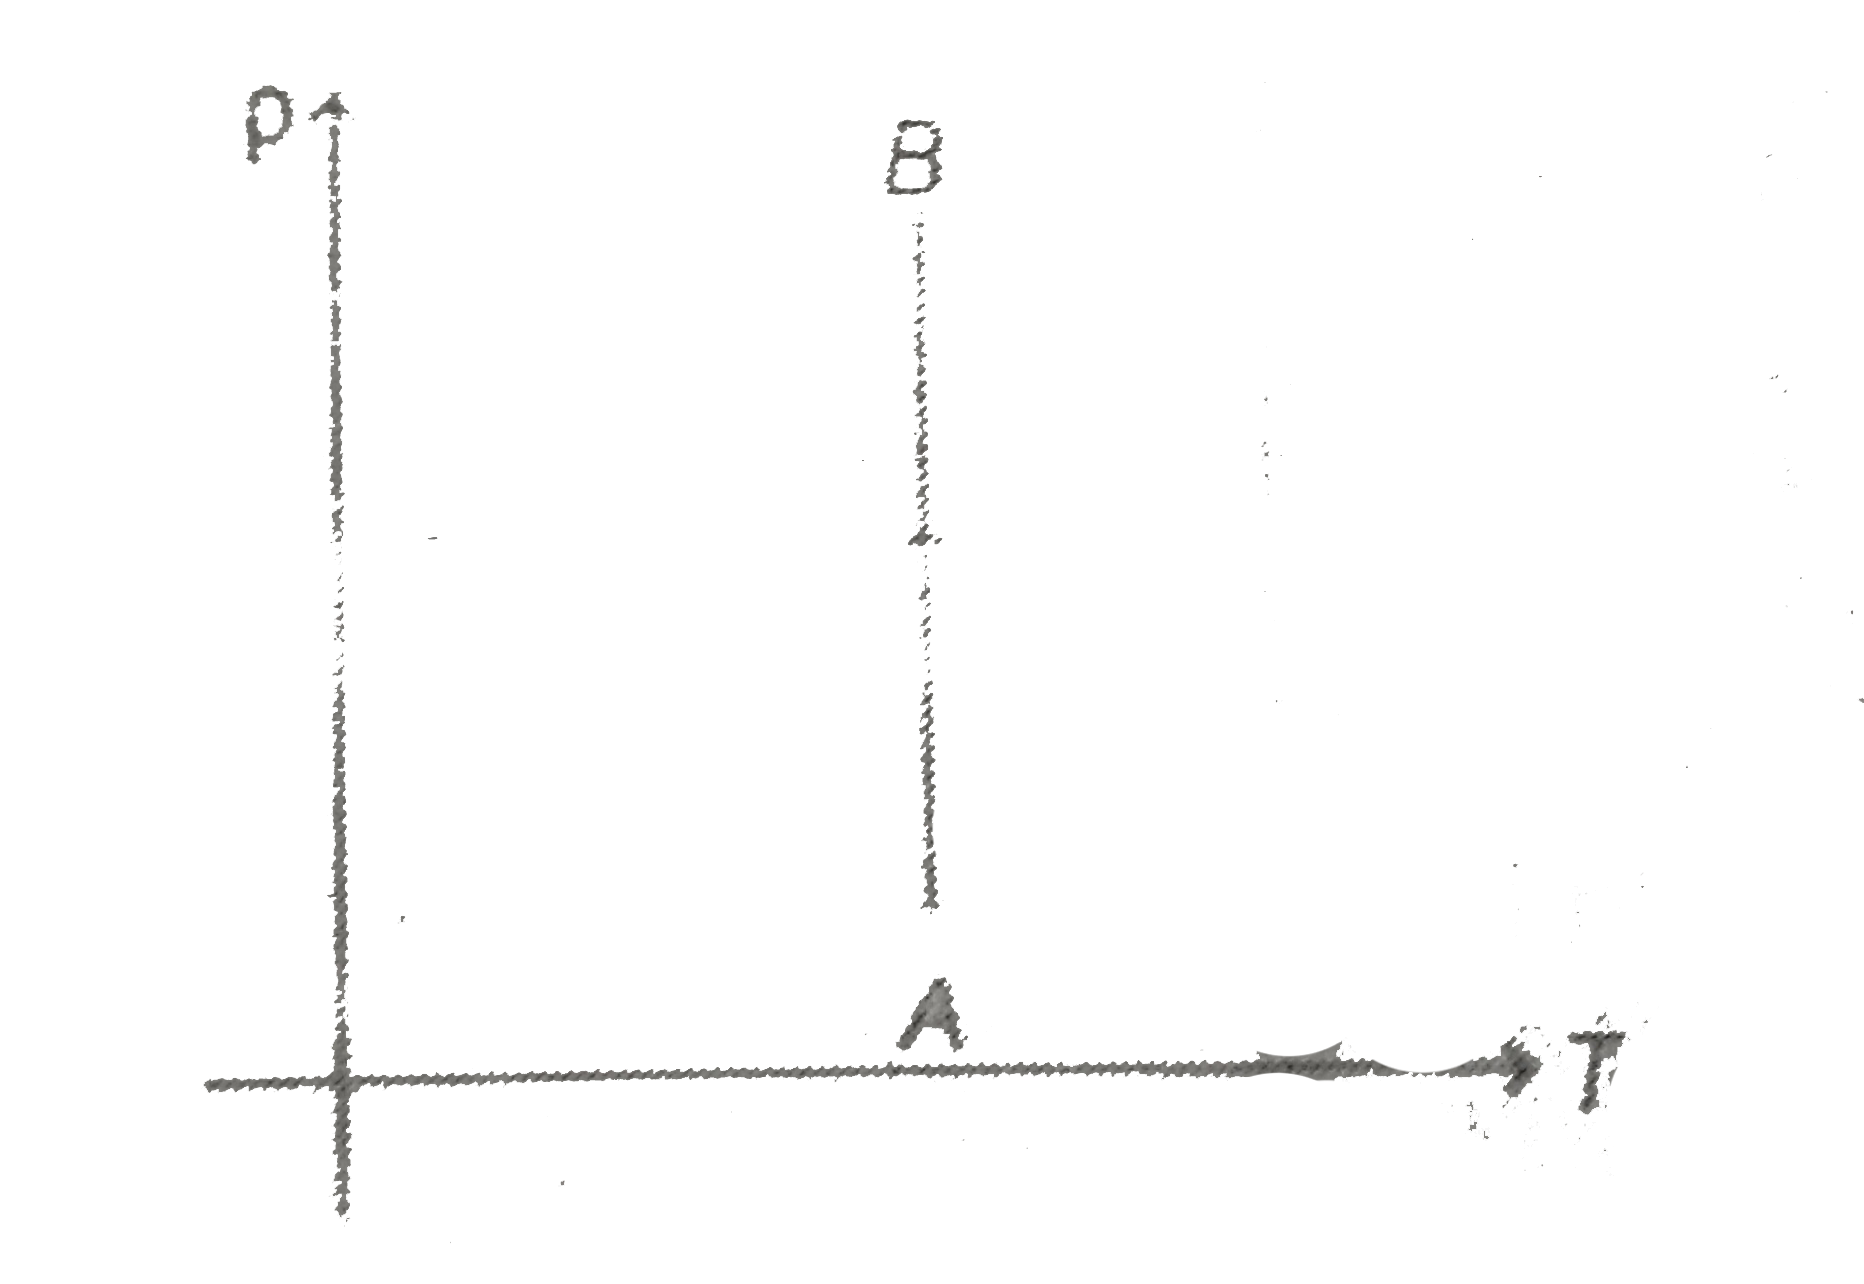
View SolutionThe ednsity (ρ) of an ideal gas varies with temperature T as shown in figure. Then
View Solution
