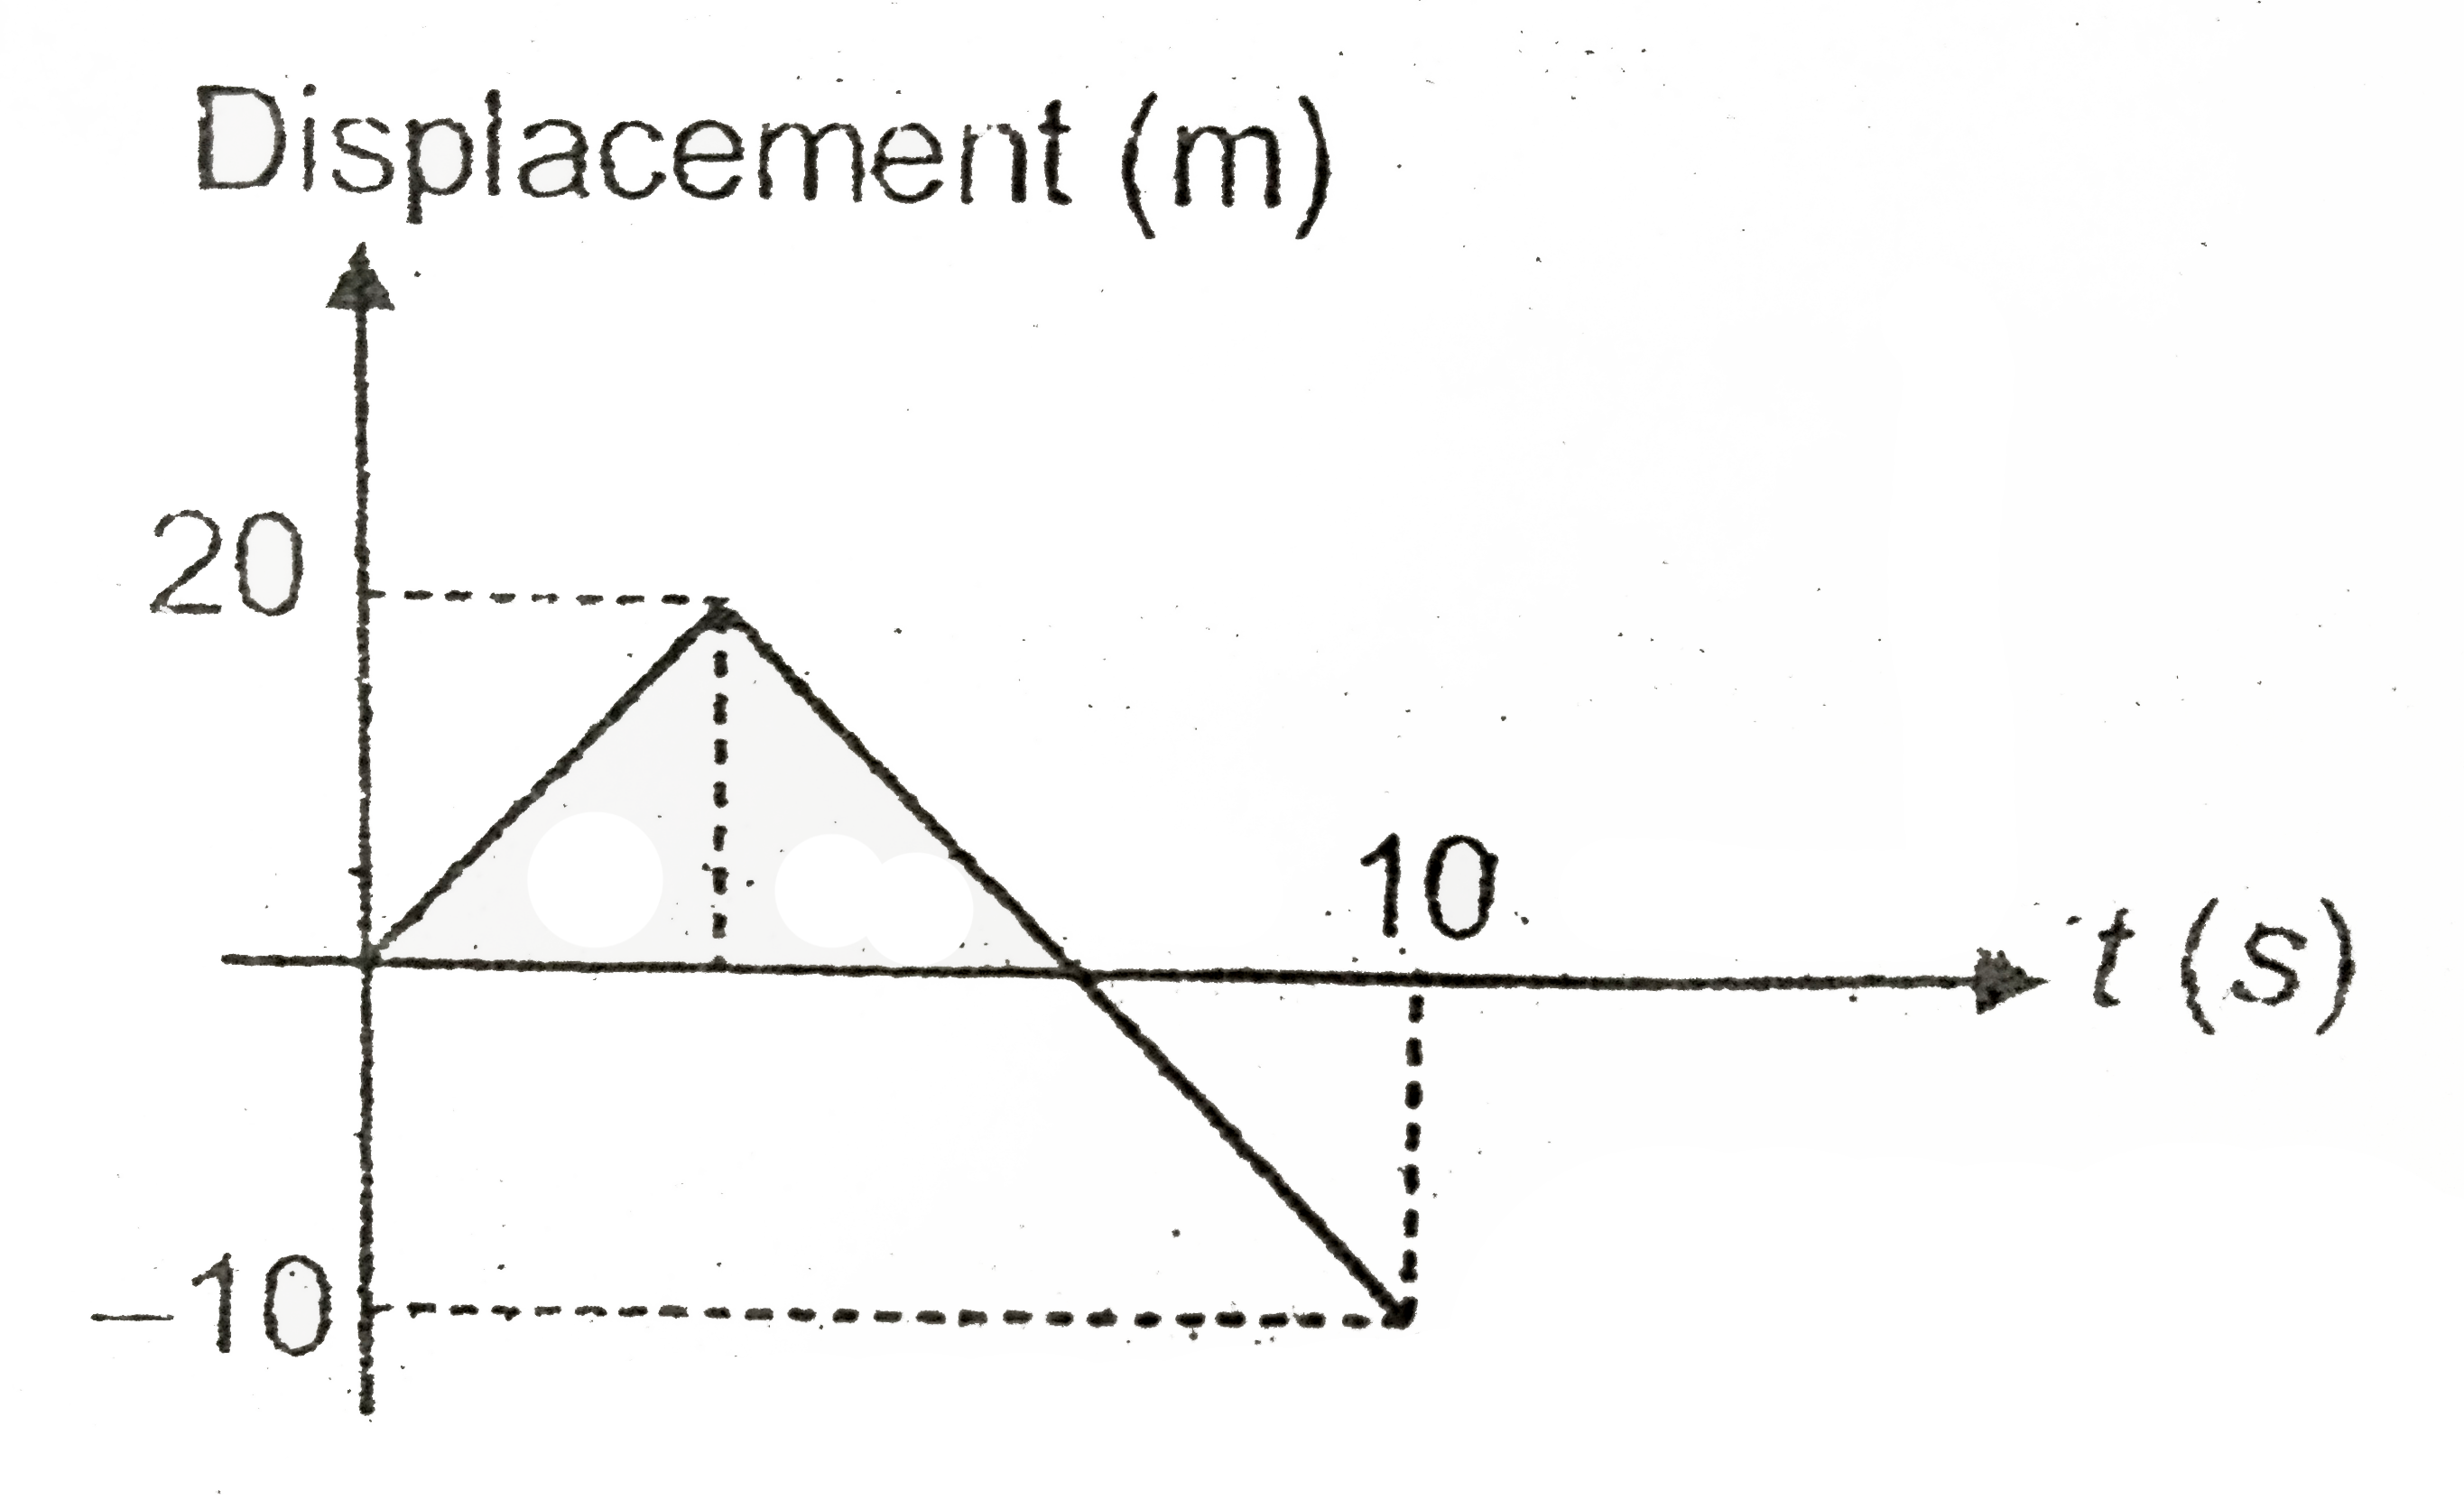
Figure shows the x-t plot of a particle moving along a straight line. Let and , be average speeds in time intervals 1 and 2 respectively. Then

A
B
C
D
Data is insufficient
Video Solution
Text Solution
The correct Answer is:A
In time interval 1, magnitude of net displacement is more as compared to that time interval 2 i.e. ,
|
Updated on:21/07/2023
Topper's Solved these Questions
- BOOK - SCIENCE OLYMPIAD FOUNDATION CHAPTER - MOTION EXERCISE - ACHIEVERS SECTION (HOTS)5videos
MOTION
- BOOK - SCIENCE OLYMPIAD FOUNDATION CHAPTER - GRAVITATION EXERCISE - ACHIEVERS SECTION (HOTS)5videos
GRAVITATION
- BOOK - SCIENCE OLYMPIAD FOUNDATION CHAPTER - NSO QUESTION PAPER 2016 SET A EXERCISE - ACHIEVERS SECTION2videos
NSO QUESTION PAPER 2016 SET A
Similar Questions
Knowledge Check
- Question 1 - Select One or More
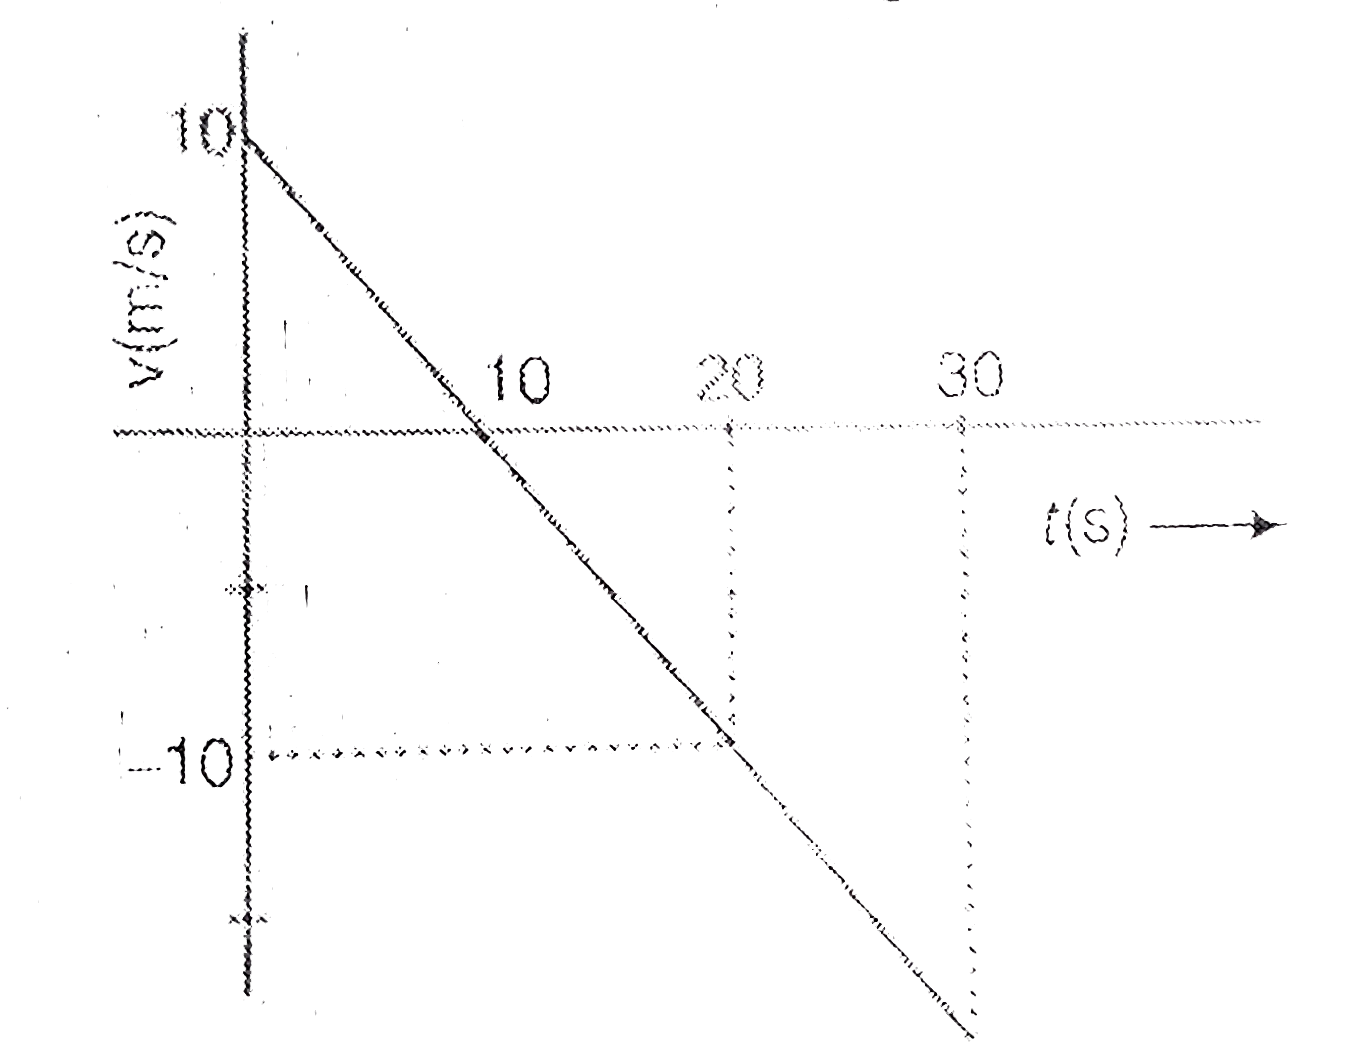
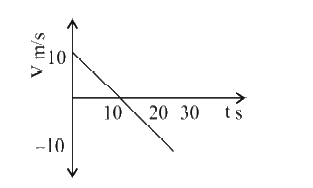
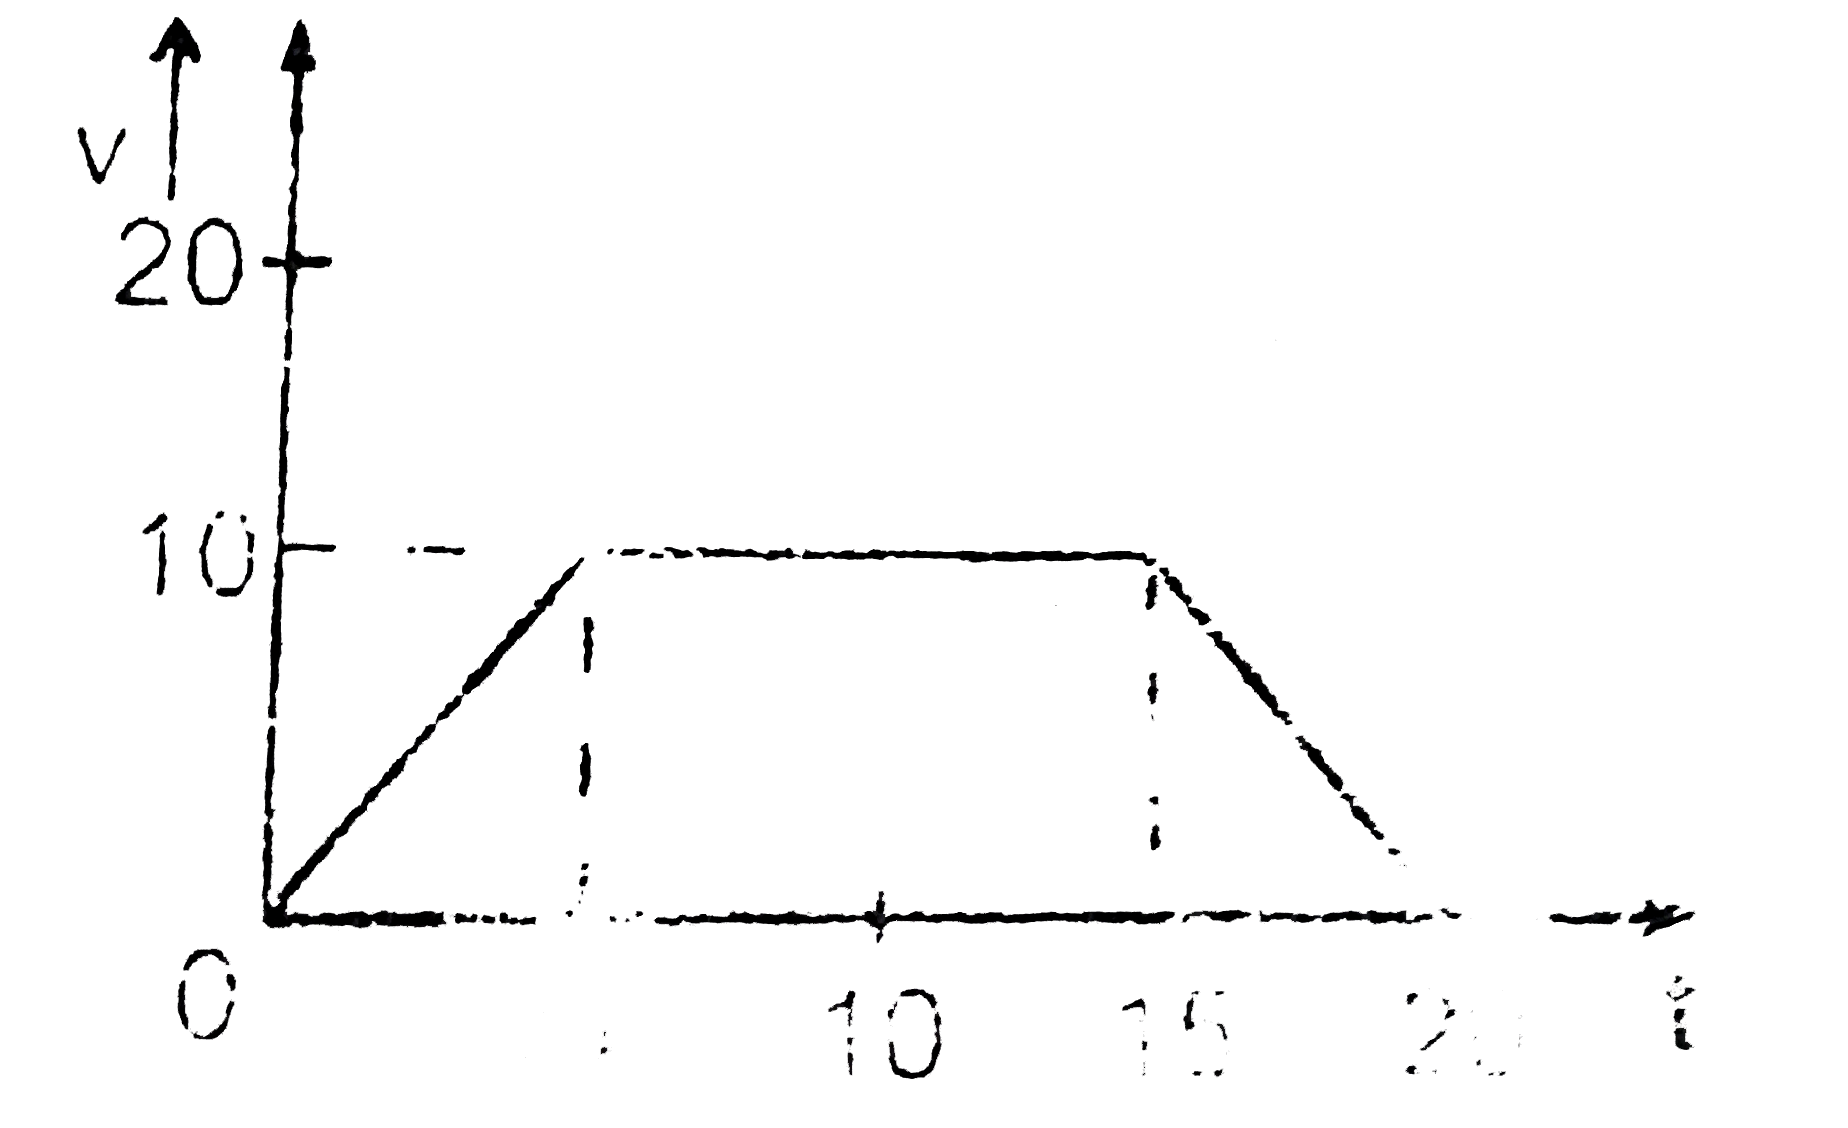
The velocity-time plot for a particle moving on a straight line is shown in figure.
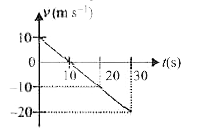 AThe particle has a constant acceleration.BThe particle has never tumed around.CThe particle has zero displacement.DThe average speed in the interval 0 to 10 s is the same as the average speed in the interval 10s to 20 s.
 - Question 2 - Select One
The position (x) - time (t) graph for a particle moving along a straight line is shown in figure. The average speed of particle in time interval t = 0 to t = 8 s is
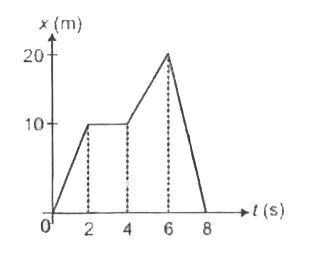 AZeroB5 m/sC7.5 m/sD9.7 m/s
 - Question 3 - Select One or More
The velocity time plot for a particle moving on straight line is shown in the figure.
 AThe particle has a constant accelerationBThe particle has nevedr turned aroundCThe paeticle has zero displacement.DThe average speed in the interval 0 to 10 s is the same as the average speed in the interval 10 s to 20s.
The velocity- time plot for a particle moving on a straight line is shown in the figure
 View Solution
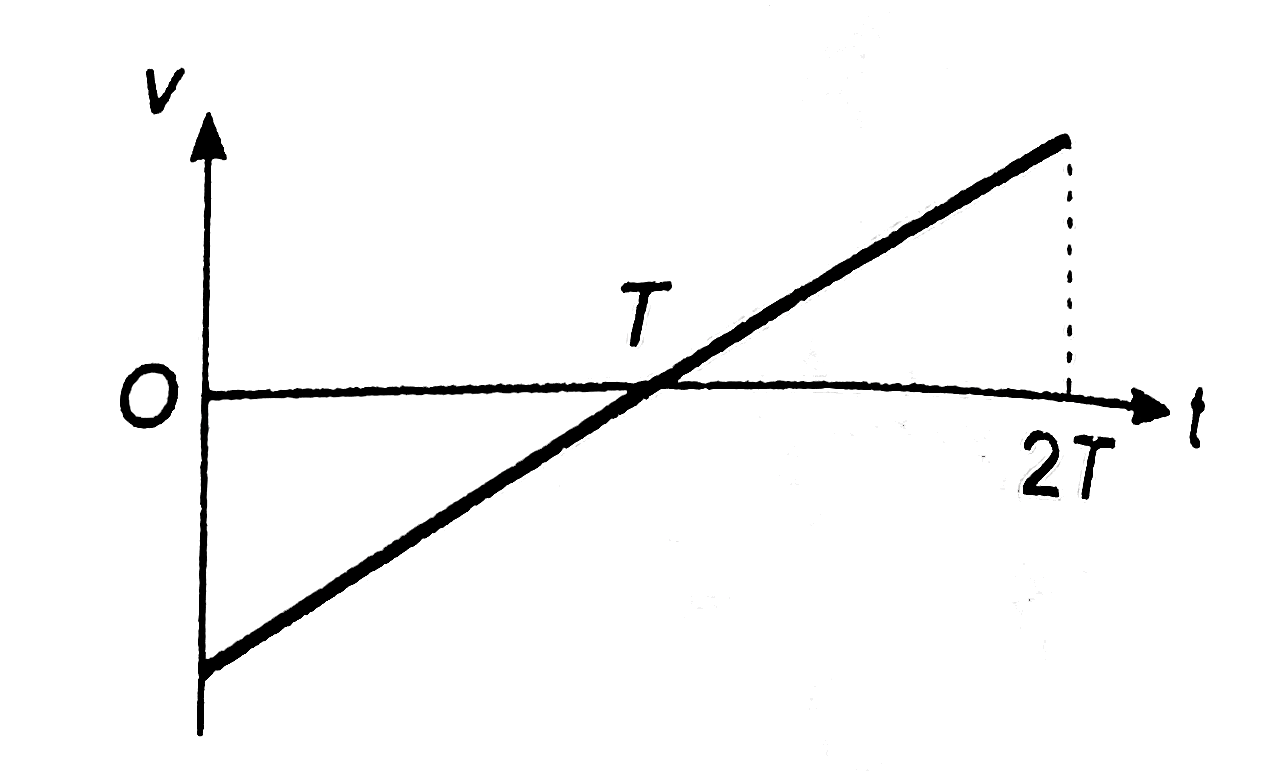
The figure shows the velocity (v) of a particle plotted against time (t).
 View Solution
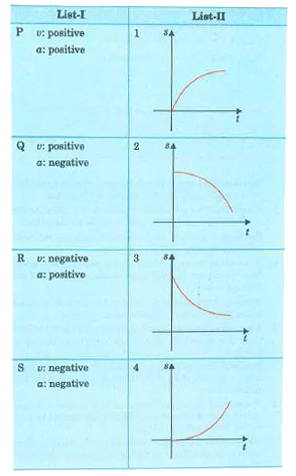
For a particle moving in a straight line assume s,v,a and t represents displacement, velocity, acceleration and time respectively.
 View Solution
The figure shows a velocity-time graph of a particle moving along a straight line
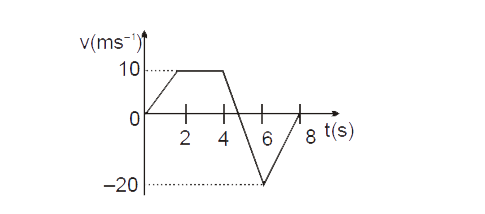
The total distance travelled by the particle isView SolutionFigure shows the velocity time graph of a particle moving along straight line (v is m/s and t is in second). It average velocity in 20 seconds will be:
 .View Solution

