For a given mass of a gas, what is the shape of (pV) versus (T) graph on isothermal process ?
The correct Answer is:A, D
To determine the shape of the (pV) versus (T) graph during an isothermal process for a given mass of gas, we can follow these steps:
1. Understand the Isothermal Process:
- In an isothermal process, the temperature (T) of the gas remains constant. This means that during the entire process, the temperature does not change.
2. Identify the Ideal Gas Law:
- The ideal gas law is given by the equation:
PV=nRT
- Here, P is the pressure, V is the volume, n is the number of moles, R is the universal gas constant, and T is the temperature.
3. Consider the Fixed Mass of Gas:
- Since the mass of the gas is fixed, the number of moles n is constant. Therefore, nR is also a constant value.
4. Analyze the Equation for Isothermal Conditions:
- For an isothermal process, since T is constant, the product PV must also remain constant. This can be expressed as:
PV=constant
- This implies that for any change in pressure or volume, the product PV will not change as long as the temperature remains constant.
5. Graphing PV versus T:
- Now, we need to plot PV on the y-axis and T on the x-axis. Since PV is constant and does not change with temperature in an isothermal process, the graph will be a horizontal line.
- This means that regardless of the value of T, the value of PV remains the same.
6. Conclusion:
- Therefore, the shape of the (pV) versus (T) graph during an isothermal process is a horizontal line, indicating that PV is constant for a fixed mass of gas at a constant temperature.
Final Answer:
The shape of the (pV) versus (T) graph on an isothermal process is a horizontal line.
- In an isothermal process, the temperature (T) of the gas remains constant. This means that during the entire process, the temperature does not change.
- The ideal gas law is given by the equation:
PV=nRT
- Here, P is the pressure, V is the volume, n is the number of moles, R is the universal gas constant, and T is the temperature.
- Since the mass of the gas is fixed, the number of moles n is constant. Therefore, nR is also a constant value.
- For an isothermal process, since T is constant, the product PV must also remain constant. This can be expressed as:
PV=constant
- This implies that for any change in pressure or volume, the product PV will not change as long as the temperature remains constant.
- Now, we need to plot PV on the y-axis and T on the x-axis. Since PV is constant and does not change with temperature in an isothermal process, the graph will be a horizontal line.
- This means that regardless of the value of T, the value of PV remains the same.
- Therefore, the shape of the (pV) versus (T) graph during an isothermal process is a horizontal line, indicating that PV is constant for a fixed mass of gas at a constant temperature.
The shape of the (pV) versus (T) graph on an isothermal process is a horizontal line.
Topper's Solved these Questions
- THERMOMETRY,THERMAL EXPANSION & KINETIC THEORY OF GASESBOOK - DC PANDEY ENGLISHCHAPTER - THERMOMETRY,THERMAL EXPANSION & KINETIC THEORY OF GASESEXERCISE - Exercise 20.4
3 Videos
- THERMOMETRY,THERMAL EXPANSION & KINETIC THEORY OF GASESBOOK - DC PANDEY ENGLISHCHAPTER - THERMOMETRY,THERMAL EXPANSION & KINETIC THEORY OF GASESEXERCISE - Exercise 20.5
7 Videos
- THERMOMETRY,THERMAL EXPANSION & KINETIC THEORY OF GASESBOOK - DC PANDEY ENGLISHCHAPTER - THERMOMETRY,THERMAL EXPANSION & KINETIC THEORY OF GASESEXERCISE - Exercise 20.2
7 Videos
- THERMOMETRY THERMAL EXPANSION AND KINETIC THEORY OF GASESBOOK - DC PANDEY ENGLISHCHAPTER - THERMOMETRY THERMAL EXPANSION AND KINETIC THEORY OF GASESEXERCISE - Medical entrance gallary
30 Videos
- UNIT AND DIMENSIONSBOOK - DC PANDEY ENGLISHCHAPTER - UNIT AND DIMENSIONSEXERCISE - Assertion And Reason
2 Videos
Similar Questions
Knowledge Check
The specific heat of a gas in an isothermal process is
AinfiniteBzeroCnegativeDremains constant
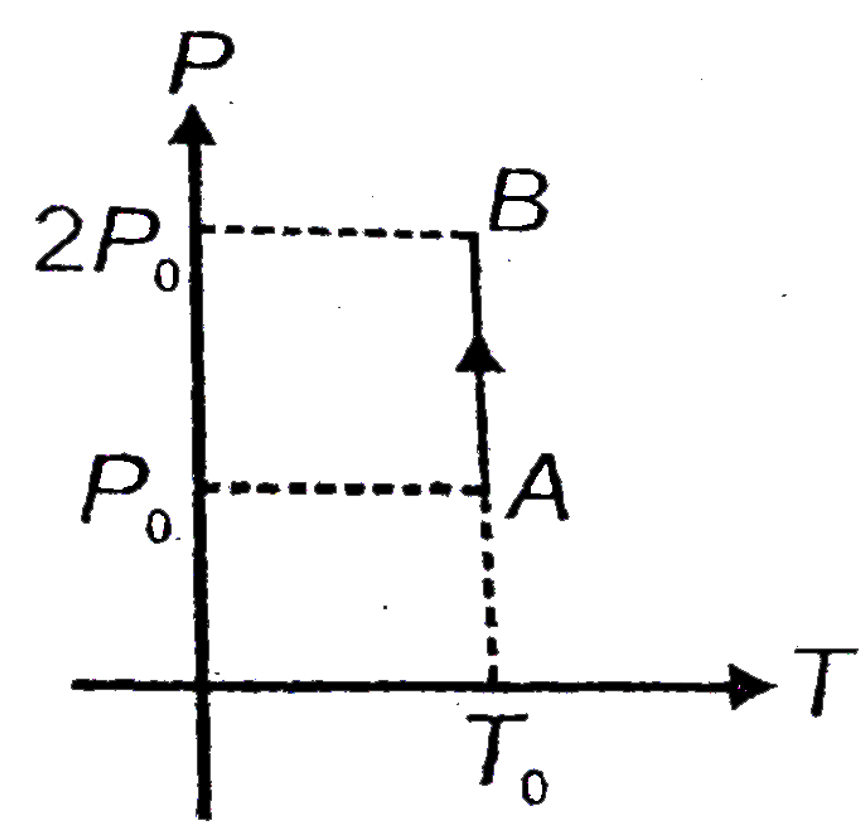
For a given mass of gas the variation of pressure versus temperature is shown in the figure. What is the ratio of volume of the gas at points A and B.
 .
.
View SolutionIf heat is supplied to an ideal gas in an isothermal process.
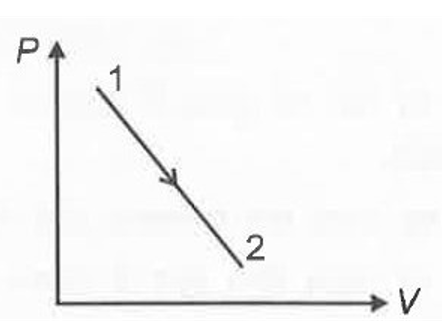
View SolutionA volume V versus pressure P graph was obtained from state 1 to state 2 when a given mass of a gas is subjected to temperature changes. During the process the gas is

View SolutionIn an isothermal process for an ideal gas
View SolutionAssertion: Isothermal and adiabatic, two processes are shown on p-V diagram. Process-1 is aidabatic and process-2 is isothermal.
Reason: At a given point, slope of adiabatic process =γ×slope of isothermal process.

View SolutionLet Q and W denote the amount of heat given to an ideal gas the work done by it in an isothermal process.
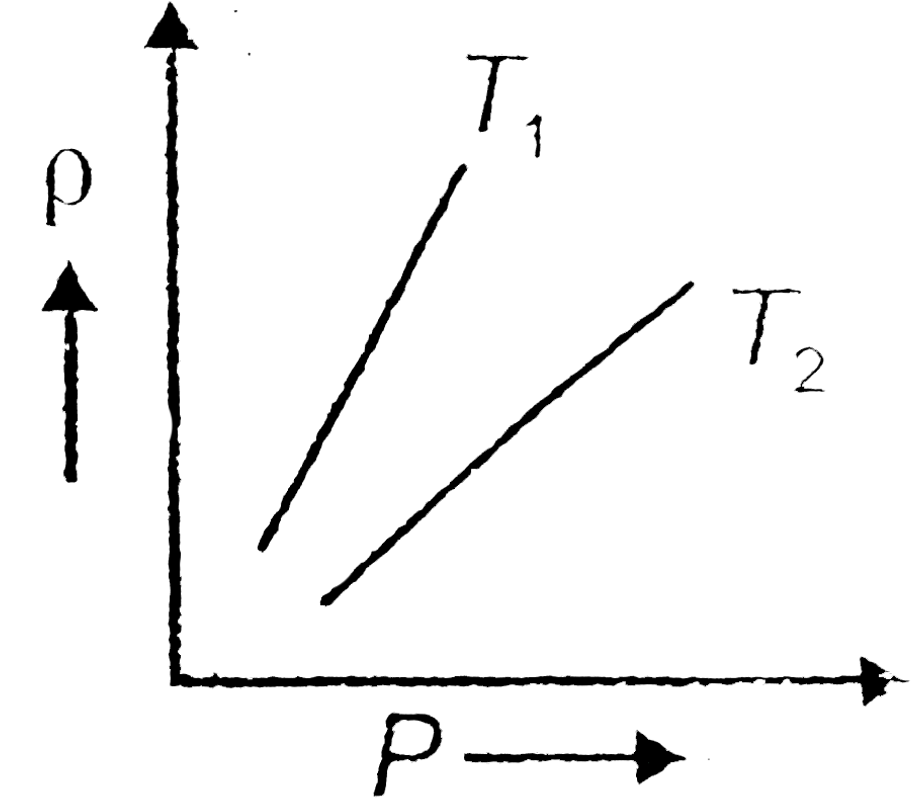
View SolutionThe density (ρ) versus pressure (P) graphs of a given mass of an ideal gas is shown at two temperatures T1andT2. Then relation between T1andT2 may be

View Solution
