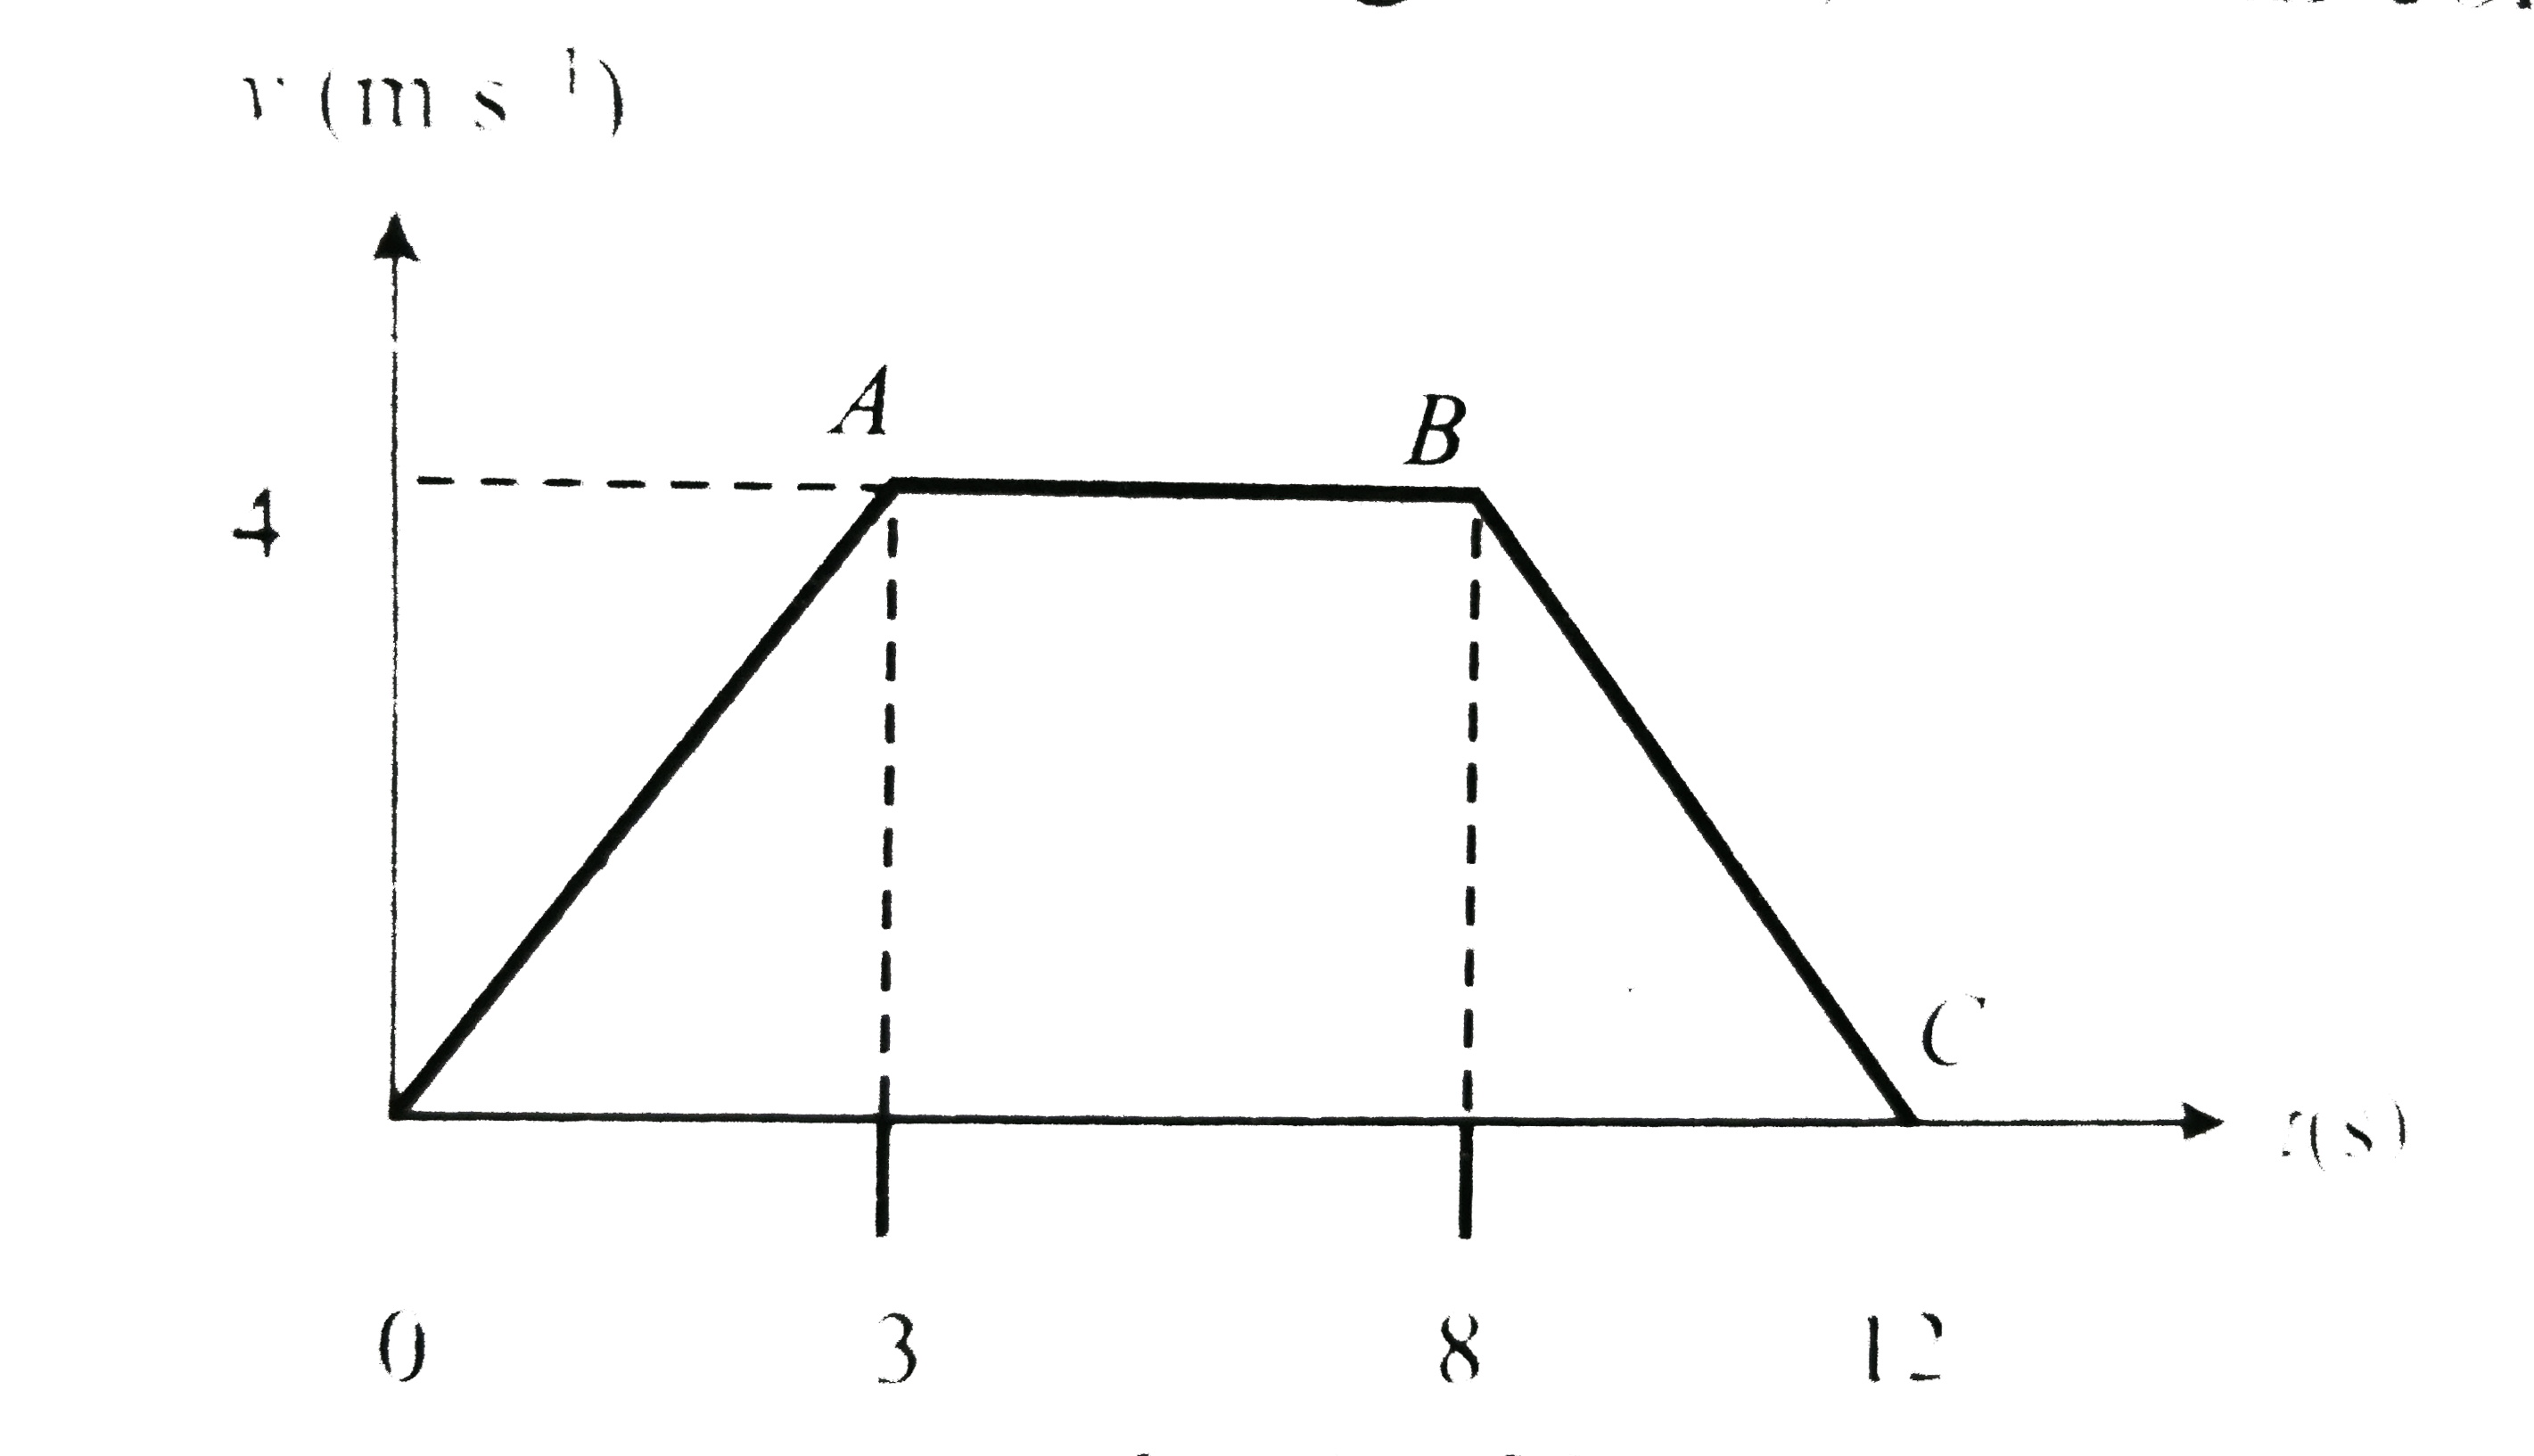
From athe velocity time graph, given in of a particle moving in a straight line, one can conclude that
 .
.
Its average velocity during the 12s interval is 24/7ms−1.
Its velocity for the first 3s is uniform and is eual to 4ms−1.
The body has a constant acceleration between t=3s and t=8s.
The body has a uniform retardation from t=8s to t=12s.
The correct Answer is:D
Displacemeant in 12s =Area undr v−t groph
=12×(12+5)4=34m
Vav=DesplacementTime=3412=176ms−1
Hence, (a) is incorrect, (b) is incorrect because during first 3s, velocity increases from= to 4ms−1 option, (c ) is incorrect, because in part AB velocity is constant.
Topper's Solved these Questions
- KINEMATICS-1BOOK - CENGAGE PHYSICSCHAPTER - KINEMATICS-1EXERCISE - Graphical cancept
1 Videos
- KINEMATICS-1BOOK - CENGAGE PHYSICSCHAPTER - KINEMATICS-1EXERCISE - Multiple Correct
16 Videos
- KINEMATICS-1BOOK - CENGAGE PHYSICSCHAPTER - KINEMATICS-1EXERCISE - Single Correct
52 Videos
- GRAVITATIONBOOK - CENGAGE PHYSICSCHAPTER - GRAVITATIONEXERCISE - INTEGER_TYPE
1 Videos
- KINEMATICS-2BOOK - CENGAGE PHYSICSCHAPTER - KINEMATICS-2EXERCISE - Exercise Integer
9 Videos
Similar Questions
Knowledge Check
The velocity-time graph of a particle is not a straight line. Its acceleration is
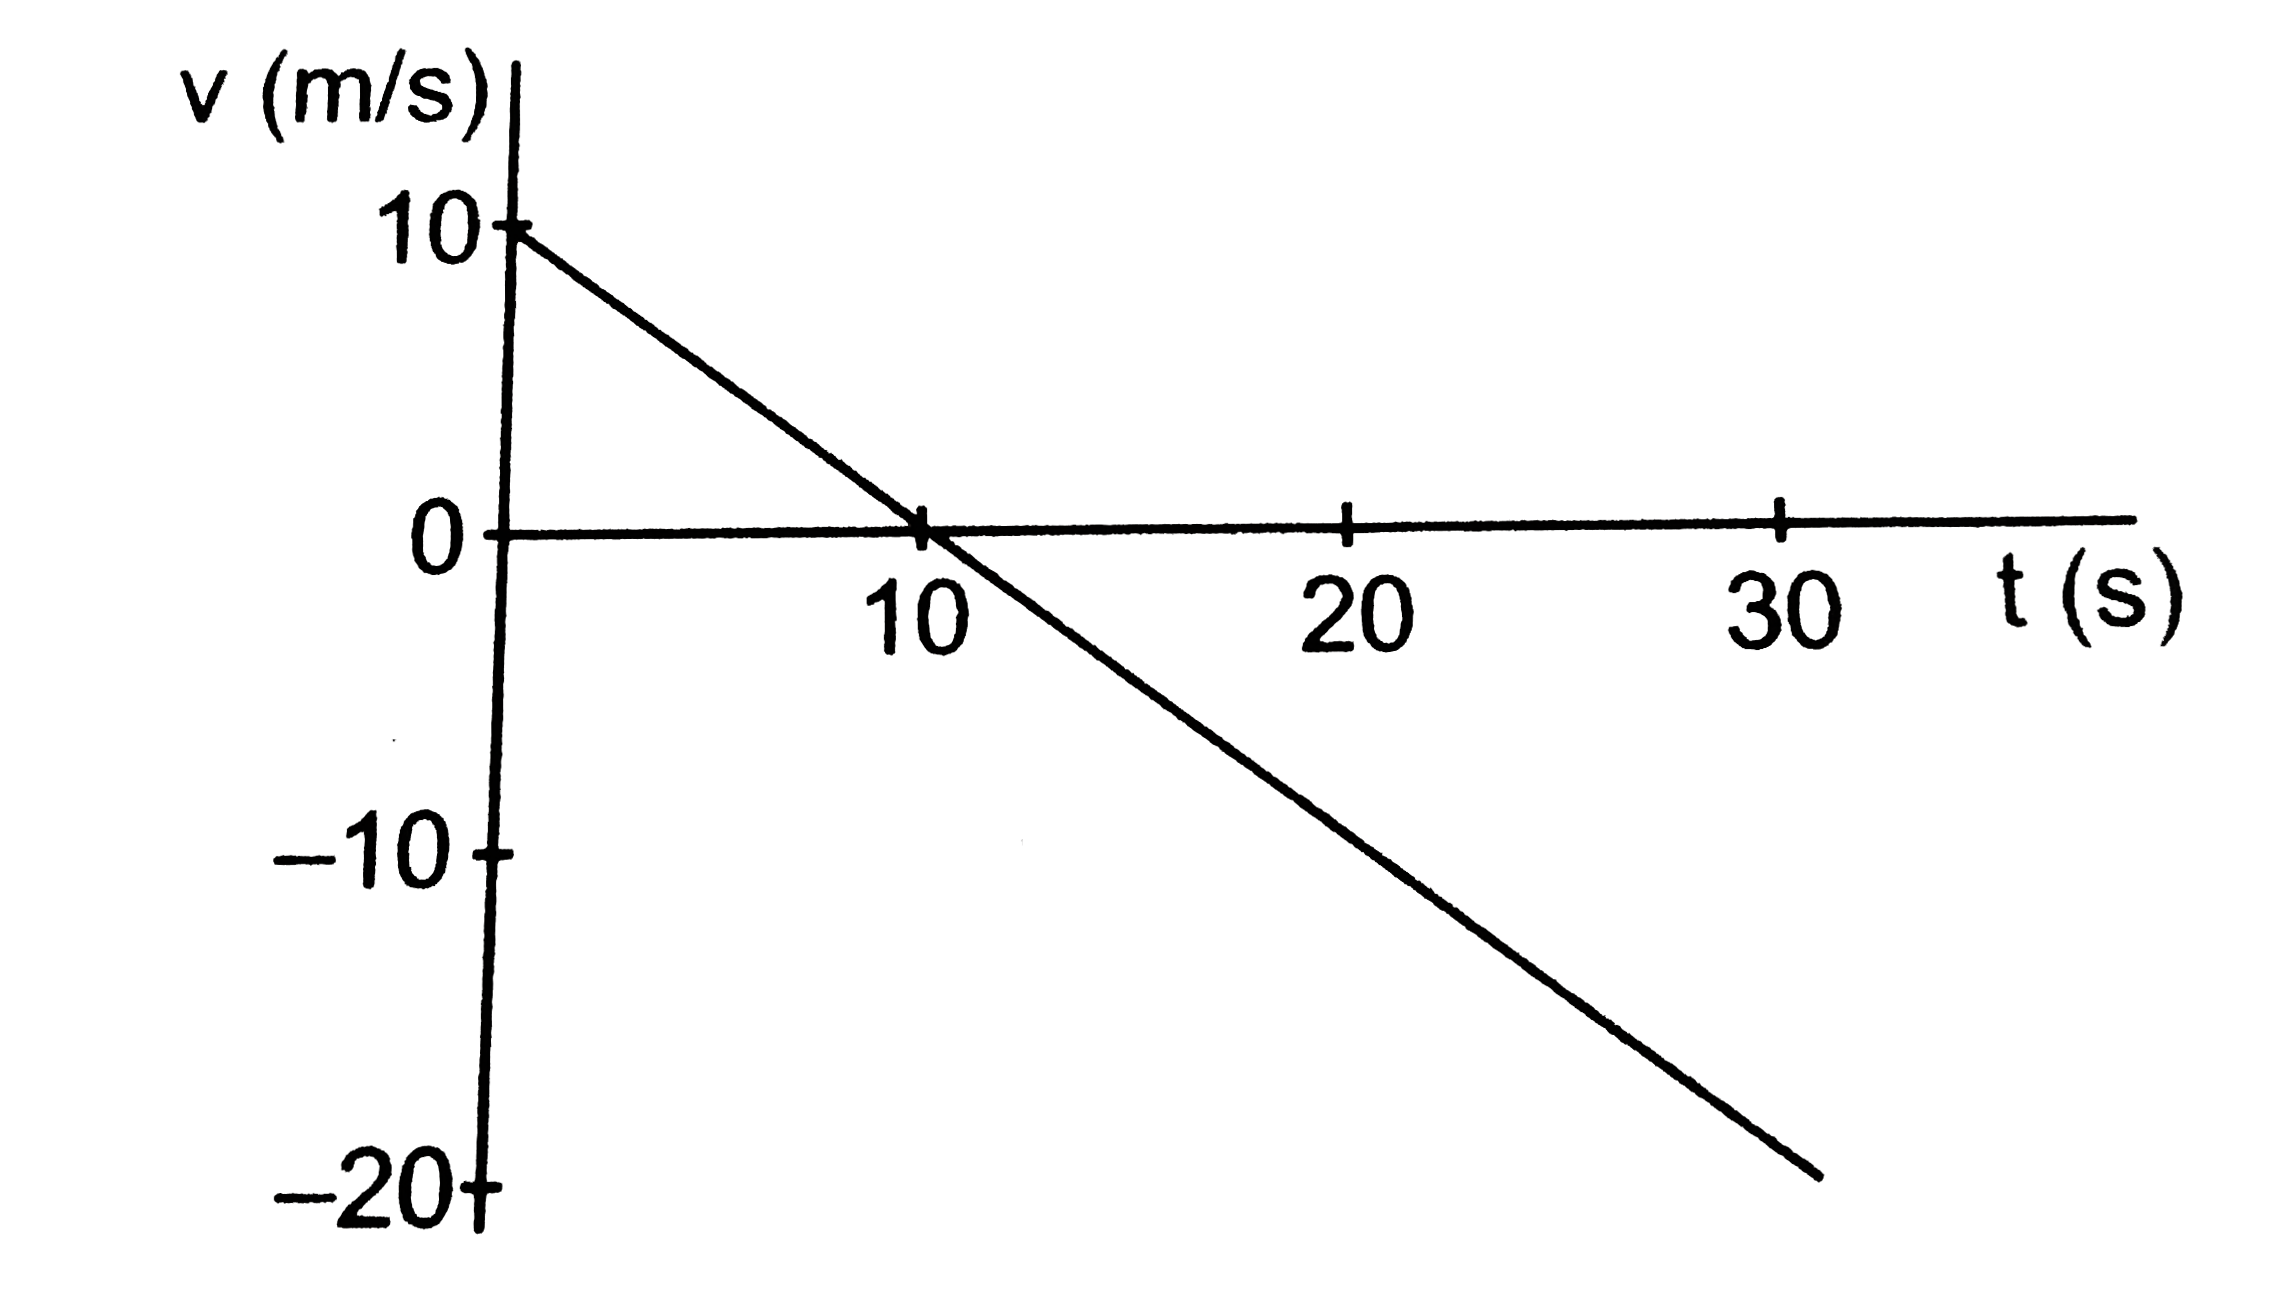
AzeroBconstantCnegativeDvariableThe velocity-time plot for a particle moving on a straight line is shown in figure.
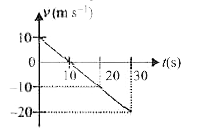 AThe particle has a constant acceleration.BThe particle has never tumed around.CThe particle has zero displacement.DThe average speed in the interval 0 to 10 s is the same as the average speed in the interval 10s to 20 s.
Velocity displacement graph of a particle moving in a straight line is as shown in figure.
 Amagnitude of acceleration of particle is decreasingBmagnitude of acceleration of particlre is increasingCacceleration versus displacement graph straight lineDacceleration versus displacement graph is parabola
The figure shows a velocity-time graph of a particle moving along a straight line
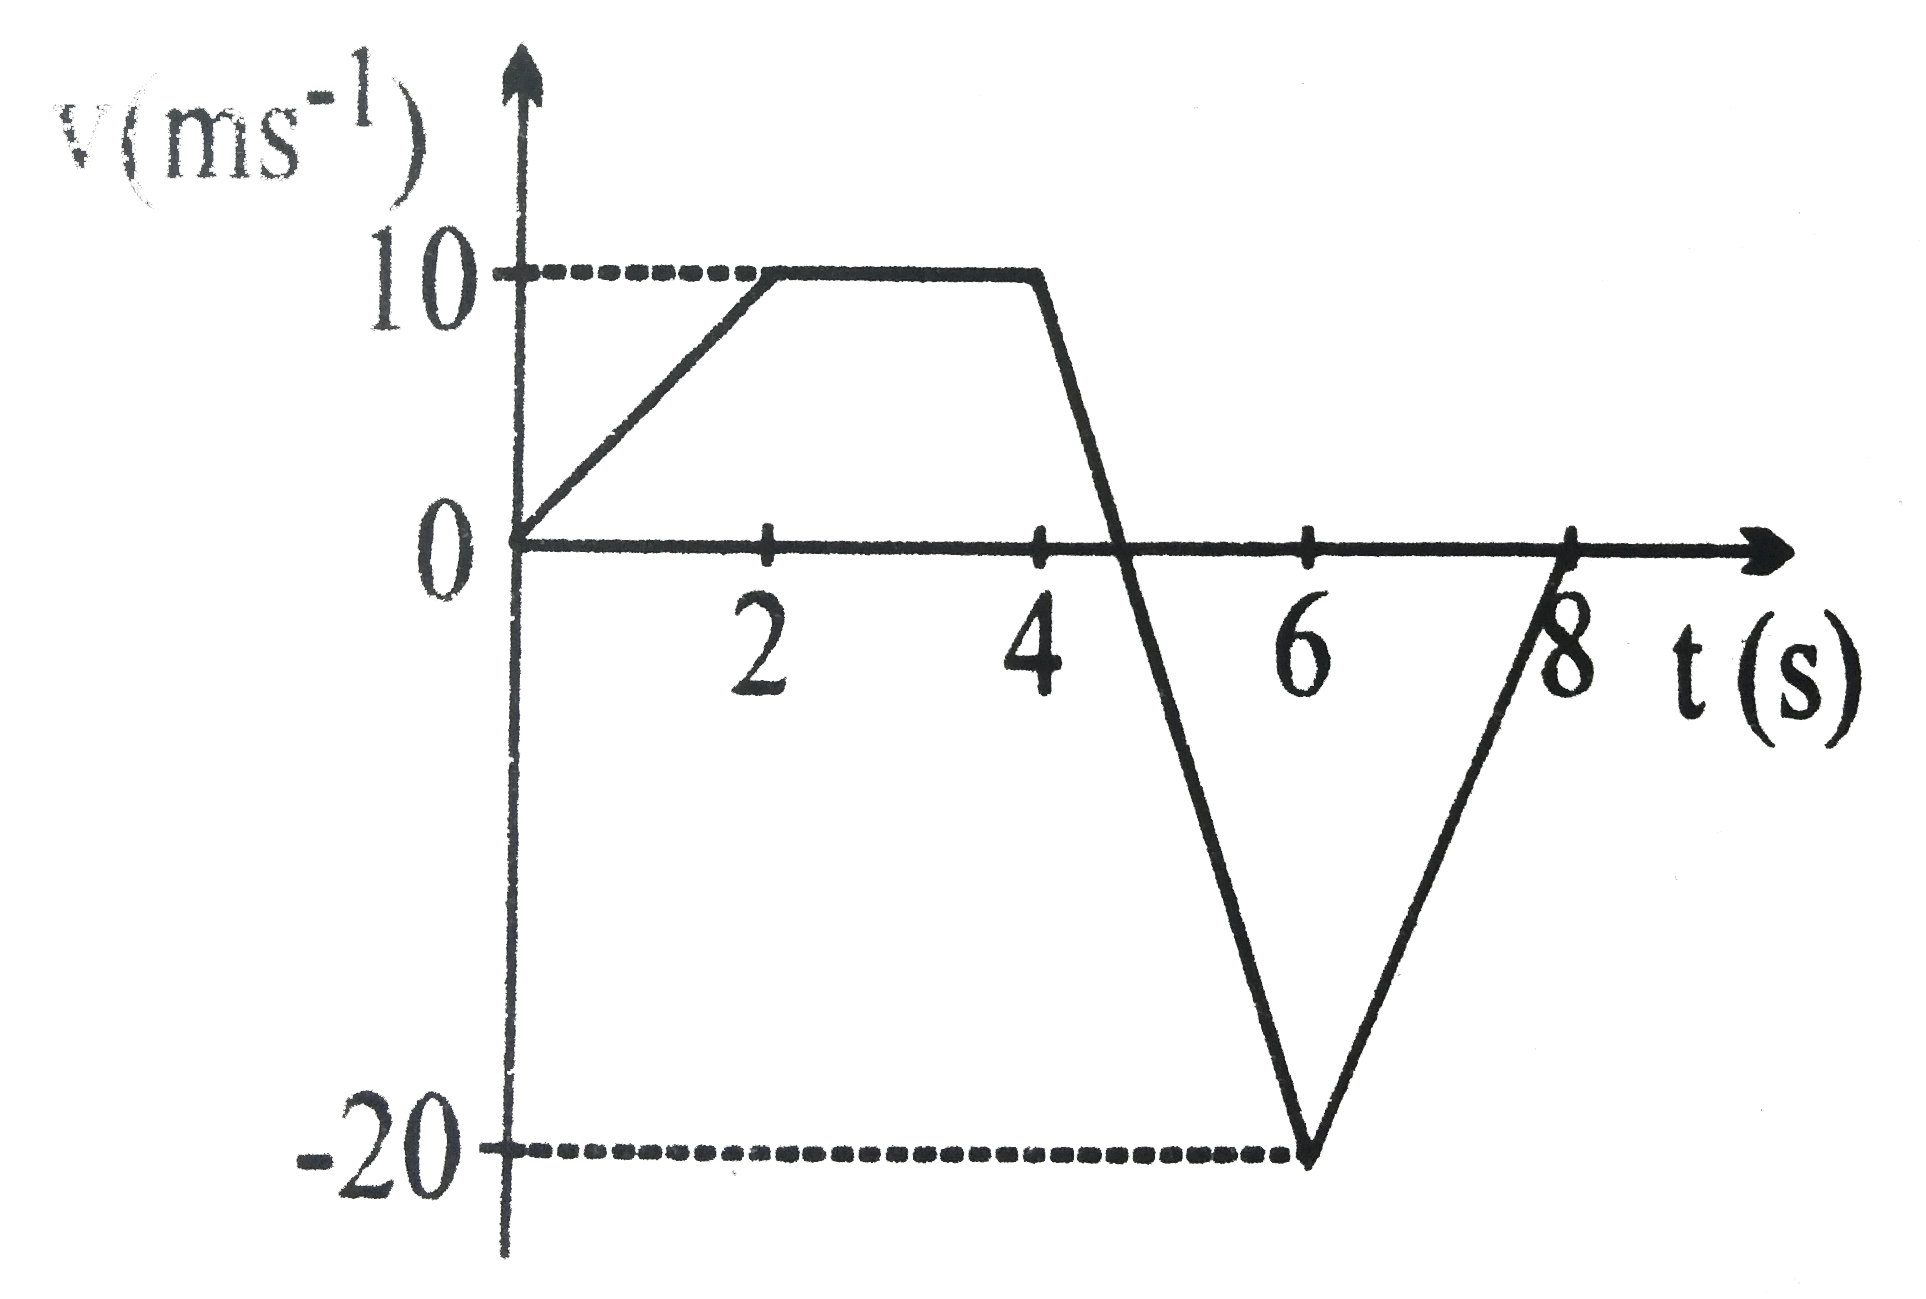
Choose the incorrect statement. The particle comes to rest at
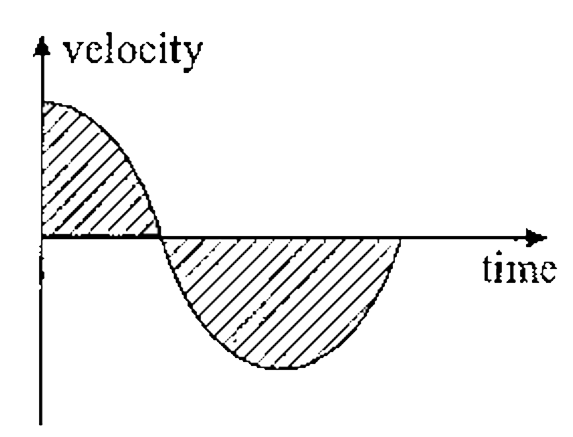
View SolutionThe diagram shows the velocity-time graph for a particle moving in a straight line. The sum of the two shaded areas represents :
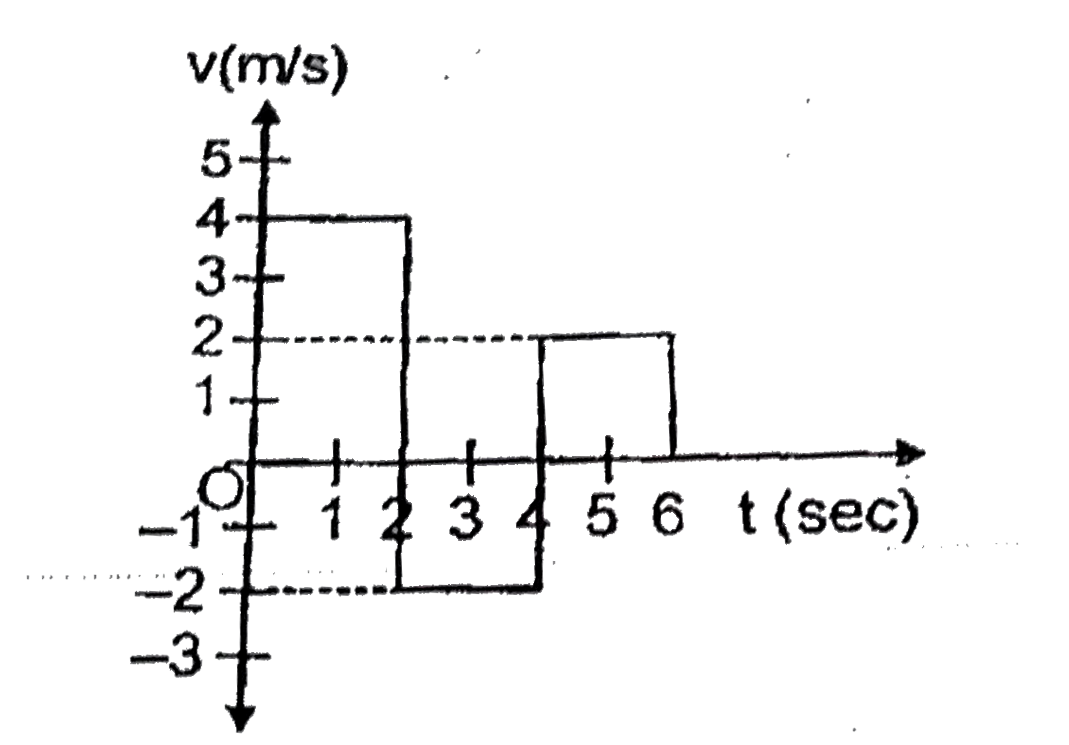
View SolutionThe velocity-time graph of a body moving in a straight line is shown in the figure.
View SolutionThe velocity time plot for a particle moving on straight line is shown in the figure.
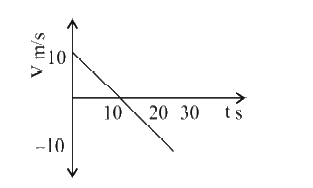
View SolutionThe velocity- time plot for a particle moving on a straight line is shown in the figure
View Solution


