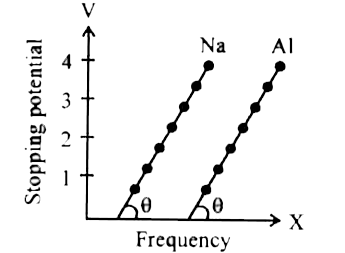
From the graph of stopping potential against frequency for Na and Al, we infer that

Al is a better photosensitive material than Na
The stopping potentials are different for Na and Al for the same change in frequency
Maximum kinetic energy for both the metals vary linearly with the frequency
Na and Al both have the same threshold frequency
The correct Answer is:C
In photoelectric effect 12mv2max=eV
∴ K.E. ∝ V(stopping potential)
Stopping potential varies linearly with the frequency.
∴ Maximum K.E. for both the metals vary linearly with the frequency.
Topper's Solved these Questions
- ELECTRONS AND PHOTONS BOOK - MARVEL PUBLICATIONCHAPTER - ELECTRONS AND PHOTONS EXERCISE - TEST YOUR GRASP - 17
15 Videos
- ELECTROMAGNETIC INDUCTION AND ALTERNATING CURRENTS BOOK - MARVEL PUBLICATIONCHAPTER - ELECTROMAGNETIC INDUCTION AND ALTERNATING CURRENTS EXERCISE - TEST YOUR GRASP - 16
30 Videos
- ELECTROSTATICSBOOK - MARVEL PUBLICATIONCHAPTER - ELECTROSTATICSEXERCISE - TEST YOUR GRASP
20 Videos
Similar Questions
Figure shows the graph of stopping potential verus that frequency of a photosensitive metal. The plank's constant and work funcation of the metal are
_S01_035_Q01.png)
View SolutionDraw a graph showing the variation of stopping potential with frequency of the incident radiation. What does the slope of the line with frequency axis indicate? What information can be obtained from the values of intercept on the potential axis?
View Solution
Knowledge Check
In a photoelectric experiment, a student plotted the graph of stopping potential (Vs) against the frequency of incident radiation (v). But he could not write the unit of the slope of the graph. What is the corrent unit ?
AJ.A.BC/J-sCJ/s/CDJ/AIn photoelectric effect experiment, the slope of the graph of the stopping potential versus frequency gives the value of :
AheBhCehDhceFigure shows the graph of stopping potential verus that frequency of a photosensitive metal. The plank's constant and work funcation of the metal are
_S01_035_Q01.png) A(V2+V1v2+v2)e,(V2v1+V1v2v2+v1)eB(V2+V1v2−v1)e,(V2v1+V1v2v2−v1)eC(V2−V1v2+v1)e,(V2v1−V1v2v2+v1)eD(V2−V1v2−v1)e,(V2v1−V1v2v2−v1)e
A(V2+V1v2+v2)e,(V2v1+V1v2v2+v1)eB(V2+V1v2−v1)e,(V2v1+V1v2v2−v1)eC(V2−V1v2+v1)e,(V2v1−V1v2v2+v1)eD(V2−V1v2−v1)e,(V2v1−V1v2v2−v1)e
Draw a graph between stopping potential and the frequency of two metals A and B having threshold frequencies v0and2v0 .
View SolutionDraw a graph showing the variation of stopping potential with frequency of the incident on a metal plate. How can the value of Planck's constant be determined from this graph?
View SolutionDefine photoelectric effect. Draw a graph to show the variation of stopping potential with frequency of incident radiation on a metal plate.
View SolutionExplain the term stopping potential and threshold frequency.
View SolutionThe slope of the graph drawn between stopping potential and frequency of incident radiation will be
View Solution
